Materials
All the chemicals were analytical grade and purchased from Merck (Darmstadt, Germany). Antibodies directed against HO-1 and β-actin were obtained from Cell Signaling Technology (Danvers/MA, USA).
Plant material and extract preparation
Rose dried petals and dried rhizomes of the licorice and jatamansi were purchased in April (2013) from local herbal store of Tehran and authenticated by one of authors (G. Amin), and voucher specimens (Rosa damascena Mill. [Rosaceae; No: PMP-507], Glycyrrhiza glabra L. Var glabra [Papilionaceae; No: PMP-221] and Nardostachys jatamansi DC. [Valerianaceae; No:PMP-220] were deposited in the herbarium of faculty of pharmacy, Tehran University of Medical Sciences. Dried sample of each plant (150 g) was extracted with ethanol (70%) at room temperature for 4 days. Each extracted solution was filtered and evaporated to dryness at 40 °C to yield residues about 19.65, 17.86, and 14.67 % on the basis of dried plant material for R. damascena, G. glabra, and N. jatamansi respectively.
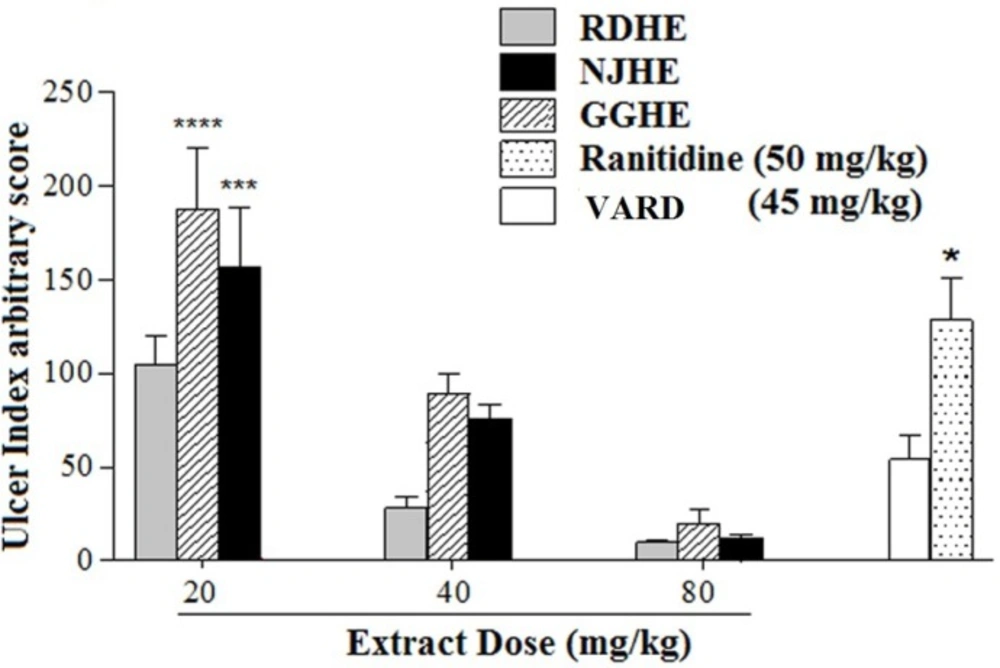
VARD formula was prepared from the dried extracts of R. damascena, G. glabra, and N. jatamansi respectively by the ratio of 2:1:1 to the dose of 45 mg/Kg which contains 22.5 mg/Kg, 11.25 mg/Kg and 11.25 mg/Kg of R. damascena, G. glabra, and N. jatamansi respectively in it.
Determination of total phenolic content
Total phenolics of each sample were determined using folin-ciocalteu reagent (
25). Each prepared sample (1 mL) was mixed with folin-ciocalteu reagent (1.5 mL) which previously diluted 10-fold with distilled water, and allowed to stand at room temperature for 5 min. 1.5 mL of bicarbonate solution (60 g/L) was added to the mixture. After incubation for 90 min at room temperature, the absorbance was measured at 725 nm using a UV-visible spectrophotometer (GBC, Cintra 40). Total phenolics were quantified by calibration curve obtained from measuring the absorbance of the known concentrations of gallic acid standard solutions. All tests were carried out in triplicate and the results were expressed as gallic acid equivalents (mg GAE/g dry weight).
Determination of total flavonoid content
Total flavonoid content was determined by the aluminum chloride colorimetric method (
26). Concisely, 1 mL of each prepared sample was added to 10 mL volumetric flask containing 4 mL of double distilled water. 0.3 mL NaNO
2 (5%) was added to the flask and 5 min later 0.3 mL AlCl
3 (10%) was added. After 6 min, 2 mL NaOH (1 M) was added and the total volume was made up to 10 mL and the flask contents were thoroughly mixed
. The absorbance level was measured versus blank at 510 nm (GBC, Cintra 40). Total flavonoid contents were represented as mg catechin equivalents (CE) per one gram dry extract according to the catechin standard solutions.
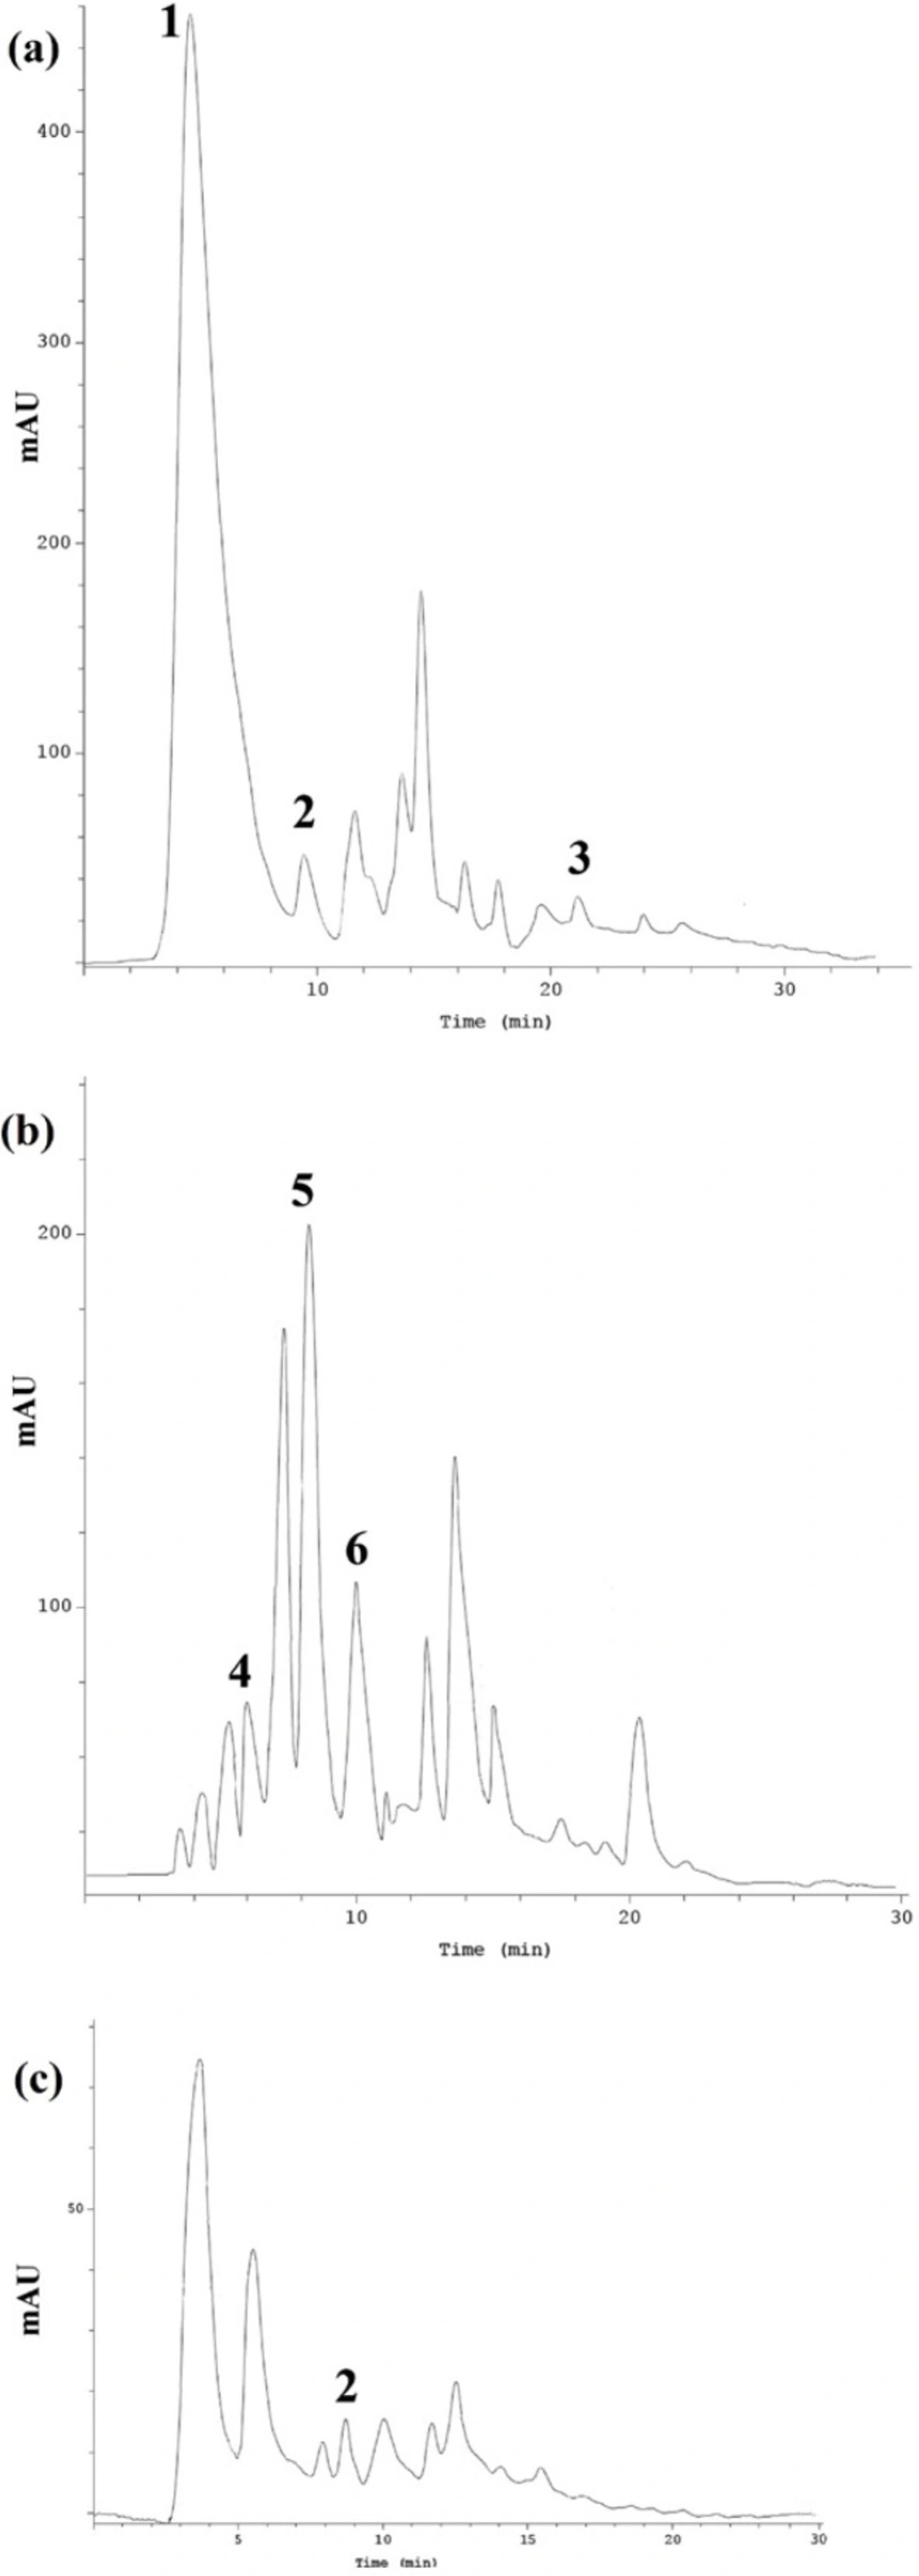
High performance liquid chromatographic analysis
Each sample was analyzed by Knauer HPLC (Germany) system consisting of a pump (Maxi-Star K-1000, Knauer, Germany), a degasser, an automated injector, a column oven, and aUV detector. The system was controlled by EuroChrom 2000 software (Version 1.6, Knauer Co., Germany). For determination of the phenolic compounds in samples, chromatographic conditions were evaluated and optimized in Eurospher-100 C18 column (5 μM, 4.6 × 250 mm). Column temperature was maintained at 30 °C. Mobile phase consisting of methanol (A) and acetic acid in water (B) (3:97 v/v), and the flow rate was set at 1 mL/min. The chromatographic detection was monitored at 280 nm.
Glycyrrhizic acid determination in G. glabra
The detection of glycyrrhizic acid in
G. glabra was also carried out using another HPLC method (
27). Column temperature was maintained at 25 °C. Mobile phase consisting of acetic acid, acetonitril, H
2O (1:38:68 v/v), and the flow rate was set at 1 mL/min. The chromatographic detection was monitored at 254 nm. The injection volume for all samples was 10 μL. Compounds were identified according to the retention times as a comparison with the corresponding standards. The concentration of each compound was measured from peak area based on calibration curves. All amounts were expressed as milligram per gram of the dry extracts (mg/g).
Animals
Wistar male rats weighting between 180 and 220 g were used in this study. Animals were left under standard conditions (23 ± 2 °C, 12 light-dark cycles) and had free access to water and standard pellet diet. Food was withdrawn 24 h before experiments, though they had free access to water. For each group, seven rats were used. Animal experiments have been carried out under standard condition according to the ethical guidelines of committee of Tehran University of Medical Sciences for animal study.
Gastric ulcer induction by ethanol
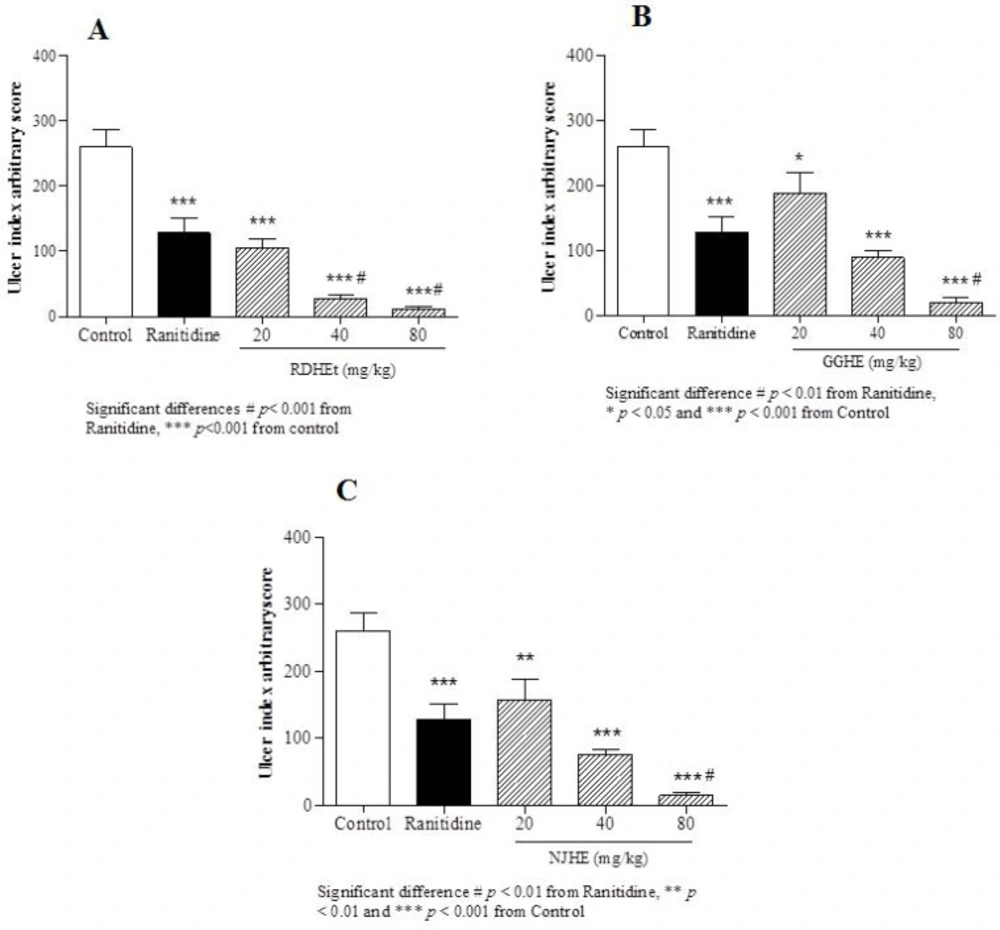
Rats were randomly divided into 12 groups comprising seven individuals in each group. Following 24 h fasting period, animals were orally received distilled water (1mL/200 g of body weight) as control group, ranitidine (50 mg/Kg), plant extracts at different doses (20, 40 and 80 mg/Kg), or VARD (45mg/Kg) in separate groups. Subsequent to 1 h all groups received ethanol 80% (1 mL/200 g of body weight). Following 2 h after ethanol administration, animals were sacrificed, stomachs were removed and rinsed with normal saline (NaCl 0.9%), and cut along great curvature speared on a flat surface and examined macroscopic for ulceration scoring (
28).
Measurement of ulcer index and calculation of protection percentage
Gastric ulcers were measured macroscopically and scored with an arbitrary system:
Score 1: each fifth petechia was calculated as 1 mm
Score 2: lesion length between 1 and 2 mm
Score 3: lesion length between 2 and 4 mm
Score 4: lesion length between 4 and 6 mm
Score 5: lesion length more than 6 mm
The ulcer index (UI) was calculated in each animal group by the following formula (
28):
Where, i is score number and ni is number of ulcers of score ith.
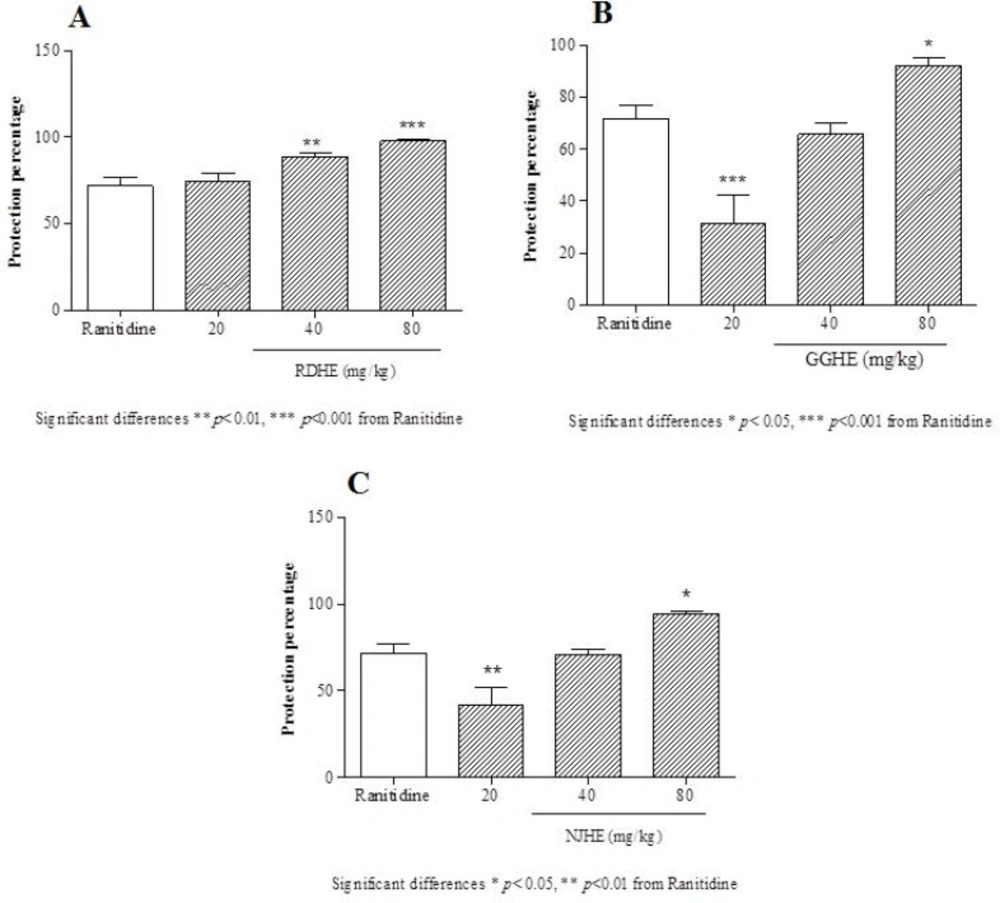
The protection percentage was calculated using the following formula (
28):
Where, UIc and UIt are the ulcer indexes of control and test groups, respectively.
Histological survey
For microscopic examination, gastric tissues were fixed in freshly made 10% formaldehyde and processing and sectioning steps were conducted afterwards. Microscopic slides were stained by hematoxylin–eosin methods. Finally, sections were analyzed using a light microscope (
29).
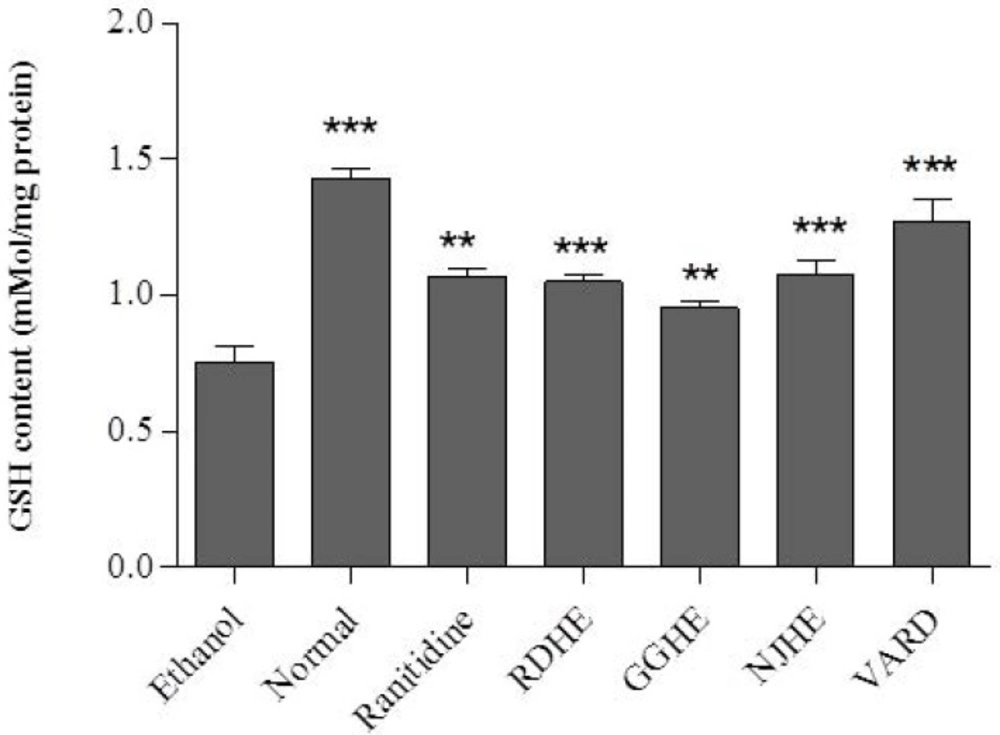
Determination of glutathione levels
Reduced glutathione (GSH) levels were determined using dithionitrobenzoic acid (DTNB) method in whole cell lysate of the gastric tissue at 412 nm (
30).
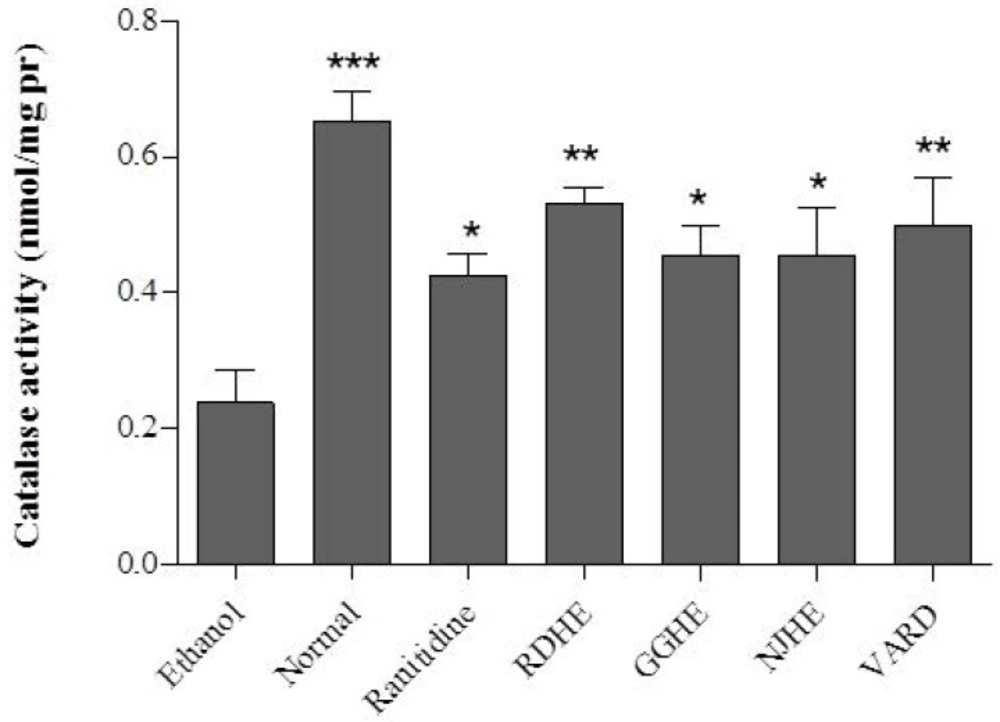
Catalase activity assay
Catalase (CAT) activity was assessed by Aebi method (
31). Briefly, tissue lysate (200 μL) was added to a cuvette containing 50 mM phosphate buffer (pH 7.0); subsequently, 1 mL of freshly prepared 30 mM H
2O
2 was added to start the reaction. The rate of the substrate (H
2O
2) decomposition was further evaluated at 240 nm.
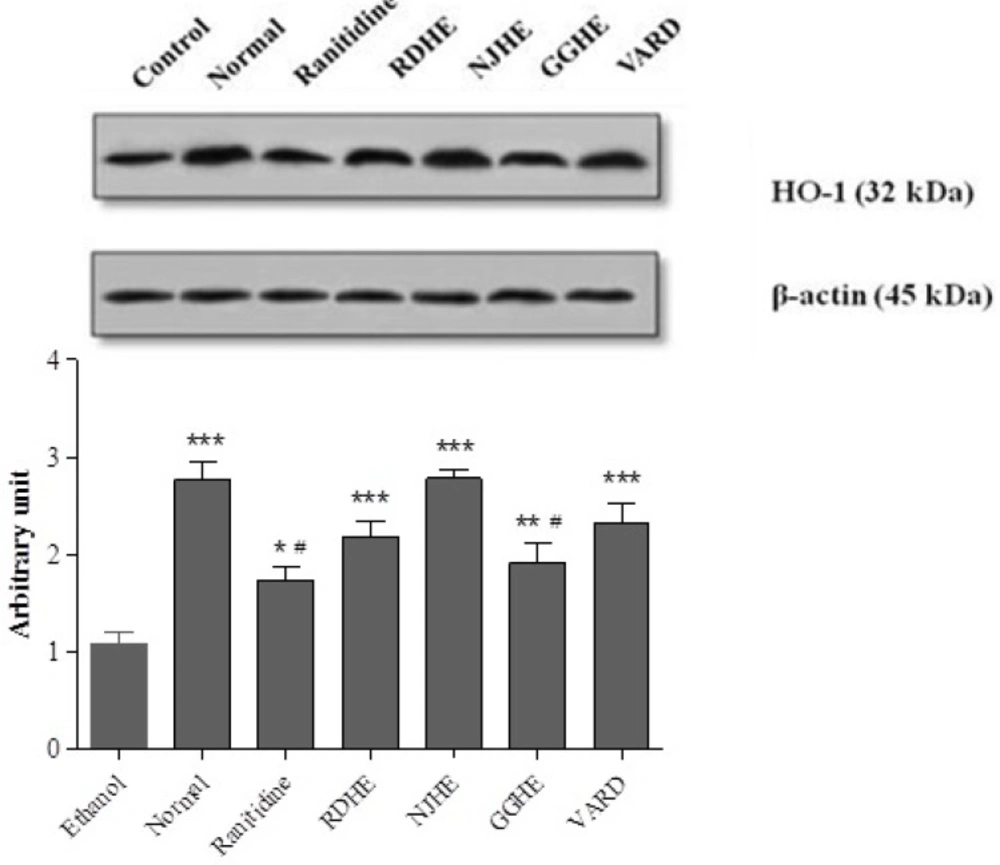
Western blot analysis
Gastric tissues were harvested into lysis buffer containing complete protease inhibitor cocktail. Protein concentrations were determined according to the Bradford’s method (
32). Electrophoresis of the total proteins was conducted in 12.5% SDS-PAGE gels, and then proteins were transferred on polyvinylidene fluoride membranes, probed with specific HO-1 and secondary antibodies. Immunoreactive polypeptides were detected by chemiluminescence using enhanced ECL reagent (Amersham Bioscience, USA) and autoradiography. By densitometric scan of films, the results were quantified. Data analysis was done by ImageJ, via measuring integrated density of bands in triplicate after background subtraction.
Statistical analysis
Results were expressed as mean ± SEM. The statistical difference between each two determined groups was calculated by using one-way ANOVA and new man-keuls multiple comparison post hoc tests. The significance analysis was performed using the Graphpad Prism 5.0.