Animals
Twenty four male Wistar rats (180–250 g) were used. Animals were housed in a room with ambient temperature of 22 ± 2 °C, a 12-h light/dark cycle and free access to water and food. They were allowed to habituate to the housing facilities 1 week prior to the behavioral testing. The recommendations and policies of the International Association for the Study of Pain (
30) and the Institutional Animal Welfare Law were considered in all procedures of experiment. All study protocols were approved by the internal deputy for animal research and the respective local government committee which is advised by an independent ethics committee in our faculty.
The animals were divided into four groups: control, diabetic, morphine tolerated, and diabetic morphine tolerated. Each group was containing 6 rats which were used only once.
Drug preparation
Morphine sulfate, Alloxan and Naloxone (Sigma, U.S.A.), all were dissolved in distilled water. Morphine and Naloxone were injected intraperitoneally (IP), and Alloxan was administered via subcutaneous (SC) route under the skull′s skin between the ears.
Induction of experimental diabetes
The diabetes was induced by a single injection of Alloxan (100 mg/Kg, SC). 72 h after Alloxan administration, the urinary glucose level was measured colorimetrically using a tape-test. Animals with serum glucose levels higher than 300 mg/dL were considered as the diabetic rats and below this level were omitted.
Induction of tolerance
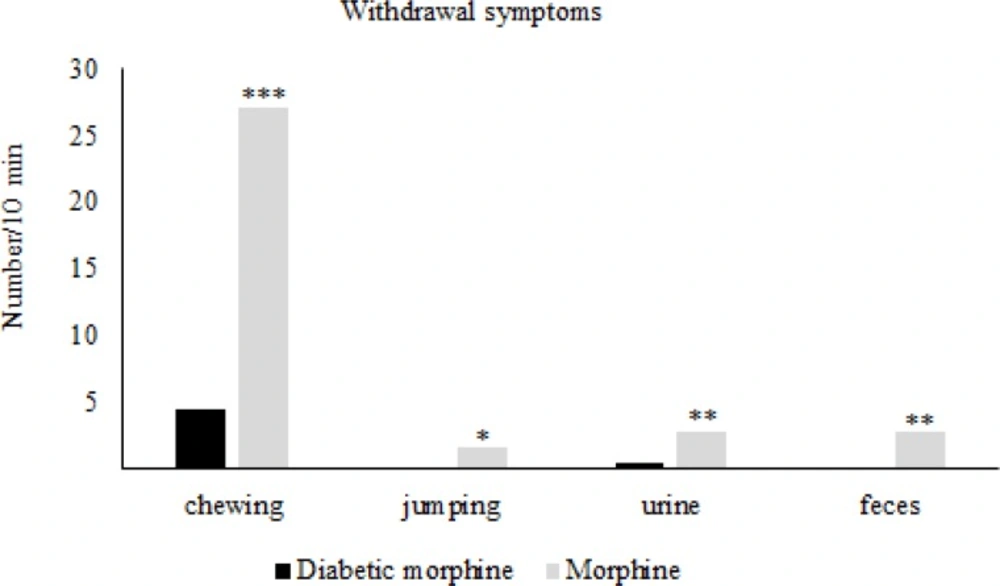
For the induction of tolerance in rats, repeated doses of morphine sulfate (10 mg/Kg, IP) were administered once daily for 7 consecutive days. To assess the tolerance to morphine antinociception effect, the Hot-Plate test was used and after the occurrence of tolerance ,for confirmation, the withdrawal signs (jumping, chewing, urine and feces) were recorded for ten minutes in morphine tolerated animals by the use of Naloxone (2 mg/Kg IP) which was injected thirty minutes after the last morphine dose.
Nociceptive testing
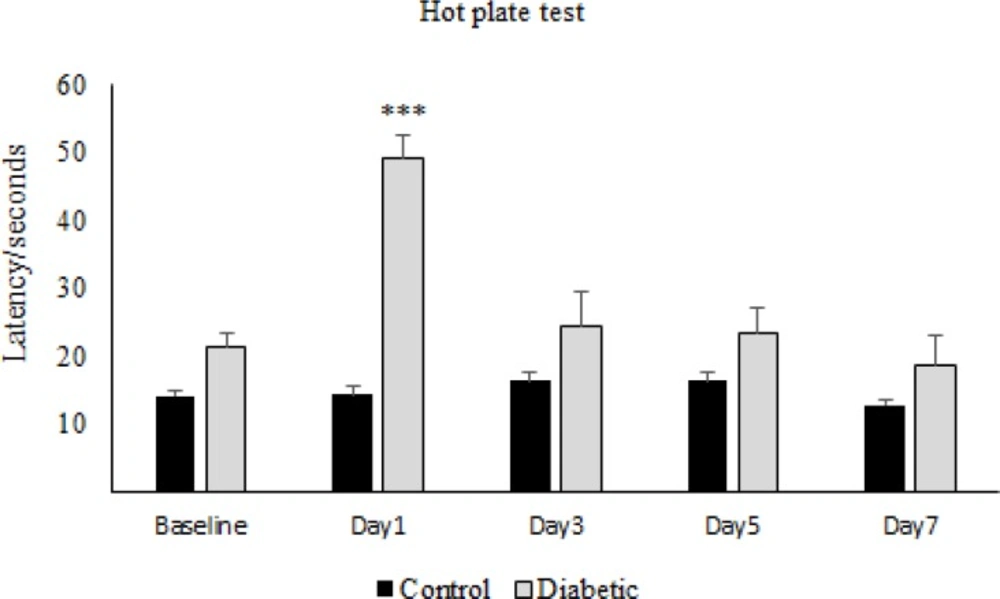
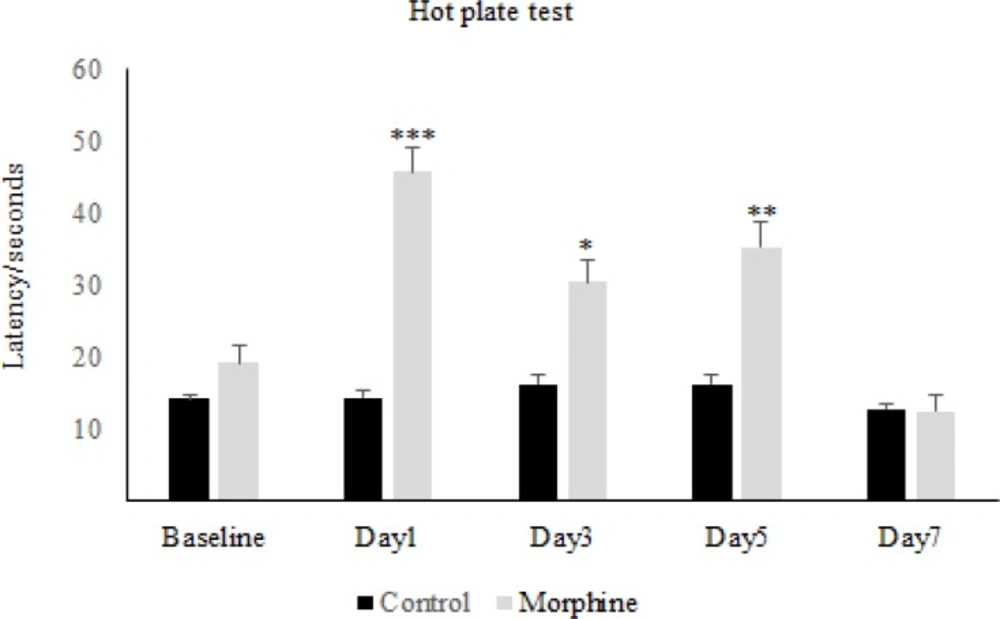
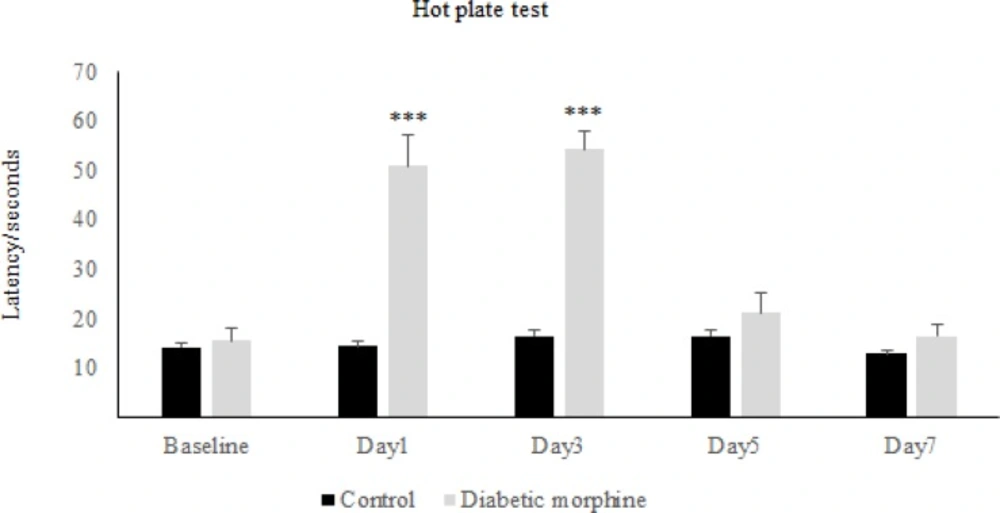
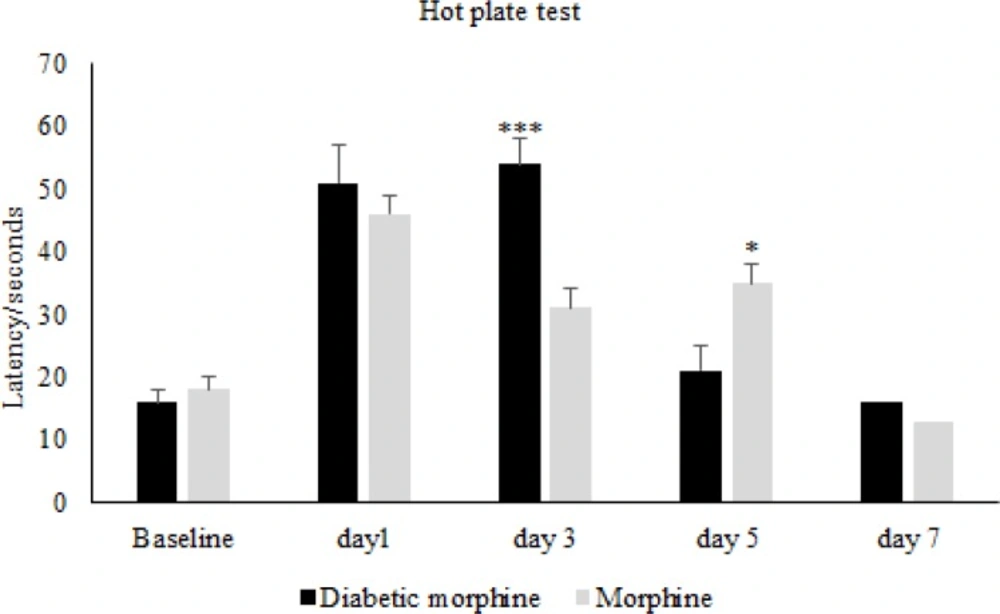
The nociceptive threshold was measured by hot-plate test. Animals were placed on the hot plate (55 ± 0.5 °C) and Paw Withdrawal Latency (PWL) was recorded according to the procedure described by Eddy and Leimback in 1953 (
31). The reaction time measured was either hind paw licking or the plate jumping off. The cut-off point imposed was 60 s to avoid tissue damage (
32), and paw edema or redness with repeated testing was not observed. Baseline latency was determined first, and the morphine analgesia was evaluated 30 minutes after the injection of the drug every other day.
The Control Group
The distilled water as the vehicle of Alloxan was injected once SC in rats of control group and also IP every day as the vehicle of morphine. The nociceptive testing was also evaluated in the same manner in this group.
Tissue isolation
Three rats were randomly selected in each group and after CO2 inhalation were sacrificed. Afterwards, the spinal cord and brain were isolated and stored at -80 ºC for further molecular study.
RNA isolation
For RNA extraction, the RNX plus (Sinaclon), chloroform (Merck), isopropanol (Merck) and TE buffer (10 mM Tris, pH 8.0 with HCl, 1 mM EDTA) were used throughout the Sinaclon protocol. The integrity and quality of RNA samples were assessed by spectrophotometry and horizontal electrophoresis.
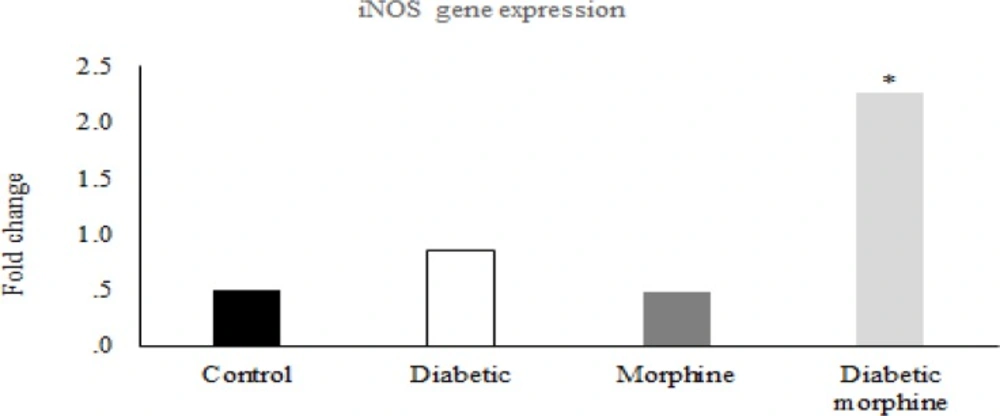
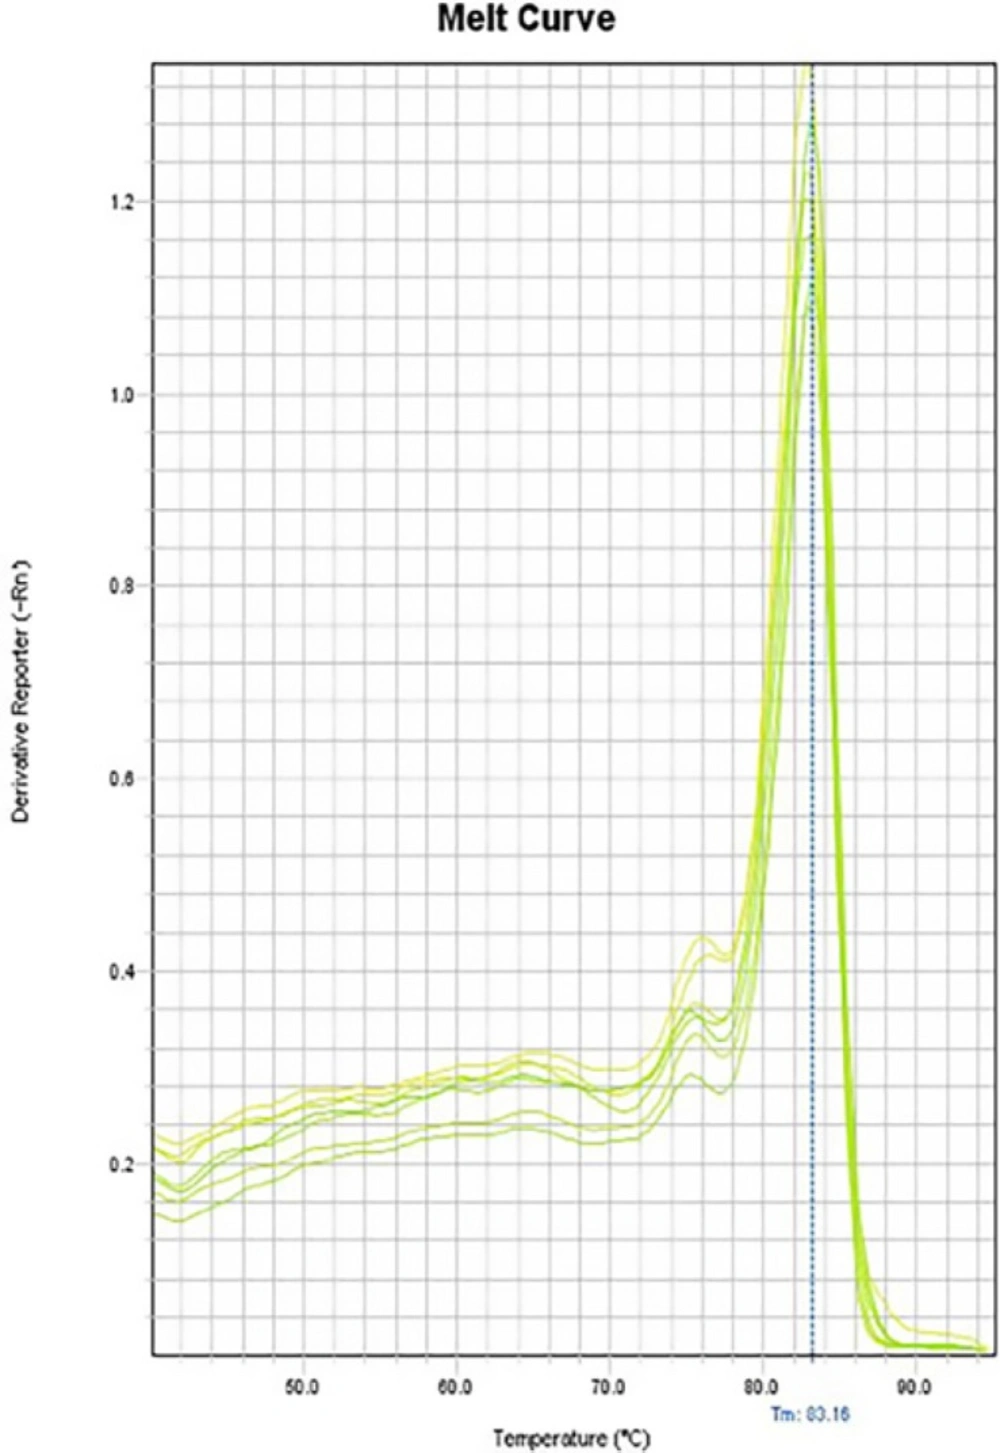
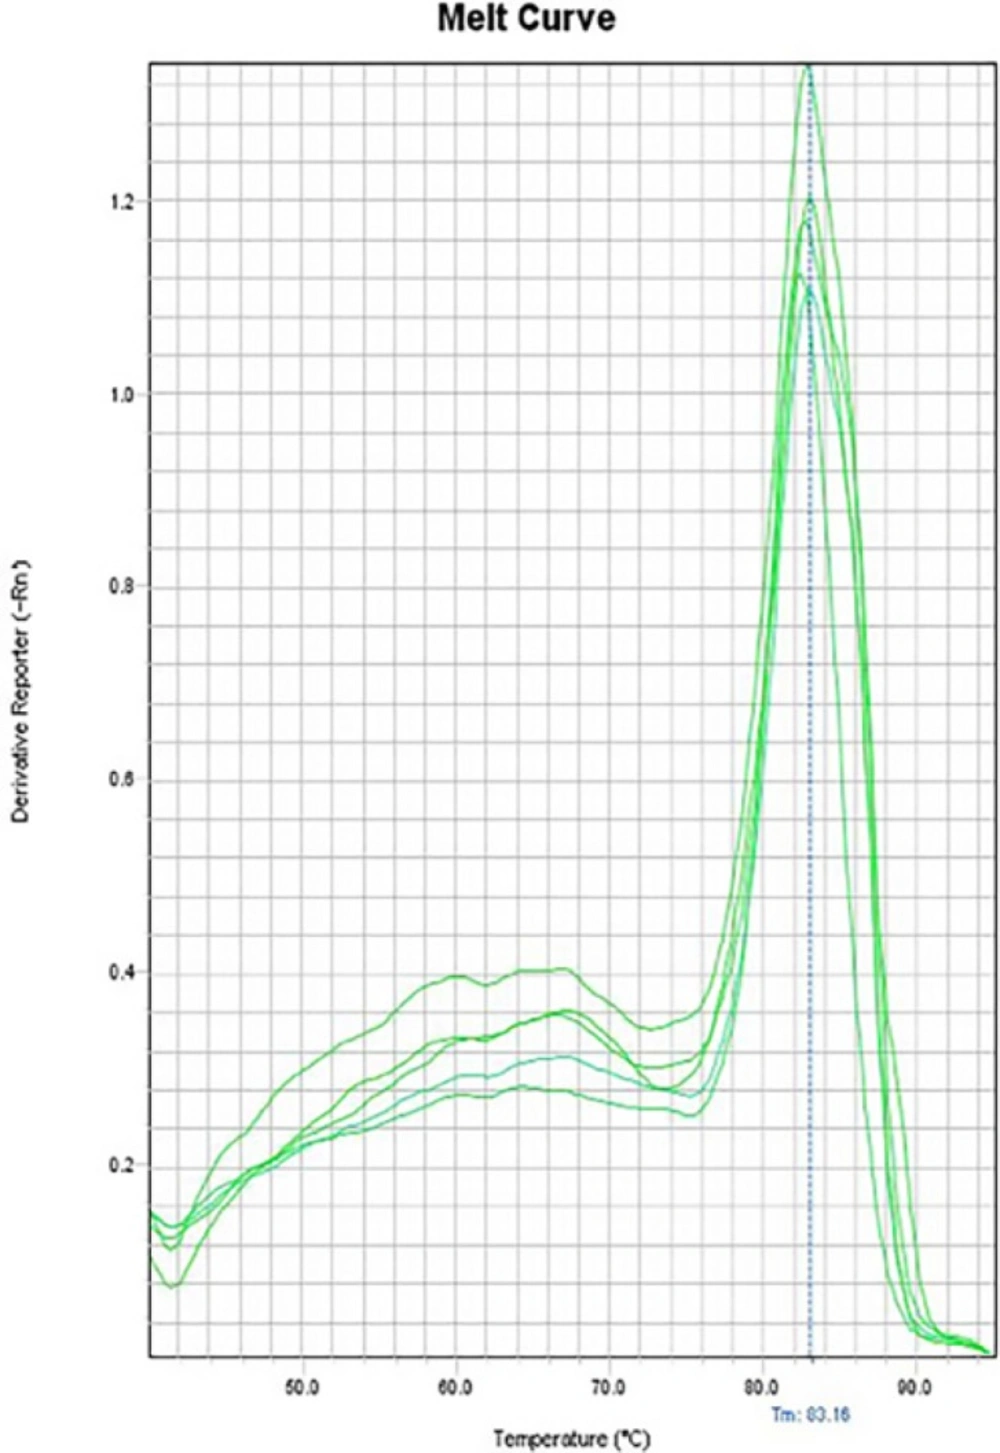
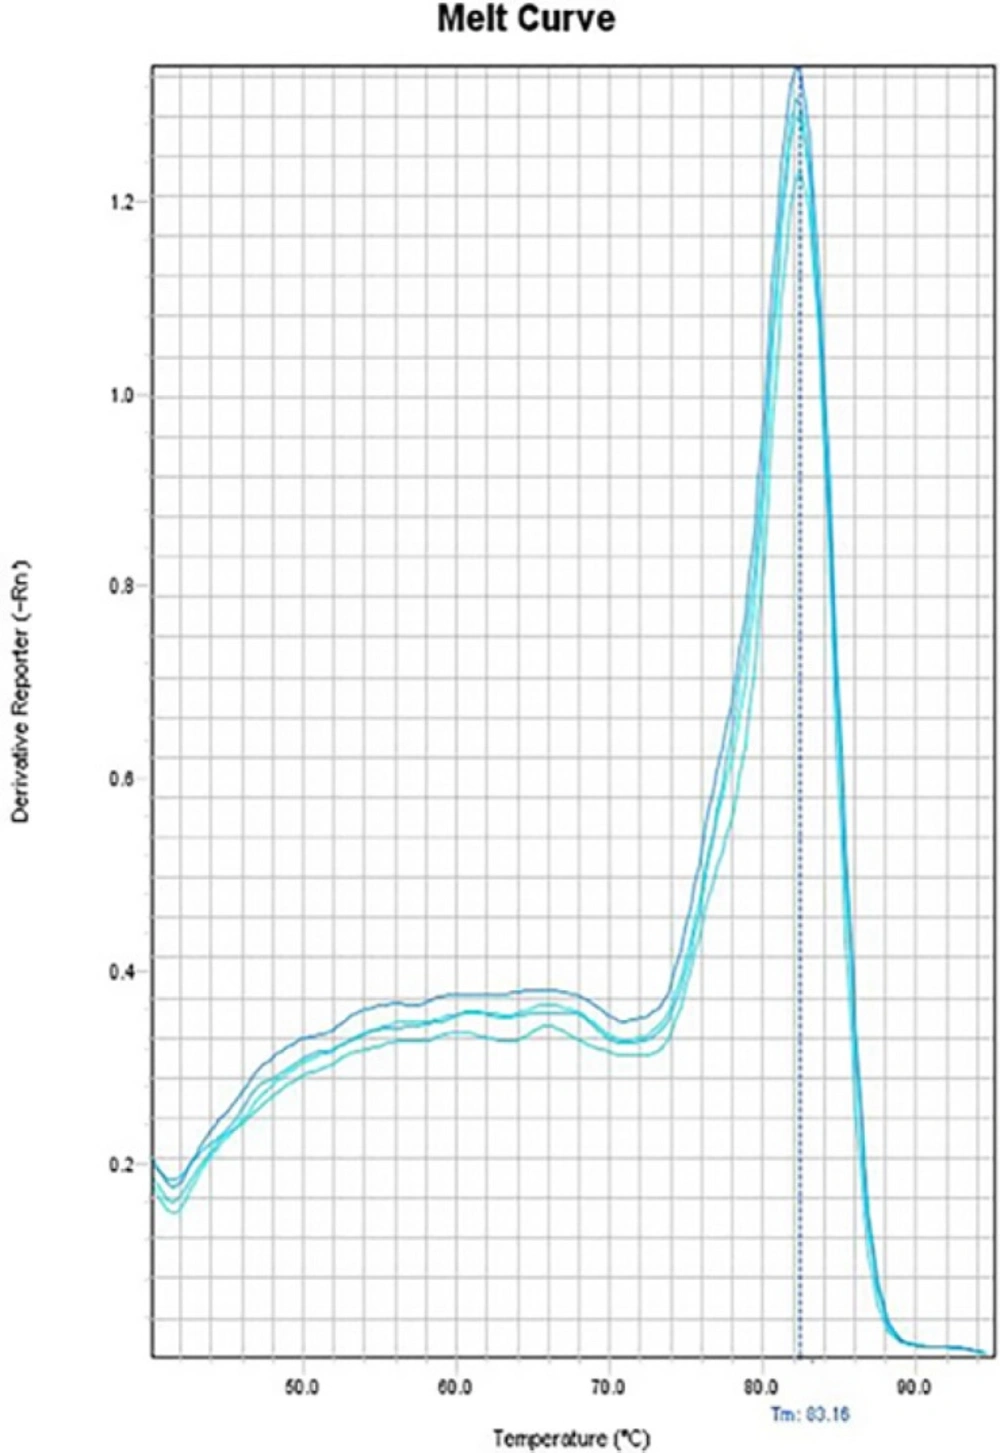
Real-time PCR analysis
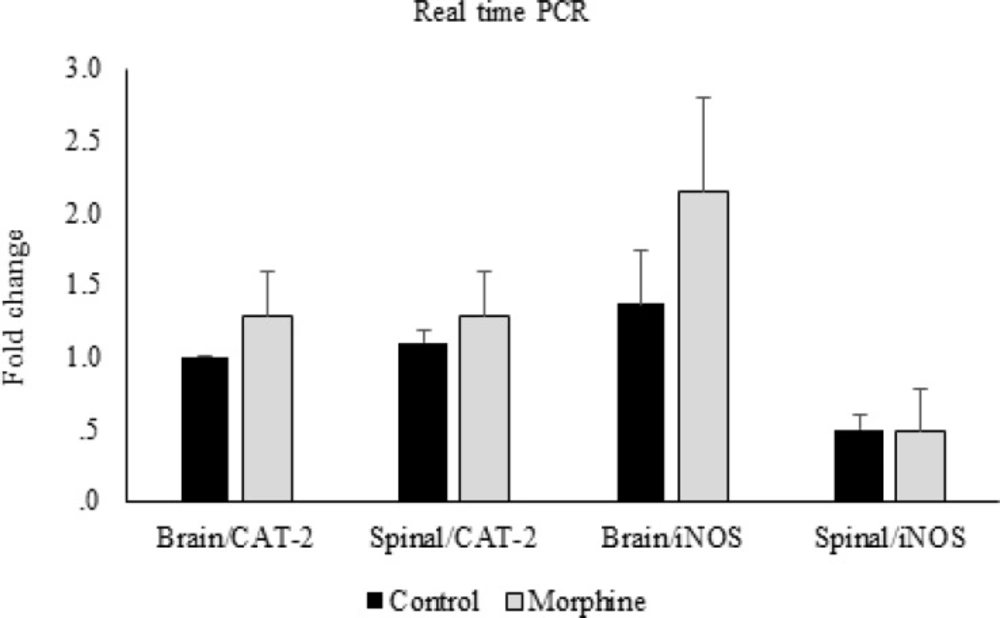
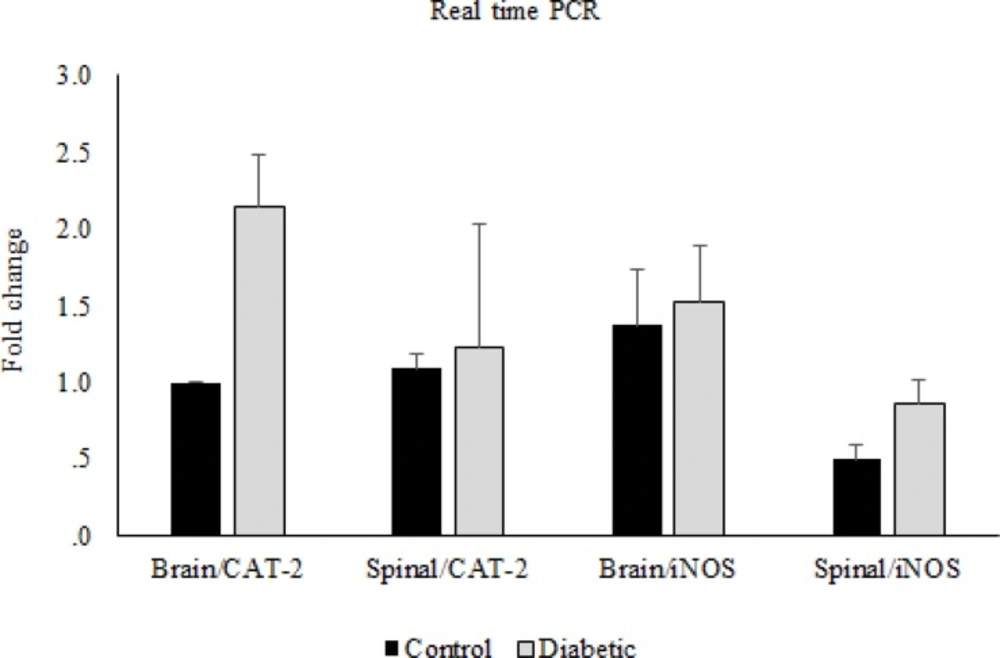
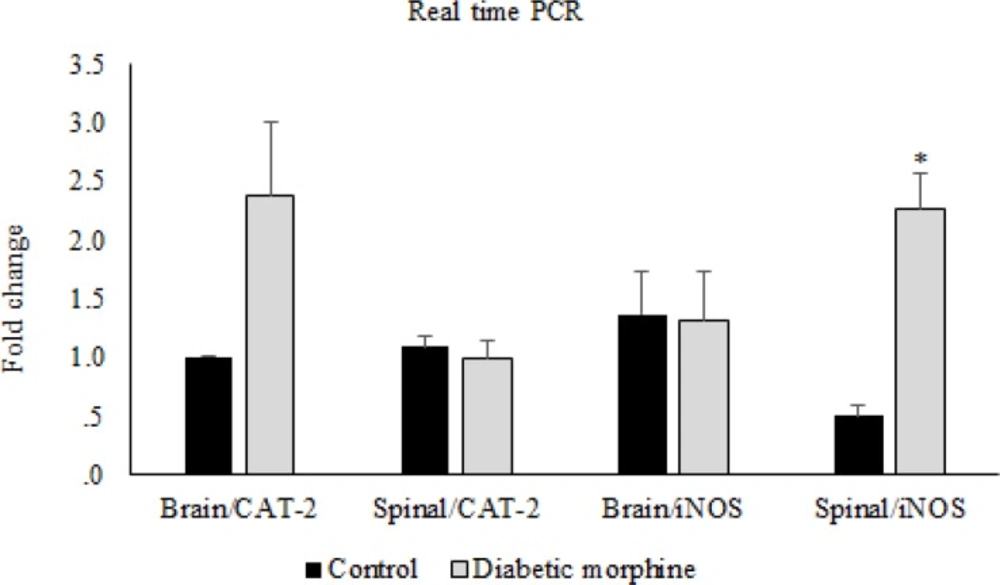
Reverse transcription was carried out using M-MuLV reverse transcriptase (Thermoscientific) from 1 µg of total RNA, according to the manufacturer’s protocol. Quantitative real-time PCR was performed to determine the expression of iNOS and CAT-2 with SYBR Green PCR master mix (Applied Biosystems, Foster City, CA, USA) using an Applied Biosystems step one instrument. Relative mRNA levels were calculated using the comparative CT method as described by the manufacturer (Applied Biosystems, Foster City, CA, USA). The house-keeping gene GAPDH was used as an internal control for normalization. The Primer sequences used for quantitative real-time PCR are listed in Table 1.
Real time was performed after cDNA synthesis by RT-PCR technique, and then the results were checked by western blotting method.
Western blotting
Western blotting technique was used for evaluating the expression of proteins of interest in experimental groups and control group following sample extraction and SDS-PAGE. Spinal cord and brain tissue samples were lysed in RIPA buffer (150 mM NaCl, %1 NP-40, 50 mM Tris pH = 8.0, %1 SDS, %0.5 sodium deoxycholate, 1mM EDTA and protease inhibitor cocktail) and centrifuged at 12,000 rpm at 4 ºC for 20 min. SDS sample buffer was added to aliquots of tissue extracts. Samples were placed in a water bath at 100 ºC for 5 min. Proteins were separated by 12% SDS-PAGE. Proteins were transferred to the blot. Blots were incubated with specific primary polyclonal rabbit antibodies against iNOS (1:500 dilution) (Santa Cruz) and GAPDH (cell signaling), and primary polyclonal goat antibodies against CAT-2 (Santa Cruz) in TBS-T for 18h. Then, the blot was incubated with secondary anti-rabbit and anti-goat (1:500 dilution) (Santa Cruz) in TBS-T for 90 min separately. The iNOS and CAT-2 immune-reactive proteins were detected with advanced chemiluminescence (Enhanced Chemiluminescence, Amersham Biosciences) and exposed to a film. An image analysis system (Image j, version 1.46r) was used to measure the signal intensity of the blots.
Statistical analysis
All experiments were performed in triplicates, and the results were expressed as mean ± standard error of means (SEM). Statistical analyses were performed by “SPSS 18” using one-way ANOVA, followed by Tukey’s posttest. P < 0.05 was considered to be statistically significant.