Photophysical properties
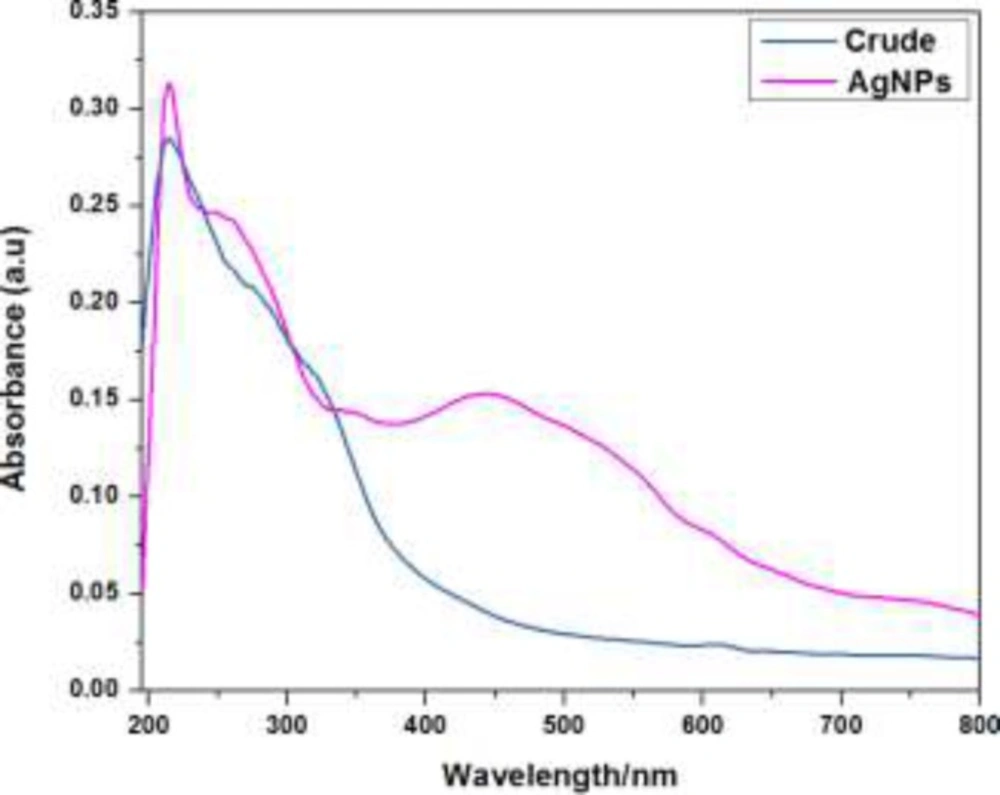
The formation and reduction of silver nanoparticles (AgNPs) by plant extract were monitored using UV-visible spectroscopic analysis. During the addition of aqueous AgNO
3 solution into plant extract, the instantaneous change in color of the solutions from light yellow to dark brown suggested the formation of silver nanoparticles. The plant extract (1 mg/mL) exhibited an absorption signal at 214 nm while there was no absorption signal beyond this in the entire range from 400-750 nm. Interestingly, an intense absorption signal at 443 nm with the considerable molar absorptivity was observed on incubation of plant extract with the aqueous solution of silver nitrate (1 × 10
-5 mol L
-1). This red shifted signal appearance as well as colorimetric change in the plant extract on silver nitrate addition provided the evidence for the formation of AgNPs triggered by the reduction with the plant extract (
Figure 1).
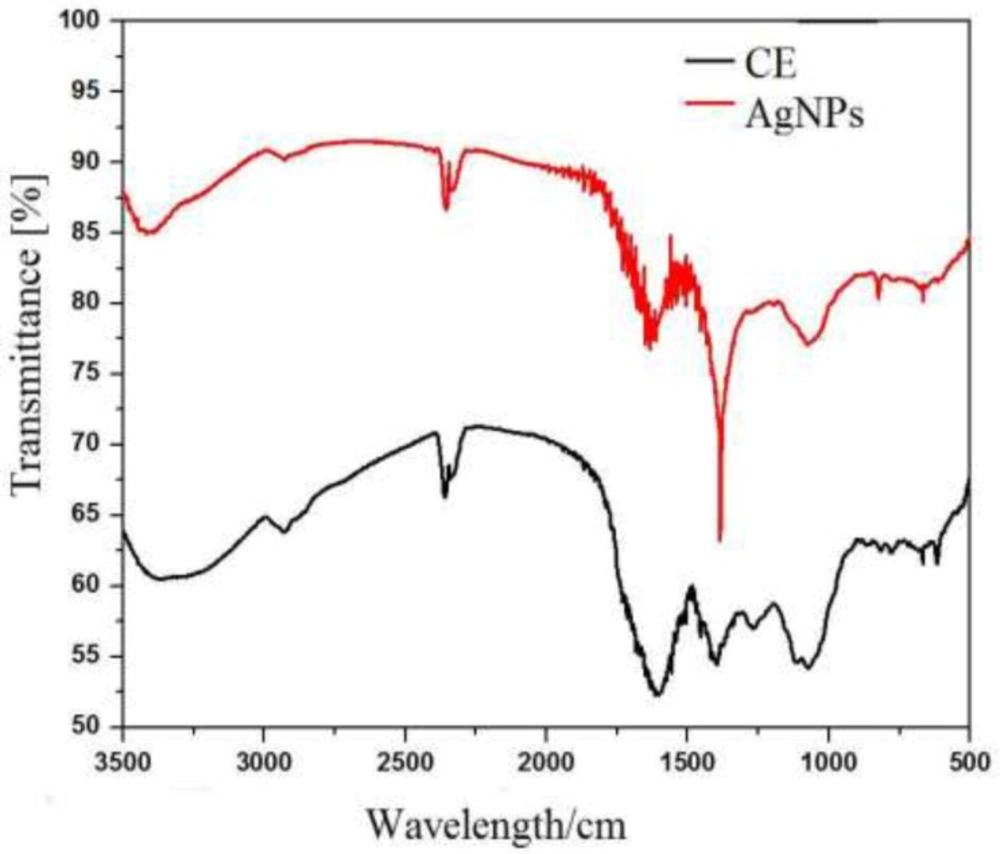
Observed spectral Bands (cm-1)
| Suggested groups | Biomolecules |
|---|
| CE | AgNPs | | |
|---|
| 3414 | 3361 | -OH,N-H Stretch | Alcohols, phenols, proteins |
| 2924 | 2924 | >CH2, -CH3 | Alkanes |
| 2848 | - | -OCH3 C-H stretch | Alkanes, aldehydes |
| 1604 | 1635 | N-H bend | Amines, protein, terpenoids |
| 1458 | - | >CH2,-CH3 C-H bend | Alkanes |
| 1392 | 1292 | -OH, N-O stretch | Phenolics, Nitrocompounds |
| 1261 | 1257 | -OH | Amides |
| 1122 | - | Alkyl,C-N stretch | Aliphatic amines |
| 1069 | 1072 | C-Br, | Carboxylic acids, esters, ethers Aromatic |
| 867 | 890 | -CH | Aromatic hydrocarbon |
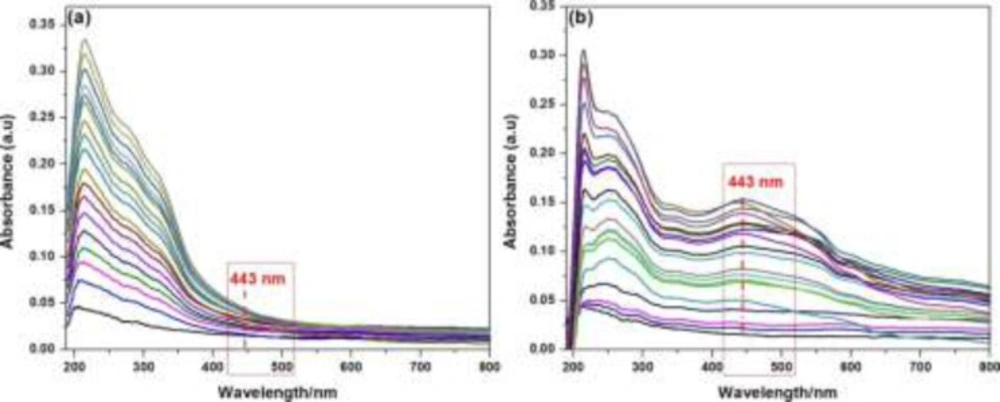
The UV-visible absorption spectra of crude plant extract and AgNPs
The UV–visible absorption spectra of; (a) crude plant extract with variable concentrations ranging from 1 × 10⁻⁵ gmol-1 to 1 × 10⁻³ gmol-1 at ambient temperature without addition of silver nitrate solution (1 × 10⁻⁵ mol L-1, aqueous solution); (b) after addition of 1 × 10⁻⁵ mol L-1 aqueous solution of silver nitrate
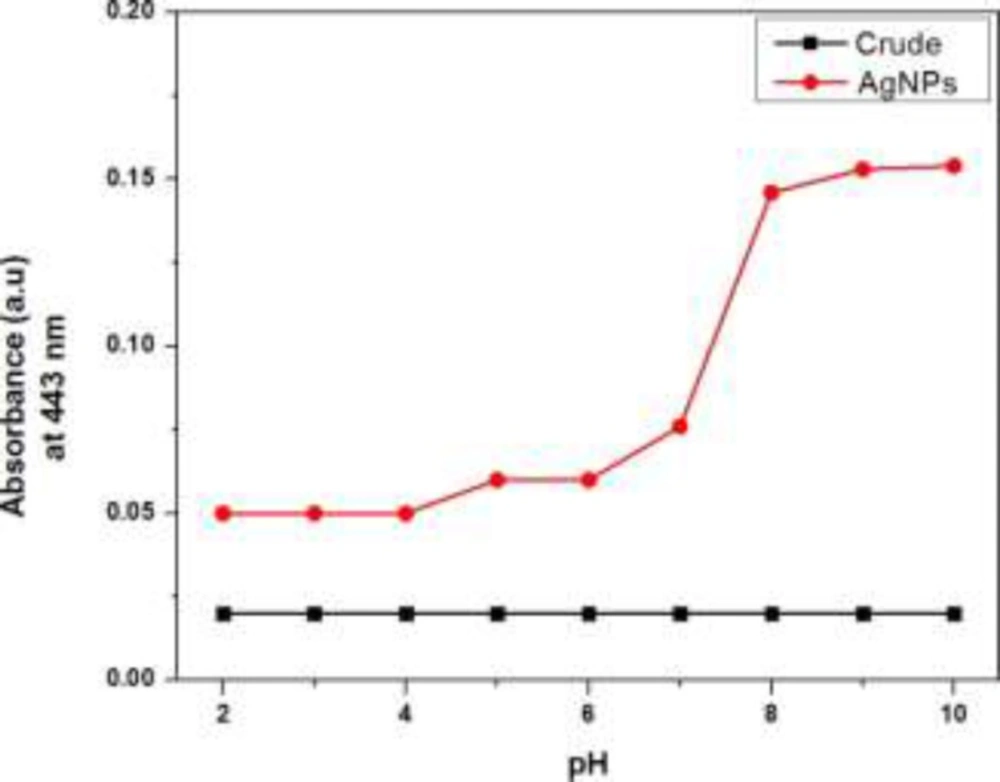
Effect of pH on the absorption signal intensity at 443 nm
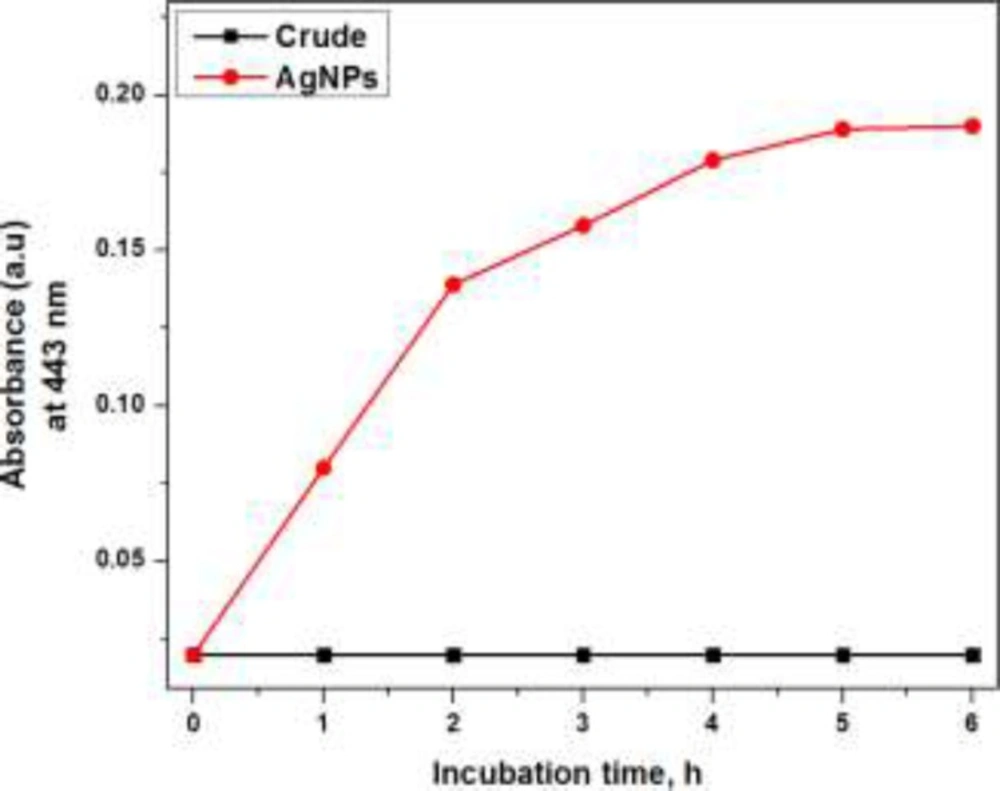
Effect of incubation time on the synthesis of AgNPs
FTIR Spectra of Crude and AgNPs at 500 cm-1 to 3500 cm-1
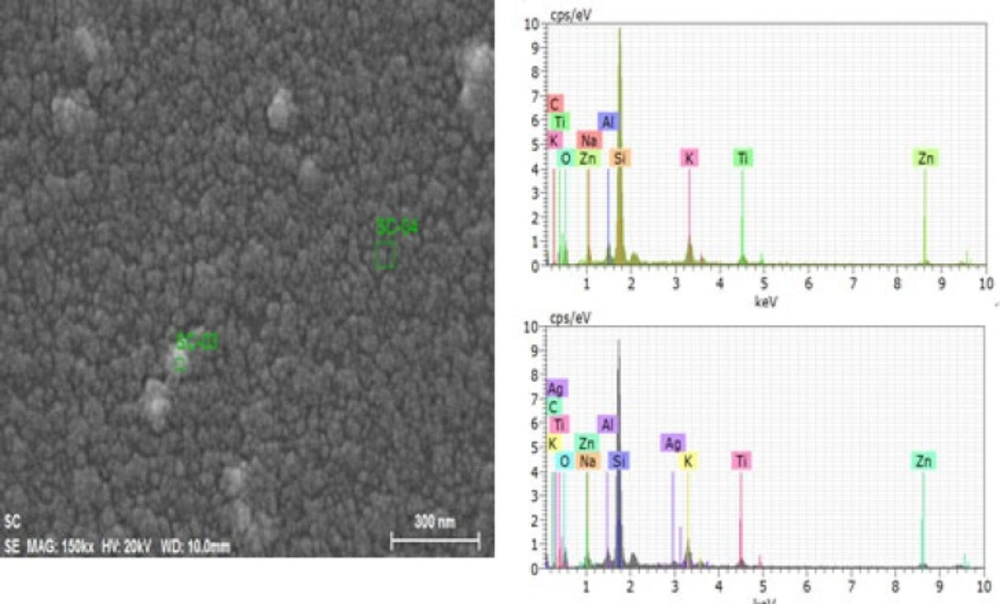
Energy-dispersive X-ray spectrometric (EDS) figures nanoparticles (spectrum: SC-03) Less aggregated area (spectrum: SC-04
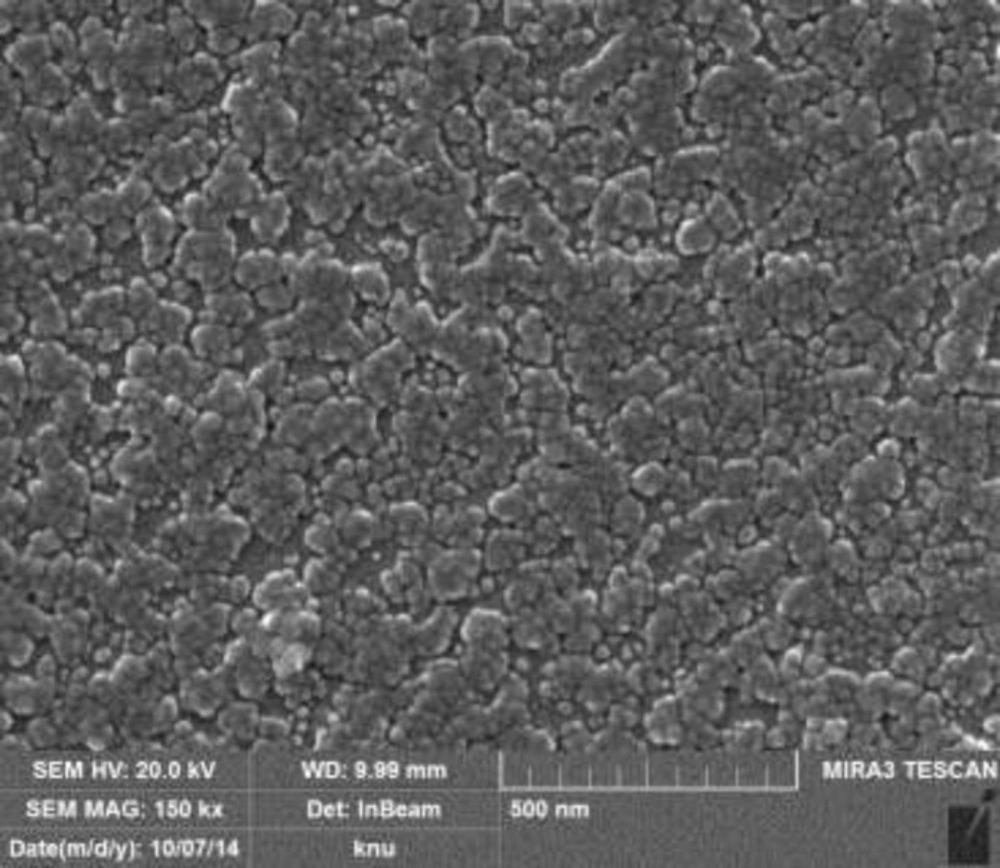
FESEM micrograph of AgNPs of Biden frondosa
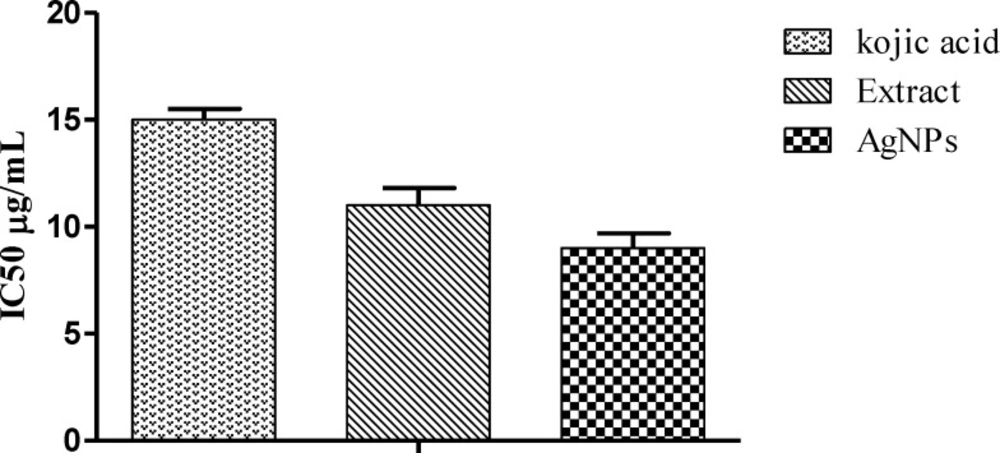
Tyrosinase Inhibition by aqueous crude extract and AgNPs while kojiac acid used as Reference
Effect of concentration
In order to monitor the formation and stability of silver nanoparticles, the UV-visible absorption spectra were recorded in the absence and presence of fixed concentration of AgNO
32- (1 × 10
-5 mol L
-1, aqueous solution) with variable concentration of crude plant extract ranging from 1 × 10
-5 g L
-1 to 1 × 10
-3 g L
-1 at ambient temperature. The color of the solutions changed from light yellow to pale yellow on increasing crude extract concentration in the absence of silver nitrate solution. But in the presence of silver nitrate, with the increase of extract concentration the crude extract color change from yellowish to brown and further to deep brown due to excitation of surface Plasmon vibration, indicating formation in the silver nanoparticles. Absorbance peak at 443 nm may be attributed to the surface plasmon resonance of AgNPs and earlier report suggest that noble metal particles as silver showed the characteristic peak around 430 nm (
13). Meanwhile, the extract concentrations showed the effect on the extract absorption signals intensity at 214 nm as shown in
Figure 2. There was ratiometric increment in the extract absorption signal intensity at 214 nm. However, the same reaction solution in the presence of AgNO
32- (1 × 10
-5mol L
-1, aqueous solution) exhibited a new absorption signal centered at 443 nm. This red shifted absorption signal and colorimetric change in the reaction solution provided evidence for the successful formation of silver nanoparticles by the bio-reduction of silver ion.
Effect of pH
To get better sagaciousness for the successful synthesis and better yield of AgNPs, the proper pH condition was optimized by recording the UV-visible absorption spectra in the buffer solution with the variable pH range from 2 to 10 as shown in
Figure 3. The intensity of signal at 443 nm characteristic for the silver nanoparticles was greatly influenced by pH values. The maximum intensity absorption signal at 443 nm was obtained in the entire alkaline conditions while in case of acidic pH, there was dramatic downfall in the signal intensity at 443 nm. AgNPs formation was preferred in the alkaline conditions as the constituents of extract in the alkaline pH conditions possess maximum number of negatively charged functional groups capable of efficient binding and reducing the silver ion (
14).
Effect of incubation time
The maximum absorbance at 443 nm in case of UV-visible absorption spectra appeared on increasing with the incubation time of crude plant extract with aqueous silver nitrate solution and became constant on 5 h of incubation as shown in
Figure 4. This finding suggests that the AgNPs formation started immediately on incubating the crude plant extract with silver nitrate solution and maximum synthesis of AgNPs occurred on 5 h of incubation at ambient temperature while afterward the reaction mixture become saturated as there was no considerable increment in the absorption signal intensity at 443 nm. Appropriate incubation time span is required for reduction of silver ion (
15,
16).
Fourier Transform Infrared (FTIR) Analysis
Fourier transforms infrared (FTIR) measurement of AgNP synthesized by using
b. frondosa extract. It was carried to detect the synthesis of nanoparticles. The IR band apparent at 3409 cm
-1 in extract is characteristic of the O–H and it was shifted to 3361 cm
-1 in AgNP. While other prominent shift in the wave numbers corresponding to amide (1604 to1635 cm
-1) suggested that involvement of amino (–NH
2) or COO
- (carboxylate) in crude extract making surface AgNPs stable. The medium IR band observed in extract at 1604 cm
-1 corresponds to amide arising due to carbonyl stretch was shifted to 1635 cm
-1 in AgNPs. Other miner shifts in the IR bands from 2369 to 2355 cm
-1 and 2332 to 2328 cm
-1 suggest the reaction of silver ions with extract (
Table1).
In addition the observed bands indicate the presence of terpenoids which are important in reduction of metal ions by the oxidizing aldehyde groups to carboxylic acids (
17). Bioactive compounds as phenolics and proteins different plants are reported to have role in formation of nanoparticles. Involvements of free amino acids of proteins in AgNPs are reported (
18). These observations suggest the role of biomolecule in the synthesis of nanoparticles. It is therefore the possibility of involvement of proteins and aromatic compounds in the stabilization and binding in AgNPs (
19).
Energy-dispersive X-ray spectrometric (EDS) analysis
Nanoparticles and crude sample were investigated for elemental analysis and presence of silver using energy dispersive X-ray spectrometric (EDS) method. Elements shown in EDS spectrum are the constituents of the extract used for the synthesis of nanoparticles. While distinct signals in EDS spectrum in silver region confirms the synthesis of the nanoparticles (
Figure 5)
Field emission scanning electron microscopy (FESEM)
The
Figure 6 showed the result of FESEM. Most of the Ag-NPs were spherical in shape and the sizes of AgNPs were ranges from 20-70 nm but most of them were 30 nm.
Mushroomtyrosinase activity
Mushrom tyrosinase enzyme was used in preliminary screening. Chelation of copper ions in mushroom tyrosinase determines the inhibitory potential of the sample. AgNPs showed enhanced inhibitory activity comparative to extract and standard. The IC
50 values were found to be 9, 11, and 2.37 μg/mL for AgNPs, plant extract and kojic acid, respectively (
Figure 7). The tyrosinase inhibitory activity might be attributed towards the bioactive compounds like phenolic and flavonoids involved in nanoparticle synthesis (
20).