Methods
Obtaining biological data and generation of molecular structures
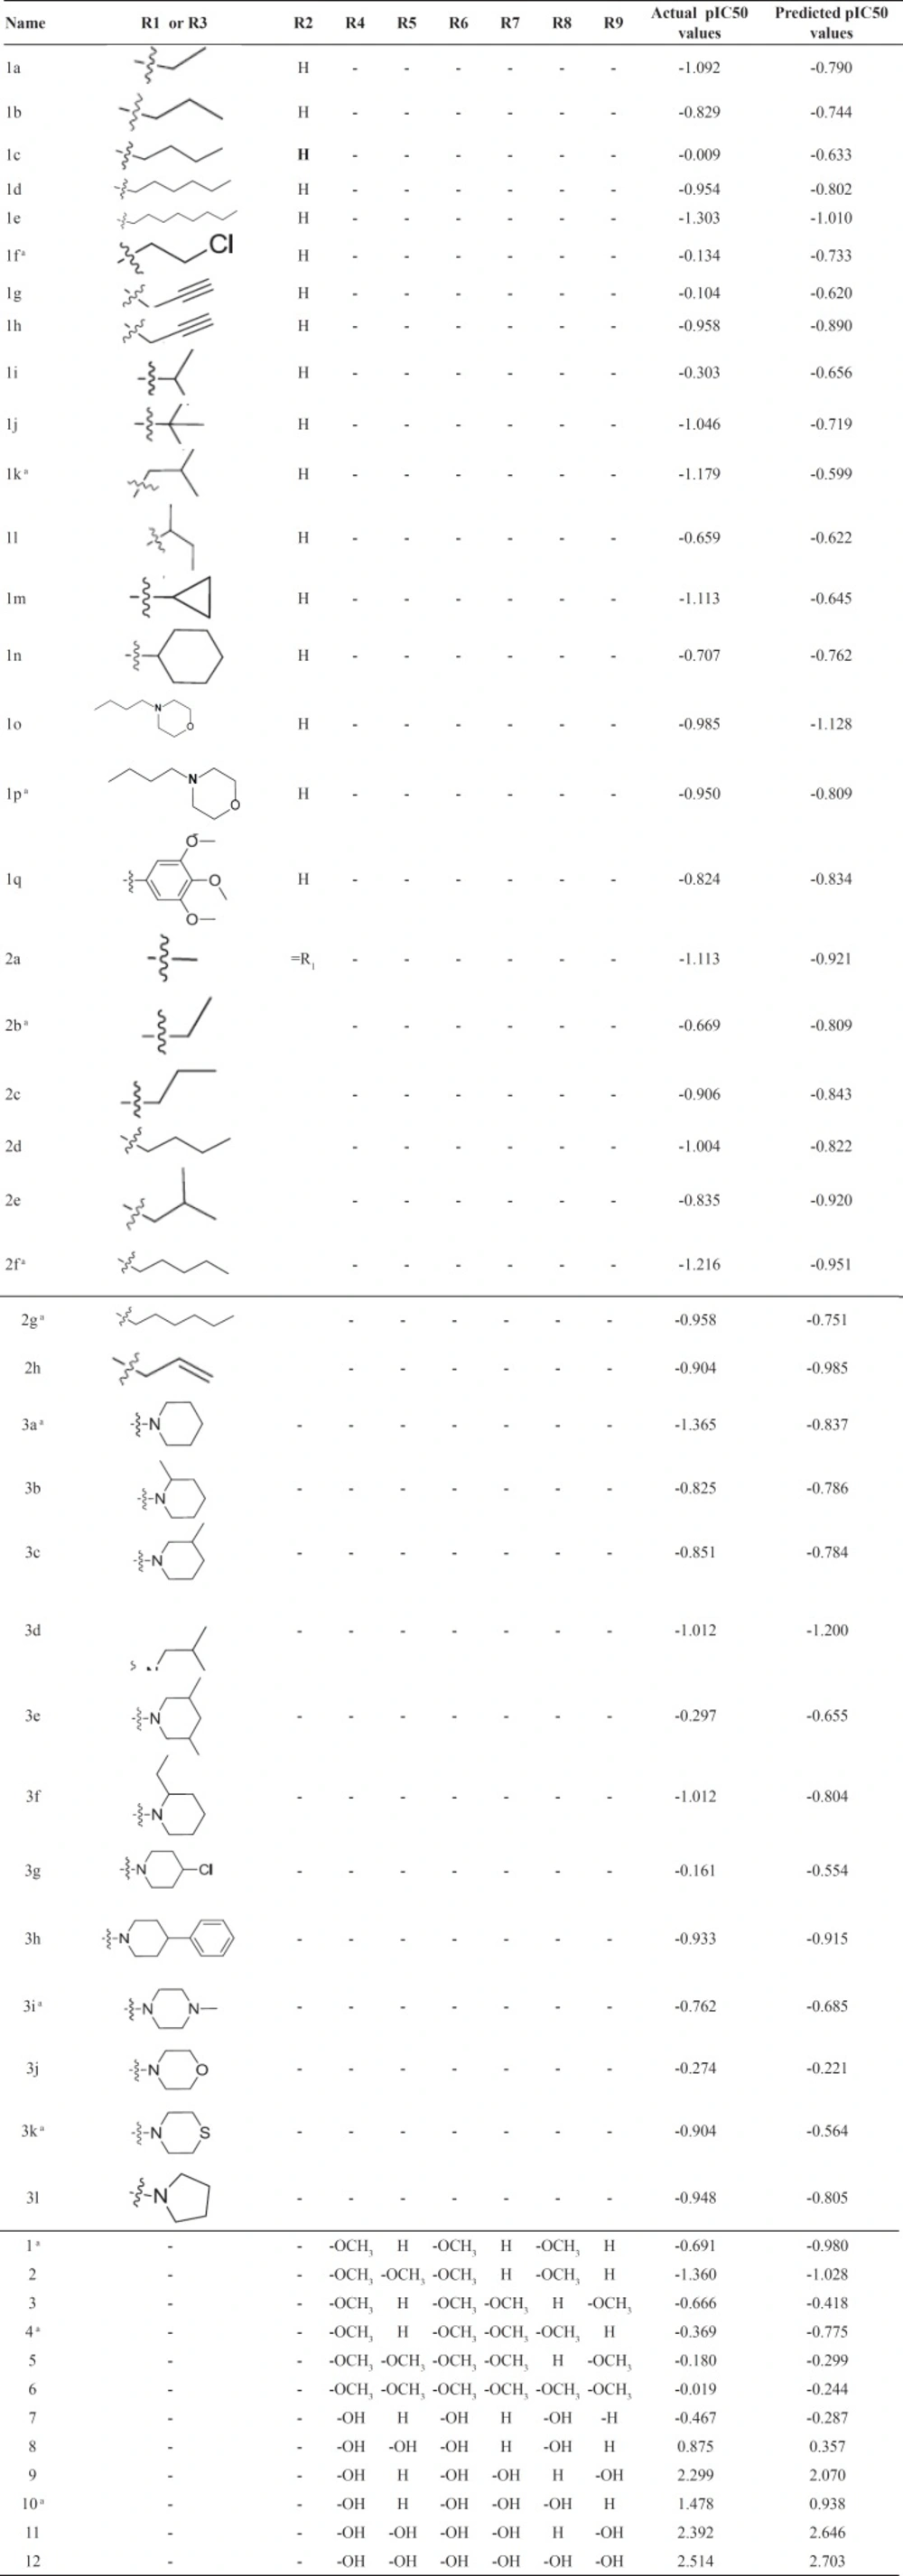
The structure of 49 resveratrol derivatives and their biological activities for inhibitors of COX-2 were taken from the literatures (
11,
12) (
Figure 1. and
Table 1.). Celecoxib was used as a control in both studies. We normalized the IC50 based on reported activity for celecoxib. The range of pIC50 (µM) values for COX-2 spans at least three orders of magnitude (min = -1.365, max = 2.514) in training set. The compounds were divided into two sets, Training (n = 37) and test (n = 12) sets according to the maintaining of structural diversity and the uniformly distribution of IC50. The pIC50 (-Log IC50) was employed as dependent variable instead of IC50.
The molecular structures were built using PyMOL (www.pymol.org, The PyMOL Molecular Graphics System, Version 1.2r3pre, Schrödinger, LLC.). The Gasteiger-Huckel partial charges for all compounds were assigned and then, 3D conformation of the compounds was minimized using the standard Tripos force field (Tripos International, St. Louis). The CoMSIA model was developed by SYBYL-X1.2 molecular modeling package (Tripos International, St. Louis).
Alignment
The alignment of 3D molecular structures is a crucial step to have a reliable CoMSIA model. An ideal alignment is a one that can result in superimposed similar functional groups of different ligands onto each other and mimic the active conformations of ligands during the interaction with the receptor. In the CoMSIA study on COX-2 inhibitors we have used rigid structure alignment using Distill module (in SYBYL-X1.2 molecular modeling environment). Compound 1c was selected as template for Distill alignment. This compound was chosen for its potent COX-2 inhibition property.
CoMSIA model generation and validation
CoMSIA (like CoMFA) similar to other 3D-QSAR methodologies tries to correlate 3D conformation of the ligands with their biological activity. The default CoMSIA setting was used in this study. For developing a CoMSIA model, firstly, a large grid box was positioned around the aligned compounds with default spacing value of 2 Å. Then, the default probe (a sp3 carbon atom with 1.0 Å van der Waals radius and +1 net charge) experienced different interaction energies for each individual molecule at every grid point. Five descriptors (strict, electrostatic, hydrophobic, H-bond donor and acceptor fields) were evaluated using the probe. These fields value form a large table that might have correlation with experimental and biological values (in this case, pIC50).
After generation of descriptors, Partial least square (PLS) regression was used to find the possible correlation between dependent variable (-pIC50) and independent variable (CoMSIA generated descriptors). At this step, q2 and standard error of prediction (SEP) obtained from leave-one-out cross validation roughly estimate the predictive ability of the model. This cross validated analysis followed by a non-cross validated analysis with the calculated optimum number of principle components. Conventional correlation coefficient r2, standard error of estimate (SEE) and F value indicated the validity of the model. Finally, a set of compounds (which were not present in model development process) with observed activity were used for external validation of the generated model. Predictive r2 (r2pred) value was calculated using:
r2pred = 1 – PRESS/SD
PRESS: sum of the squared deviation between predicted and actual pIC50 for the test set compounds
SD: sum of the squared deviation between the actual pIC50 values of the compounds from the test set and the mean pIC50 value of the training set compounds.
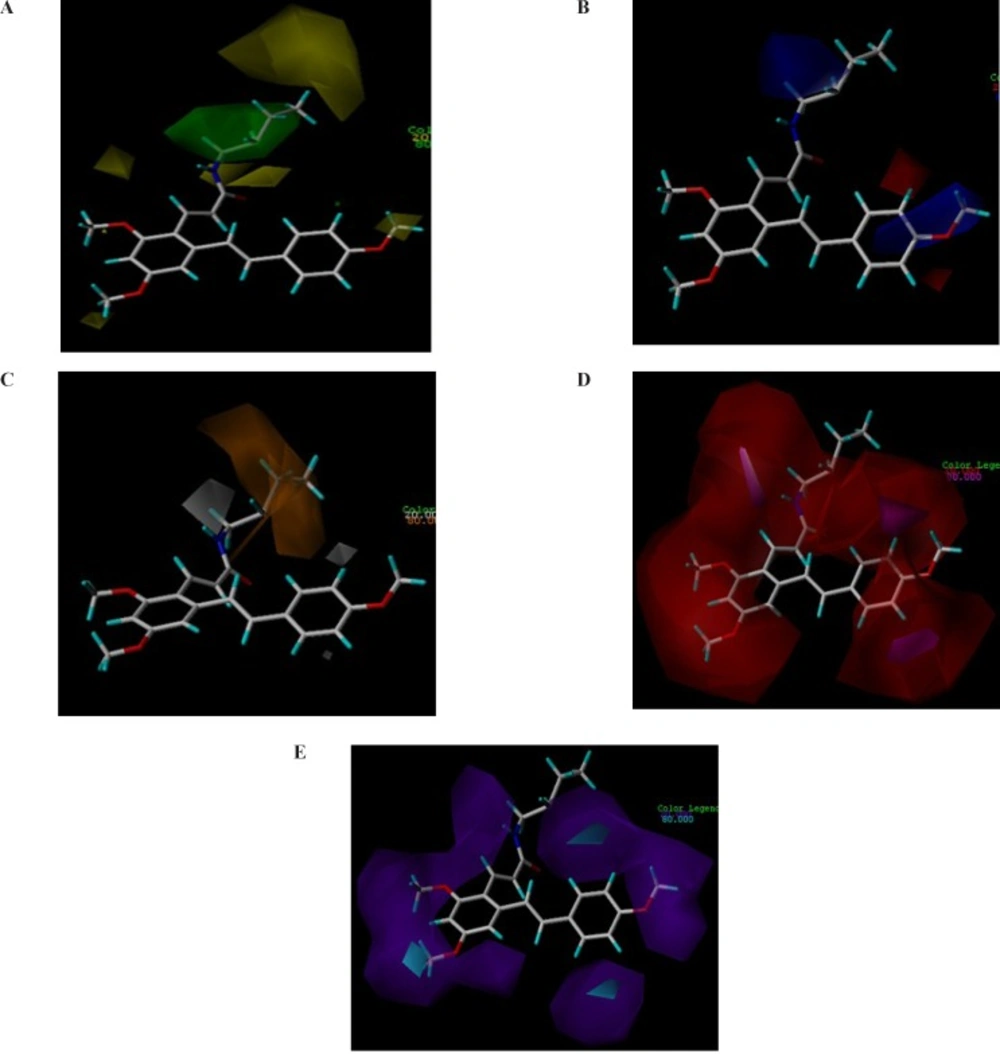
The output of the CoMSIA model can be viewed as a contour map that graphically shows the favorable and unfavorable positions for specific interaction fields around the aligned molecules using polyhedrons in different colors. We set the favored and disfavored levels to default values of 80% and 20%, respectively.
Prediction set (design of new compounds)
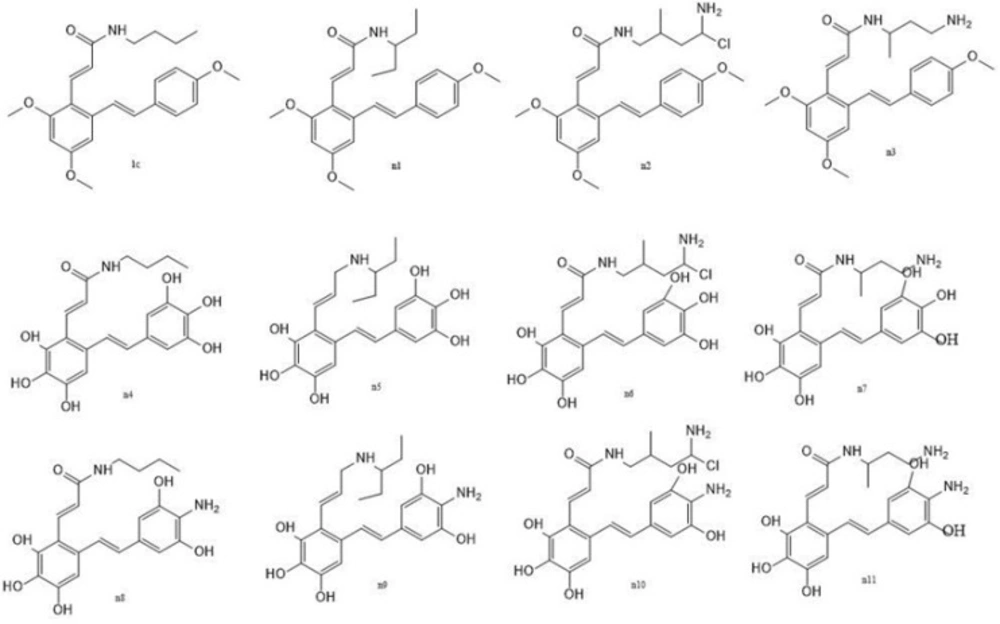
The prediction set contained 11 new not yet synthesized compounds having unknown observed values of activity against COX-2 (
Table 2.) They were designed based on the developed CoMSIA model.
Molecular Docking
The molecular docking process was carried out employing Glide (Glide, version 5.7, Schrödinger, LLC, New York, NY, 2011) using default parameters. The protein (1CX2) was prepared using Protein Preparation Wizard. Hydrogens were added, bond orders were assigned, overlapping
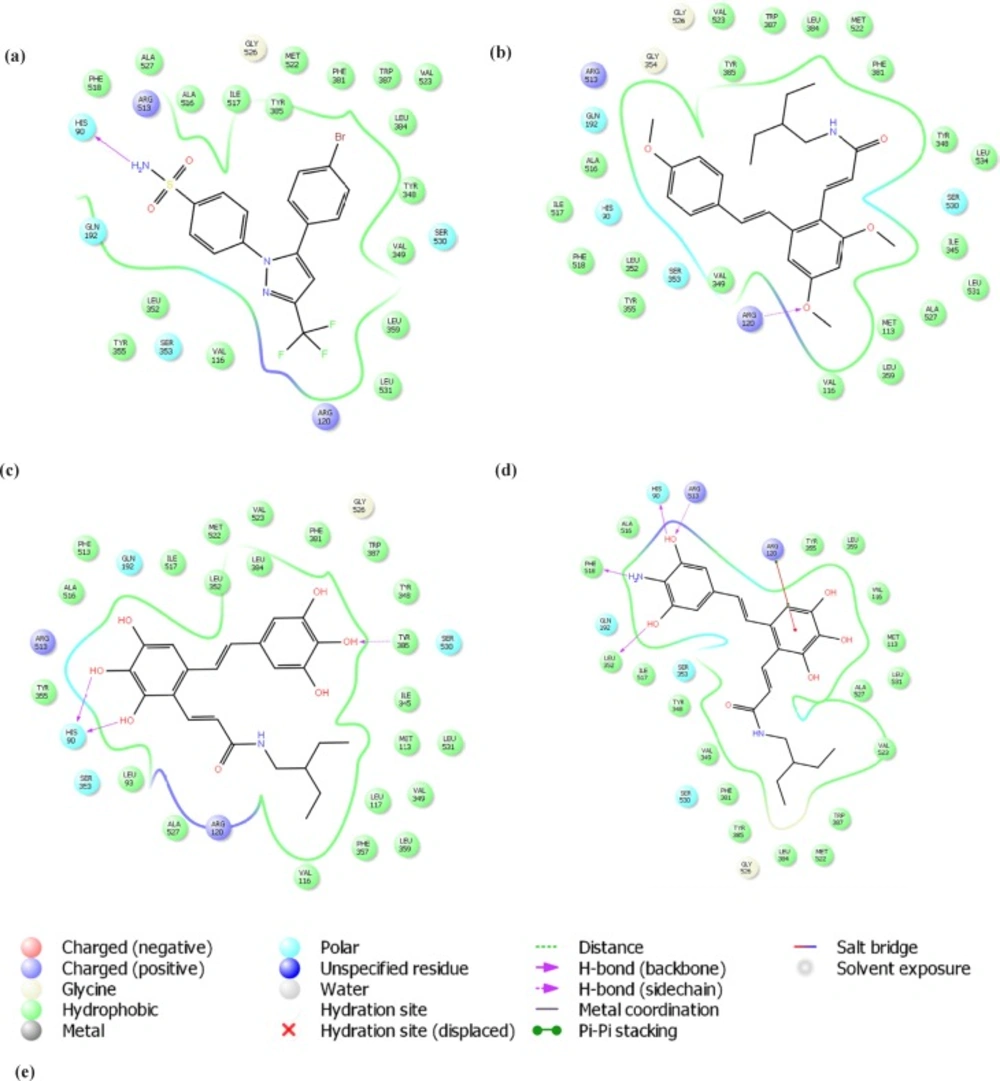
hydrogens were corrected, missing side chains were added and water molecules were removed. Finally the protein structure was minimized by OPLS2005 force field. The prepared protein structure containing inhibitor molecule was used for active site definition (within 13 Å from co-crystalized ligand). The 2D maps of ligands-receptor interactions were generated by ligand interaction diagram.
| Name | Predicted pIC50 values | Docking score |
|---|
| n1 | -0.643 | -4.38668 |
| n2 | -0.502 | -7.70702 |
| n3 | -0.565 | -5.16976 |
| n4 | 3.019 | -10.7421 |
| n5 | 3.008 | -11.5014 |
| n6 | 3.046 | -9.72465 |
| n7 | 2.98 | -11.3252 |
| n8 | 3.359 | -7.96709 |
| n9 | 3.255 | -10.2527 |
| n10 | 3.406 | -7.23175 |
| n11 | 3.368 | -8.44834 |
| 1c (observed= -0.009) | -0.633 | -7.49537 |
| 12 (observed= 2.514) | 2.703 | -9.3481 |
| Parameter | Value |
|---|
| Number of compounds included in training set | 37 |
| LOO q2 | 0.787 |
| SEP | 0.474 |
| Optimum number of principal components | 4 |
| r2 | 0.925 |
| SEE | 0.280 |
| F values | 99.140 |
| Steric field % | 0.055 |
| Electrostatic field % | 0.232 |
| Hydrophobic | 0.123 |
| Hydrogen Donor | 0.210 |
| Hydrogen acceptor | 0.379 |
| r2pred | 0.733 |
General structures for data set. (A) For structures 1a-1n and 2a-2h. (B) For structures 3a-3l. (C) For structures 1-12
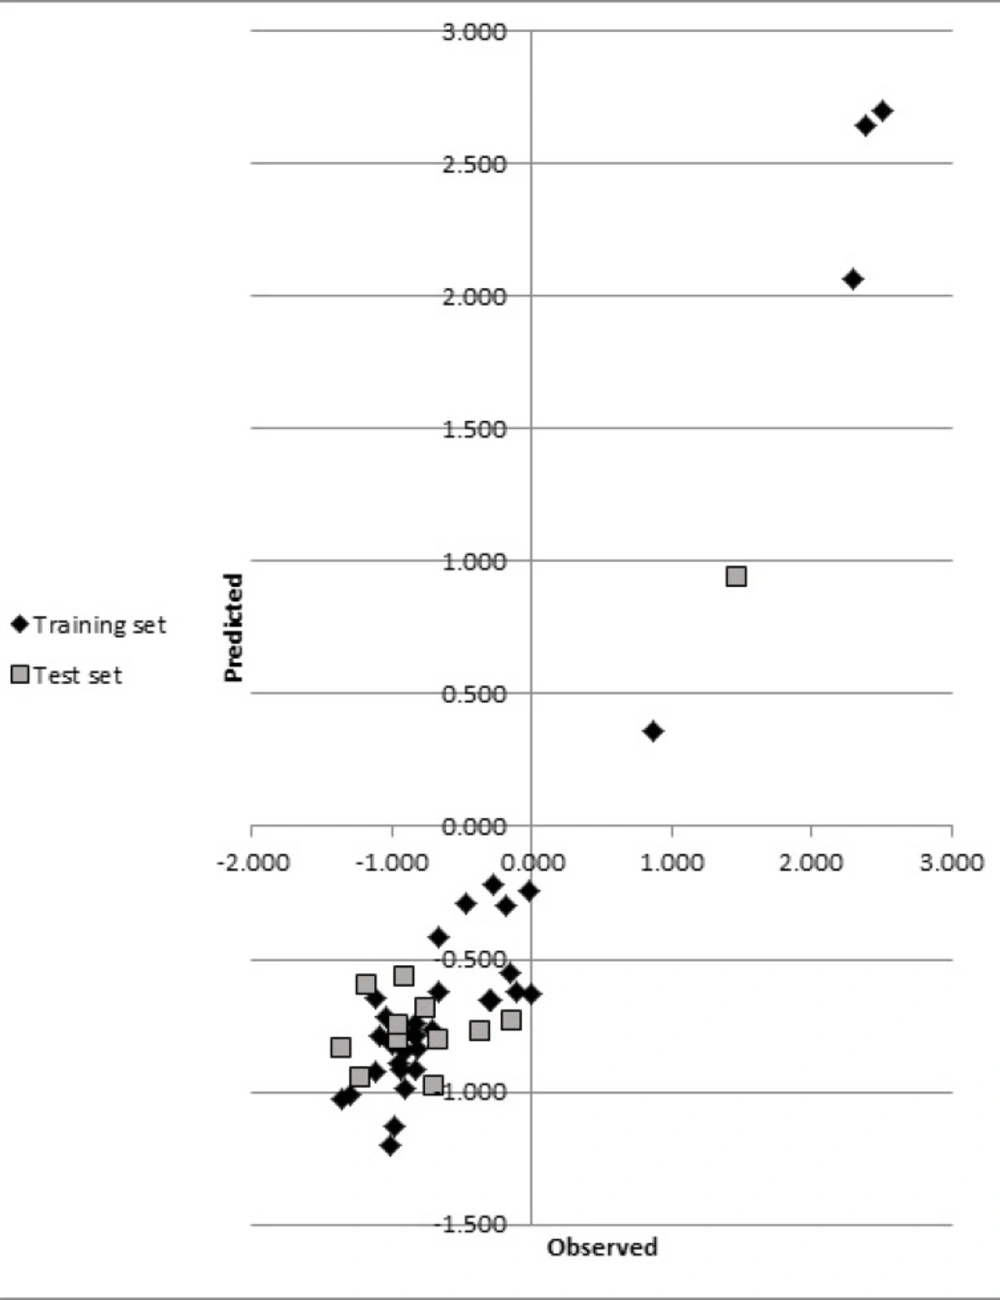
Plots of the predicted against observed activity for training and test sets
CoMSIA contour maps. Steric and electrostatic contours for COX-2 are presented. (A) Green and yellow contours show regions of steric tolerance and intolerance, respectively. (B) Red and blue contours show regions where negative and positive electrostatic potential, respectively, are favored. (C) Hydrophobic contours for COX-2 are also illustrated. The orange contours are favored while gray contours are disfavored for hydrophobic interactions. Hydrogen bond donor-acceptor contours for COX-2 are shown in (D) and (E). The regions enclosed by magenta polyhedron are favored for hydrogen acceptors while disfavored ones are enclosed by red polyhedron (D). The cyan contours are favored regions for hydrogen donors while the purple polyhedrons are disfavored for them (E
Chemical structures of new but not yet synthesized molecules
2D interaction diagram of (A) co-crystallized ligand of 1CX2 PDB complex and 3 docked designed compounds (B) n1 (C) n5 and (D) n9 with COX-2 receptor. Legend was presented (E