Introduction
Low molecular weight heparins (LMWHs) are fragments of commercial grade heparin produced by either chemical or enzymatic depolymerization (1). Both heparin and LWMH are high molecular weight hydrophilic polyanions (2) with poor oral bioavailability and are being administered parenterally. Poor oral absorption is a result of ionic repulsion from negatively charged mucus and epithelial tissue (3), destruction by gastrointestinal bacteria (4) and, to a lesser extent, by the acidic conditions of the stomach (5). LMWHs are potentially more advantageous than heparin due to their reduced hemorrhagic to antithrombotic ratio, reduced risk of bleeding, greater bioavailability at low doses, longer half-life and more predictable anticoagulant response at fixed doses (6, 7). They have proven their role as potent anticoagulants in the prevention and treatment of deep vein thrombosis (8) and pulmonary embolism (9) and are the preferred agents for primary prophylaxis in medical and surgical patients in hospital. Two large trails have demonstrated the safety and efficacy of outpatient treatment with LMWHs (10, 11).
Isoliquiritigenin (ISL) is a flavonoid with chalcone structure (2,4,4›-trihydroxychalcone). The studies have shown that ISL has wide pharmacological effects including anti-flammatory and analgesic activity (12), cytoprotective action (13), antitumor (14, 15), antioxidant (16, 17), anti-allergic (18) and anti-platelet coagulation effects (19), radical-scavenging (20) and antiviral activities (21). However, ISL is poorly water-soluble. The elimination half-life of ISL is short, which is about 4.4-4.8 h following oral administration and about 3.13-5.63 h after intravenous injection in rat (22-24). Intravenous administration of frequent and high doses may be needed, which possibly leads to severe and acute side effects. Therefore, extended drug delivery systems for ISL such as isoliquiritigenin-loaded nanostructured lipid carrier (22) and isoliquiritigenin-loaded solid lipid nanoparticle (to be published) were developed by our laboratory. It is interesting that acute toxicity of low molecular weight heparin-modified isoliquiritigenin-loaded solid lipid nanoparticle (LMWH-ISL-SLN) reduced.
The objective of the present work was studied the formulation and characteristers of low molecular weight heparin-modified isoliquiritigenin-loaded solid lipid nanoparticle (LMWH-ISL-SLN) systematically. Particle diameter, zeta potential, entrapment efficiency (EE), drug loading (DL), the in-vitro release models and stabilities of LMWH-ISL-SLN were investigated. The hemocompatibility, dose-related toxic effects and the in vitro cytotoxicity of LMWH-ISL-SLN were evaluated. The pharmacokinetics and biodistribution of LMWH-ISL-SLN in mice following single intravenious injection at doses of 50, 100 and 200 mg/Kg were also studied.
Experimental
Materials
Isoliquiritigenin (ISL, 99.0% purity) was purchased from Shanghai Bangcheng Chemical Co. (Shanghai, China). Low molecular weight heparin (LMWH, average MW 5000 kDa) was purchased from Hebei Changshan biochemical pharmaceutical Limited by Share Ltd. (Hebei, China). Stearic acid (SA), hexadecanol, and soya lecithin were purchased from Sinopharm Chemical Reagent Co., Ltd., China. Medium-chain triglyceride (MCT) and Lutrol® F68 (Poloxamer 188, BASF, Germany) was obtained from Shanghai Chemical Reagent Co., Ltd., China. The human heparin carcinoma cell line (Hep-G2) was purchased from Chinese Academy of Sciences Shanghai cell library (Shanghai, China). RPMI 1640, 3-(4,5-Dimethylthiazol-2-yl)-2,5-diphenyltetrazoli-um bromide (MTT), dimethyl sulfoxide (DMSO), ConA (concanavalin agglutinin) and penicillin-streptomycin sulphate were obtained from Sigma Chemical Co. (Shanghai, China). HPLC grade methanol and acetonitrile were obtained from Shandong Yuwang (Shandong, China). Sodium chloride (analytical grade) and mannitol were purchased from Beijing Beihua Fine Chemicals Co., Ltd. (Beijing, China). Other commercial reagents and solvents were of analytical grade.
Preparation of LMWH-ISL-SLN
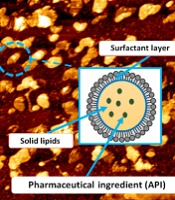
Low molecular weight heparin-modified isoliquiritigenin-loaded solid lipid nanoparticle (LMWH-ISL-SLN) was prepared by our previously reported method (25). The formulation of the LMWH-ISL-SLN was presented in Table 1. Schematic picture of LMWH-ISL-SLN structure was showed in Figure 1. The preparation process was optimized by a single factor experiment and the optimal process was detailed as follows. ISL, stearic acid, hexadecanol, medium-chain triglyceride and soya lecithin were dissolved into 5 mL of mixed organic solvent of ethanol and acetone (1:1, v/v) in a water bath at 60 °C. The resultant organic solution was quickly injected into 5 mL of aqueous solution of Poloxamer188 (1%, w/v) containing low molecular weight heparin at the same temperature (60 °C) under mechanical agitation (DC-40, Hangzhou Electrical Engineering Instruments, China) with 3000 rpm and the resulting mixture was kept at a certain temperature with the same agitation speed for 30 min to remove the organic solvent and formed emulsion. The resulted emulsion was cooled in aqueous phase under mechanical agitation at 1000 rpm at 0 °C for 1 h in order to form solid nanoparticle. The LMWH-ISL-SLN obtained was stored at 4 °C.The drug-free nanoparticle was prepared with exactly the same procedures except the drug.
The obtained SLNs were ultra-centrifuged for 1 h at 80,000 × g (4 °C) using a super-speed refrigerated centrifuge (MIKR022, HEETTICH, Germany). The bottom pellet after centrifugation was resuspended in double distilled water containing 8% (w/v) mannitol. Mannitol was used as cryoprotectant in the freeze-drying process. The SLNs suspensions were fast frozen in an aqueous mannitol solution under -80 °C in a ULT 2586-5-A14 freezer (Revco scientific, Asheville NC, USA) for 12 h and then the samples were moved to the freeze-drier (LGJ0.5-II, Beijing, China) and lyophilized at -50 °C for 48 h. The SLNs dried powders were collected and stored at 4 °C for further experiments.
Size and zeta potential analysis of LMWH-ISL-SLN
Size and zeta potential analysis of LMWH-ISL-SLN is similar as described previously (22). Particle size analysis was performed by dynamic light scattering (DLS) with a Malvern Zetasizer 3000 HSA (Malvern Instruments, UK).
Transmission electron microscopy (TEM) examination
The morphological observation of LMWH-ISL-SLN nanoparticle was performed by transmission electron microscopy (TEM) (JEM 1200 EX, Japan), using a negative-staining method. A drop of dispersion was spread on a 200-mesh copper grid coating and the excess droplets were removed with filter paper. After 5 min, a drop of 4% (w/v) phosphotungstic acid solution was then dropped onto the grids. After being negatively stained and air-dried under room temperature, the samples were completed for the TEM investigation.
Drug encapsulation efficiency (EE) and drug loading (DL) percentage
The obtained LMWH-ISL-SLN was ultra-centrifuged for 1 h at 80,000 × g (4 °C) using a super-speed refrigerated centrifuge (MIKR022, HEETTICH, Germany). The drug content in the supernatant after centrifugation was measured by HPLC method reported previously (23, 24). Briefly, analysis was performed by HPLC using an Agilent 1200 HPLC (Böblingen, Germany) system consisting of G1322A Vacuum Degasser, G1311A Quat Gradient Pump, G1316A Thermostatted Column Compartment, G1329A Autosampler, G1315B Diode Array Detector and LC 3D instrument Chem Station for liquid chromatography systems. Chromatographic separation was achieved on a YMC-packed ODS-A C18 column, 150 × 4.6 mm, 5µM (YMC Co. Ltd., Kyoto, Japan) preceded by a guard column (C18, 10 mm × 4.6 mm). The mobile phase was composed of acetonitrile, 0.05 mol/L potassium dihydrogen phosphate and triethylamine in a volume ratio of 38:62:0.5. The pH of the mobile phase was adjusted to 2 with 85% phosphoric acid. Prior to use, the mobile phase was filtered through a 0.45 μM hydrophilic membrane filter. Detection was performed at a wavelength of 242 nm while reference wavelength was set at 360 nm during 0 to 5 min, and from 5 to 9 min detection and reference wavelengths were set at 360 nm and 700 nm, respectively. The mobile phase was delivered at a flow rate of 1.0 mL/min. The oven temperature was 25 °C and the injection volume was 20 μL. The drug encapsulation efficiency (EE) and drug loading (DL) percentage of LMWH-ISL-SLN were then calculated from formulas (1) and (2):
Where WTotal, Wfree and WLipids are the weight of drug added, the drug weight in supernatant and weight of lipid added, respectively.
Storage stabilities of LMWH-ISL-SLN
The storage stabilities of LMWH-ISL-SLN were determined as follows. Lyophilized LMWH-ISL-SLN was stored at 4 °C for 3 months. Before the measurement of particle size, zeta potential, EE and DL, the nanoparticle powders were redispersed in distilled water by vortexing (XW-80A, Instruments factory of Shanghai Medical University) for 3 min. The particle sizes, zeta potential values, EE and DL of the nanoparticle were determined by the method described above.
The in-vitro release study of LMWH-ISL-SLN
The release experiments of LMWH-ISL-SLN were performed by previously reported dialysis technique (25). Phosphate butter solution (PBS, pH 7.4), 200 mL, was poured into a well-closed glass vessel as the dissolution medium for the in-vitro release test. LMWH-ISL-SLN (2 mL) was transferred to a dialysis bag (molecular weight cut-off 5000-10,000) and then the dialysis bag was placed in the glass vessel. The vessels were placed in a shaker and shaken horizontally (Incubator Shaker ZHWY-200B, Shanghai Zhicheng Analysis Instrument Company, China) at 37 °C and 100 strokes per min. The sample (1 mL) was withdrawn at predetermined time intervals and filtered through a 0.45 μM hydrophilic filter membrane. At the same time, the same volume of fresh buffer was added. The drug content was measured by the HPLC method described above. A profile showing the cumulative amount of drug release as a function of time was plotted.
To describe the drug releasing mechanism from nanoparticle, release profiles were analyzed applying four different mathematical models, which were exponential kinetic model, logarithmic kinetic model, Higuchi equation and Weibull’s distribution law. The exponential kinetic model is 100 - Q=A*e-kt, where Q is the amount of drug dissolved in time t, A is a constant while t is zero, and k is the release rate constant. Logarithmic kinetic model is Q = k*ln(t) + A, where Q is the cumulative percentage of drug released at time t, A is a constant while t is 1 h, and k is the release rate constant. Higuchi equation is Q = kH* t1/2, which describes the release of drug as the square root of time based on the Fickian diffusion, and kH is Higuchi coefficient. Weibull’s distribution equation is ln [ ln [1/(1 - Q)]] = k*ln (t) + A, where Q is the amount of drug dissolved in time t, A is a constant while t is 1 h, and k is the Weibull’s distribution rate constant. Criteria for selecting the most appropriate model were based on obtained R2 values.
In-vitro cytotoxicity assay
The cytotoxic effects of LMWH-ISL-SLN and ISL solution (ISL-Sol) on Hep-G2 cell lines were determined using MTT assay. 100 μL of tumor cells (5*103/mL) were seeded in 96-well plates and incubated at 37 °C for 24 h in a humidified environment with 5% CO2. Cells were then treated with LMWH-ISL-SLN and ISL-Sol (at concentrations of 2, 4, 6, 8, and 10 μg/mL) for 24, 48, and 72 h, respectively. Then, 50 μL of 3-(4,5-dimethylthiazol-2-yl)-2, 5-diphenyl-tetrazolium bromide (MTT, Sigma, Shanghai, China) solution (2.5 mg/mL in PBS) was added to each well and incubated at 37 °C for 4 h. Microplates were then centrifuged at 275 × g for 5 min and the culture medium carefully aspirated and replaced with 100 μL of 100% dimethylsulfoxide (DMSO). Complete and homogeneous solubilisation of formazan crystals was achieved after 20 min of incubation and a slight plate shaking. The absorbance was measured on a 400 ATC microculture plate reader (SLT Lab instruments, Austria) at 490 nm. IC50s were calculated by the analysis of single dose response curves, each final value being the mean of 8-9 independent experiments (26).
Safety tests of LMWH-ISL-SLN
Hemolytic test in-vitro
Erythrocytes were isolated from fresh whole rabbit blood. 0.1, 0.2, 0.3, 0.4 and 0.5 mL of LMWH-ISL-SLN (15 mg/mL) were added to five tubes along with 2.5 mL 2% rabbit erythrocyte suspension, respectively. Then, normal saline was added to every tube to obtain a final volume of 5 mL. Positive and negative controls were prepared by the addition of water (2.5 mL) and normal saline (2.5 mL) to 2.5 mL samples of 2% erythrocyte dispersion. Following incubation at 37 °C for 4 h, the samples were centrifuged at 2000 rpm for 10 min and the color of the supernatant was compared with controls. If the supernatant solution was absolute achromatic, it implied that there was no hemolysis. In contrast, hemolysis occurred when the supernatant solution was red.
Dose-related toxic effects
Kunming mice (equal numbers of males and females, 18 - 22 g) were housed under normal conditions with free access to food and water. Six male and six female mice per dosing group (n = 12) were used. LMWH-ISL-SLN and ISL-Sol were injected via the tail vein at doses of 190-610 mg/Kg. Dose-related toxic effects were observed immediately, 4 h post-injection and then daily for 2 weeks in all groups, and the number of mice surviving was recorded. The median lethal dose (LD50) was calculated using the Bliss method.
In-vivo studies of LMWH-ISL-SLN
Animals
Kunming mice (18 - 22 g) used for this study were supplied by the Laboratory Animal Center of Lanzhou University. Animals were fasted overnight prior to the experiment. The procedures used in this experiment were conducted according to the approved protocols of the Institutional Animal Care and Use Committee of the Lanzhou University.
Pharmacokinetic and tissue distribution study
Mice were randomly assigned to six different groups (n = 72 in each group). LMWH-ISL-SLN and ISL-Sol were injected in mice via a tail vein injection at a dose of 50, 100 and 200 mg/Kg to different groups, respectively. At predetermined time intervals (0.08, 0.17, 0.25, 0.33, 0.5, 0.75, 1, 1.5, 2, 2.5, 3 and 6 h), six mice at each time point from each group were given anesthesia and the blood samples were collected by removing the eyeball, placed into heparinized test tubes and centrifuged (4500 g, 10 min) to get corresponding plasma samples. Thereafter, tissue samples (heart, liver, spleen, kidneys, lung and brain) were immediately collected after cervical dislocation washed with physiological saline and dried with filter paper. The plasma and tissue samples were frozen at -45 °C until analysis.
Plasma and tissue sample analysis
A previously validated HPLC method (23, 24) was used to analyze the drug in the samples. Briefly, A 100 μL of each plasma sample was transferred into a 1.5 mL polyethylene centrifuge tube. 500 μL of acetonitrile containing 20 μL of acetanilide (internal standard, IS) solution (100 μg/mL, dissolved in methanol) were added to each plasma sample and vortex-mixed (SW-80A vortex shaker, Shanghai Medical University Instrument Plant, Shanghai, China) for 3 min. Thereafter, 300 mg of sodium chloride were added to the mixture and vortex-mixed for 1 min. After placing for 1 min the mixture was centrifuged for 5 min at 12,000 × g to separate precipitated proteins. The supernatant (acetonitrile layer) was transferred into a new 1.5 mL Eppendorf tube and evaporated to dryness at 40 °C under a gentle stream of nitrogen. The residue was then reconstituted with 100 μL of a mixed solution of methanol and water in the ratio of 50: 50 (v/v), and ultrasonitated for 1 min and vortex-mixed for 1 min again, then centrifuged at 12,000 × g for 5 min, and an aliquot (50 μL) of the clear supernatant was injected into the LC system.
Tissue samples were weighed accurately and homogenized with a two fold aliquot of saline in a tissue homogenizer (FSH-2A, Jintan Medical Instrument Factory, China) in an ice bath. Tissue homogenates were processed similarly as plasma samples and analyzed by HPLC.
Data analysis
Non-compartmental analysis of the pharmacokinetic data was performed by the statistical moment method using the DAS 2.1 pharmacokinetic program (Chinese Pharmacological Society, China). The area under the total concentration–time curve from time zero to infinity was calculated by: AUC0→∞ = AUC0→t + Ct / K, where Ct is the last observed ISL concentration, and K is the apparent elimination rate constant obtained from the terminal slope of the individual concentration-time curves after logarithmic transformation of the concentration values and application of linear regression (27, 28). The mean residence time (MRT) was calculated as follows: MRT = AUMC/AUC (AUMC is the area under the first moment-time curve). The peak concentrations (Cmax) were derived directly from the original measured values.
Statistical analysis
Results were presented as mean ± SD. Statistical comparisons were made by t-test of variance (ANOVA) analysis. The accepted level of significance was p < 0.05.
Table 1
Formulation of LMWH-ISL-SLN
| Formulation | The amount (mg) |
|---|---|
| ISL | 75 |
| Stearic acid | 5 |
| Hexadecanol | 50 |
| Medium-chain triglyceride | 2 |
| Soya lecithin | 15 |
| Low molecular weight heparin | 1.5 |
| Poloxamer188 | 1% (W/V) |
Table 2
Models used in the in-vitro release
| Models | Mechanisms | LMWH-ISL-SLN | |
|---|---|---|---|
| Equations | R2 | ||
| 100 – Q = A*e-kt | Exponential kinetics | 100 – Q = 82.881*e-0.061 t | 0.9454 |
| Q = k*ln (t) + A | Logarithmic kinetics | Q = 16.916*ln(t) + 21.889 | 0.9139 |
| Q = kH* t1/2 | Fickian Diffusion | Q = 16.527*t1/2 | 0.9126 |
| ln[ln[1/(1-Q)]] = k*ln(t) + A | Weibull’s distribution law | lnln[1/1-(1-Q)]= 0.9451*lnt - 2.1345 | 0.9747 |
Table 3
IC50s of LMWH-ISL-SLN and ISL solution on the growth of Hep-G2 cell lines after 24, 48 and 72 h exposure.
| Formulations | LMWH-ISL-SLN | ISL solution | ||||
|---|---|---|---|---|---|---|
| Time (h) | 24 | 48 | 72 | 24 | 48 | 72 |
| IC50 (μg/mL) | 7.45 ± 0.43* | 6.03 ± 0.36* | 4.72 ± 0.29* | 8.78 ± 0.38 | 7.40 ± 0.32 | 5.81 ± 0.28 |
Statistical difference from ISL solution group (p < 0.05).
Table 4
Pharmacokinetic parameters of LMWH-ISL-SLN and ISL-Sol after intravenous administration in mice (mean value ± SD, n = 6).
| Formulation | Dose (mg/kg) | Cmax (μg/mL) | AUC(0-∞) | t1/2z | MRT (h) | Clz (L/h/kg) | Vz |
|---|---|---|---|---|---|---|---|
| LMWH-ISL-SLN | 50 | 772.56 ± 87.29 | 838.49 ± 62.37* | 6.19 ± 0.83** | 9.92 ± 0.31** | 0.28 ± 0.21** | 2.53 ± 0.24** |
| 100 | 1493.10 ± 199.46 | 1745.07 ± 138.28* | 6.88 ± 0.77** | 9.69 ± 0.57** | 0.26 ± 0.19** | 2.57 ± 0.33** | |
| 200 | 2336.24 ± 258.59 | 2555.54 ± 296.77* | 6.10 ± 0.69** | 10.85 ± 0.48** | 0.31 ± 0.32** | 2.69 ± 0.29** | |
| ISL-Sol | 50 | 1040.88 ± 98.37 | 636.68 ± 47.95 | 2.18 ± 0.17 | 1.43 ± 0.13 | 0.08 ± 0.01 | 0.25 ± 0.02 |
| 100 | 1705.84 ± 115.63 | 1041.96 ± 89.61 | 2.04 ± 0.16 | 1.36 ± 0.12 | 0.10 ± 0.02 | 0.28 ± 0.02 | |
| 200 | 2640.40 ± 178.39 | 1616.23 ± 100.55 | 1.85 ± 0.13 | 1.30 ± 0.11 | 0.12 ± 0.01 | 0.33 ± 0.03 |
Statistical difference from ISL-Sol group (p < 0.05).
Statistical difference from ISL-Sol group (p < 0.01).
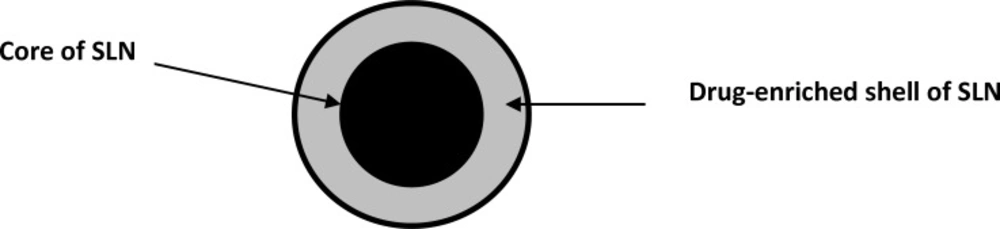
Figure 1
Schematic picture of LMWH-ISL-SLN structure
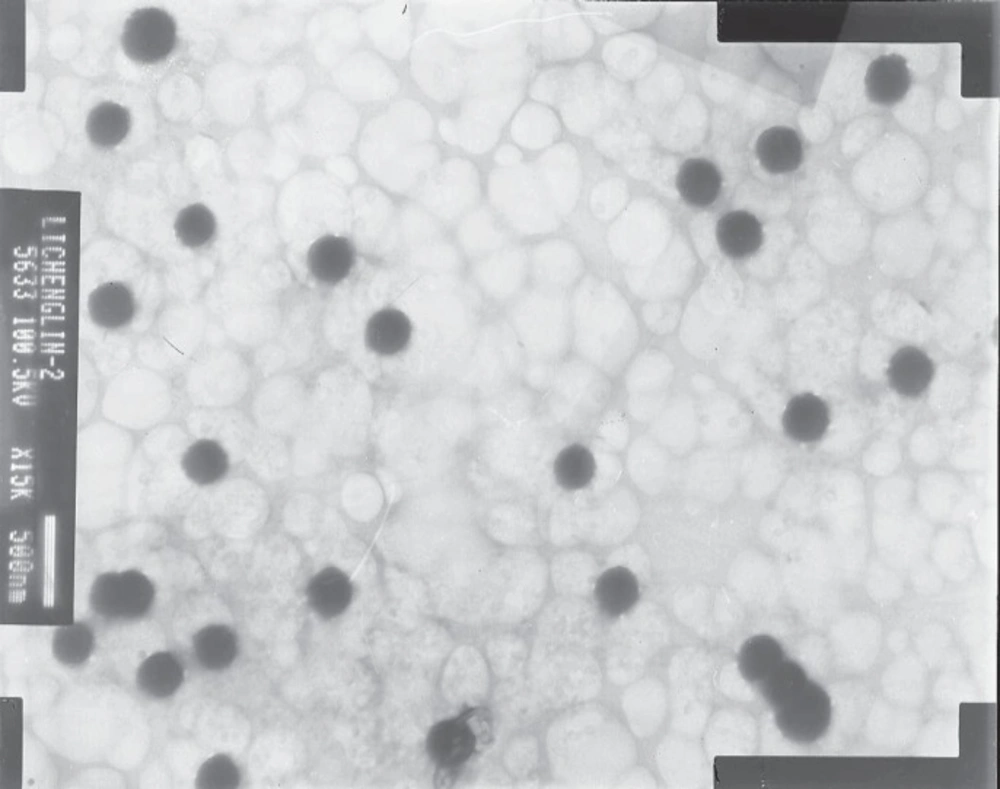
Figure 2
TEM photo of LMWH-ISL-SLN
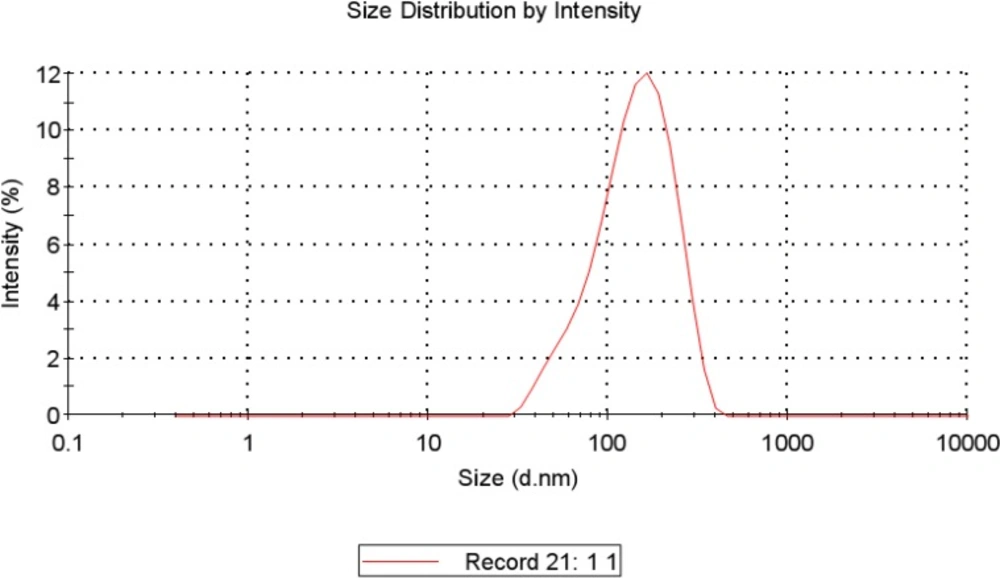
Figure 3
Particle size distribution of LMWH-ISL-SLN
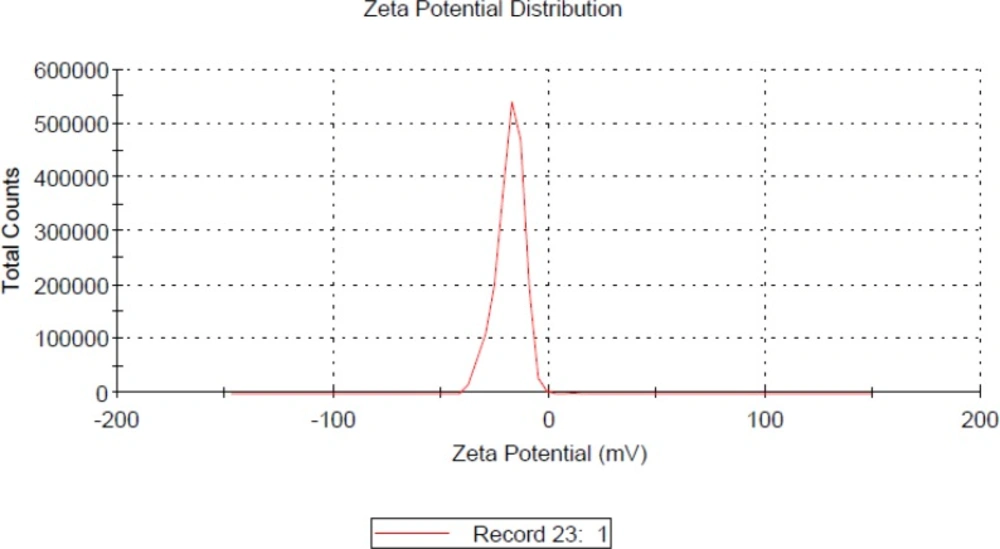
Figure 4
Zeta potential value of LMWH-ISL-SLN
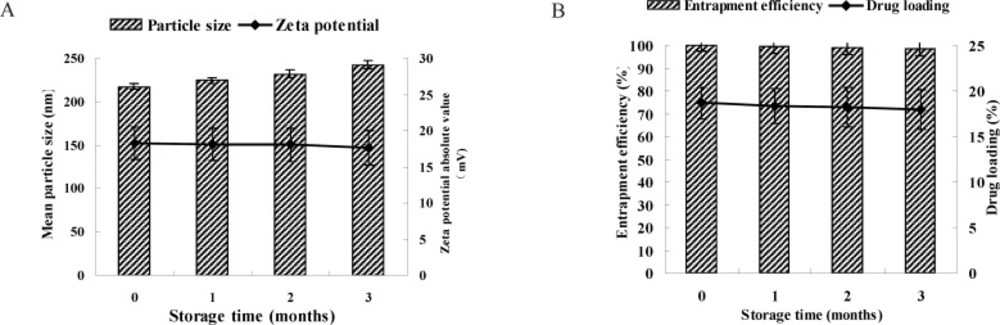
Figure 5
The particle size, zeta potential (A) and drug encapsulation efficiency (EE), drug loading (DL) (B) of LMWH-ISL-SLN lyophilized powder against storage time at 4 °C
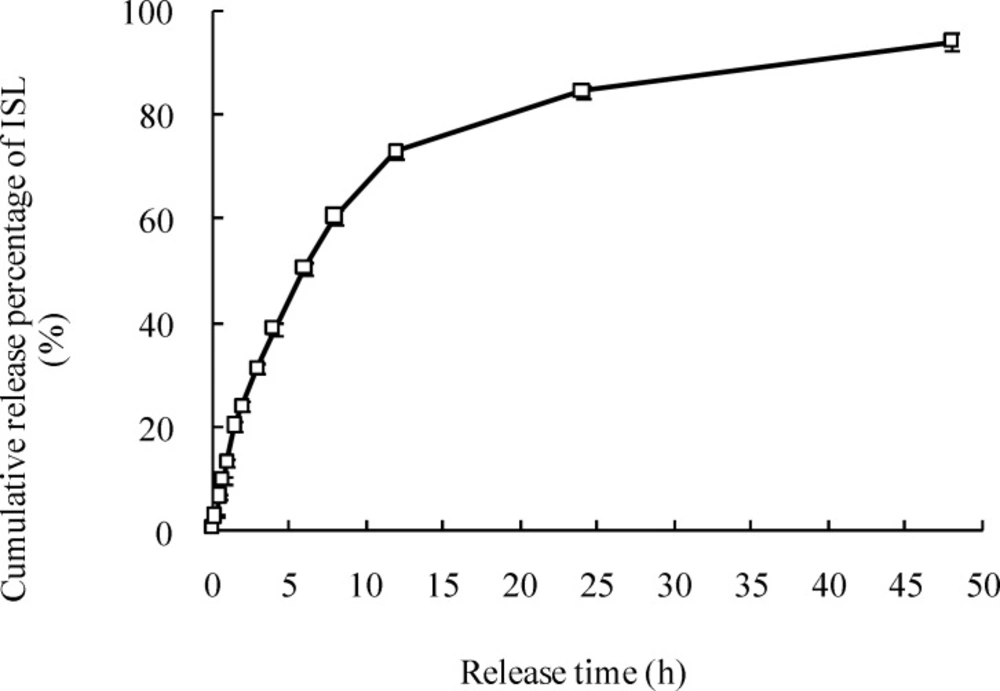
Figure 6
The in vitro release curve of ISL from LMWH-ISL-SLN in PBS at 37ºC
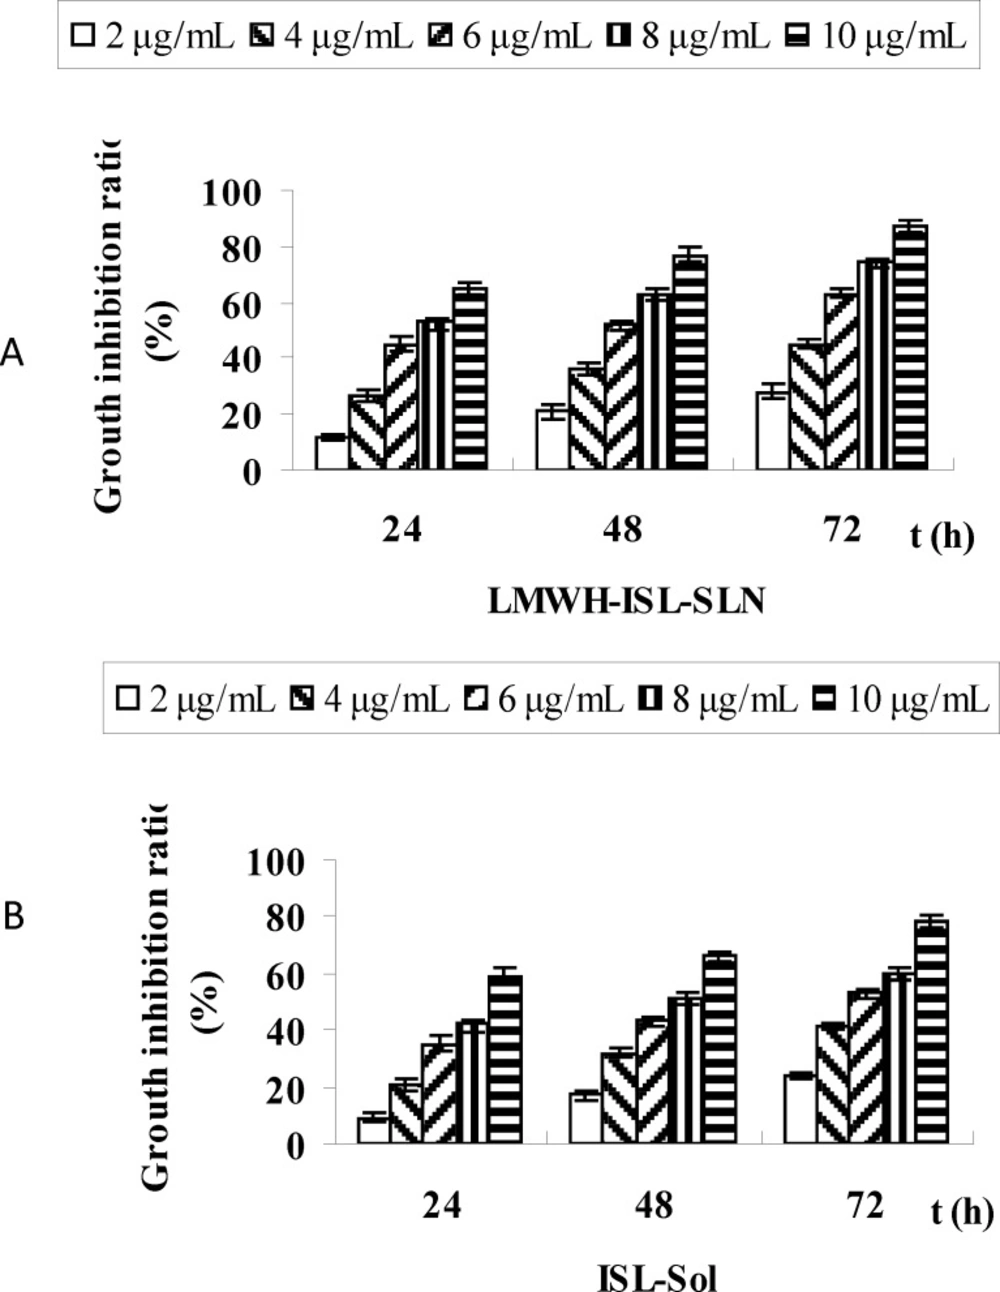
Figure 7
Time-dependent inhibition rates of LMWH-ISL-SLN (A) and ISL-Sol (B) in the Hep-G2 cell line in vitro
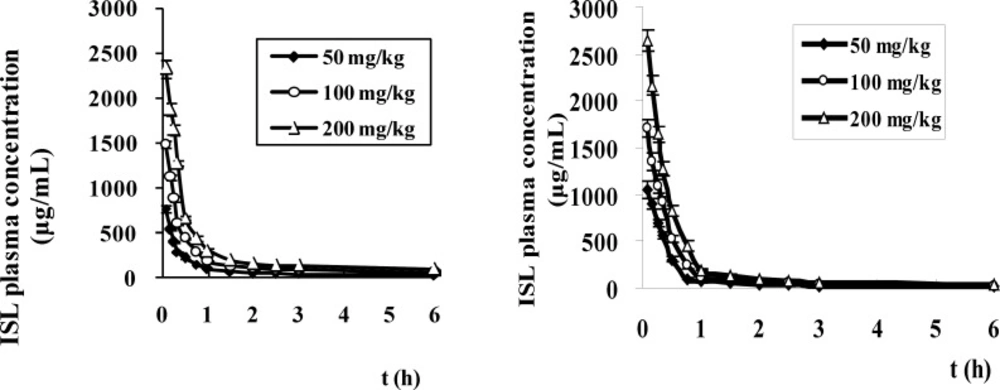
Figure 8
The plasma concentration-time profiles of ISL in mice after intravenous administration of LMWH-ISL-SLN (A) and ISL solution (B) at doses of 50, 100 and 200 mg/kg. (n = 6
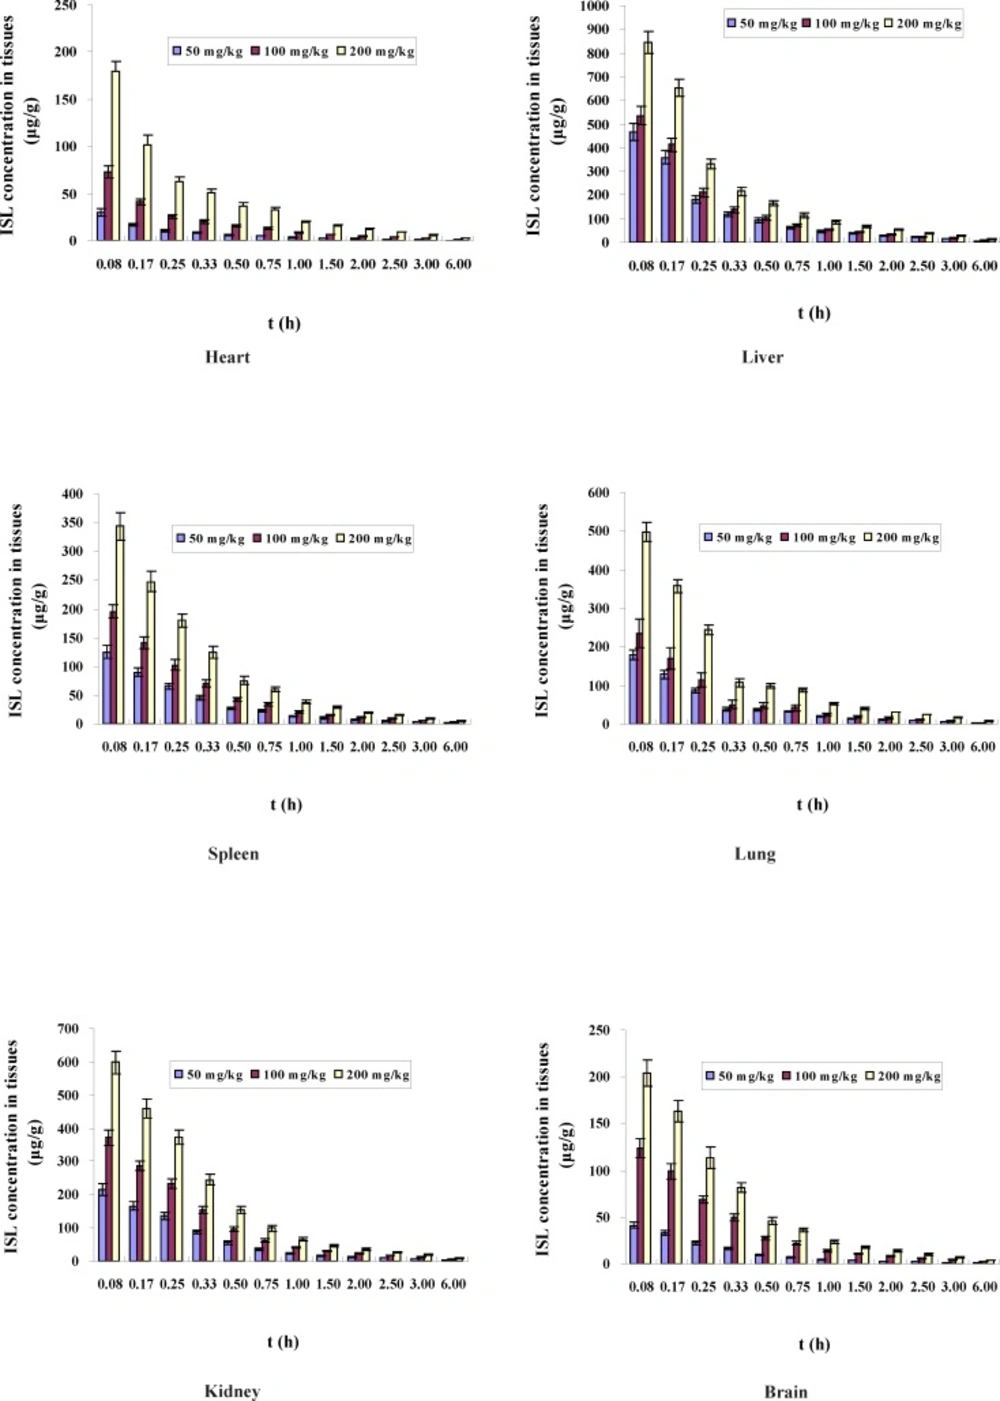
Figure 9
Concentrations of ISL (μg/g tissue) in mice after intravenous administration of LMWH-ISL-SLN at different tissues (n = 6
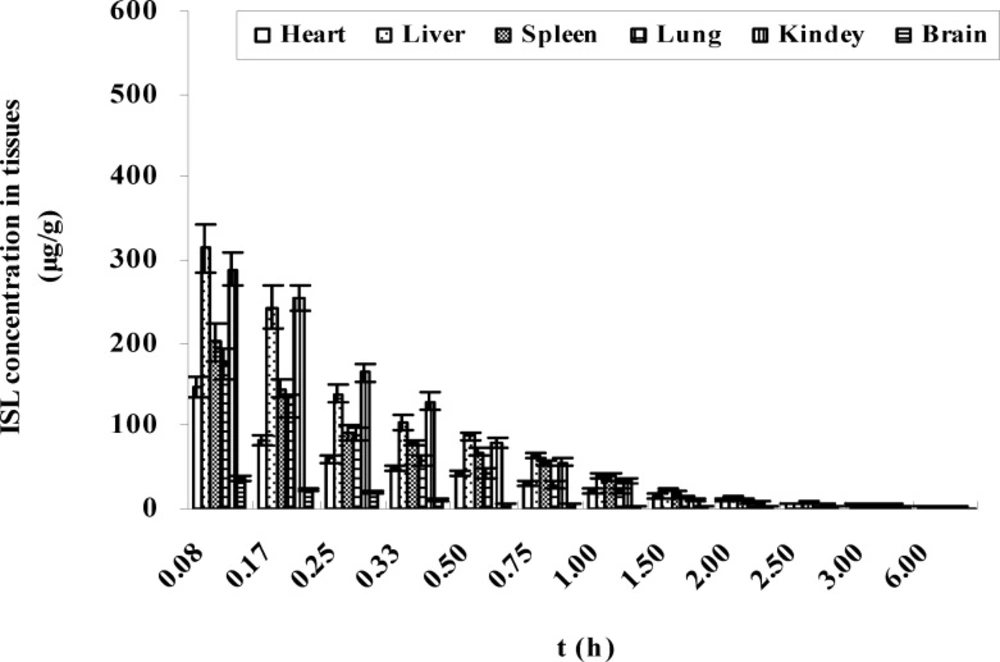
Figure 10
Concentrations of ISL (μg/g tissue) in mice after intravenous administration of ISL-Sol at 100 mg/kg dose (n = 6).
Results and discussions
Characteristics of LMWH-ISL-SLN
The morphology and size of the LMWH-ISL-SLN were shown in Figure 2. The SLN particles are spherical. The mean particle size of LMWH-ISL-SLN was (217.53 ± 4.86) nm (Figure 3.) with a narrow polydispersity index (PI = 0.16 ± 0.03), and its zeta potential was (–18.24 ± 2.47) mV (Figure 4.). Drug loading was (18.68 ± 1.51) %, and the entrapment efficiency was (99.80 ± 3.27)%.
Storage stability of LMWH-ISL-SLN
Due to the instabilities of the SLN suspensions, the freeze-dried LMWH-ISL-SLN was employed to improve the storage stability. Mannitol (8%, w/v) was chosen as the cryoprotectants to prevent the aggregation between nanoparticles during the freeze drying process. Figure 5A showed the particle size and zeta potential of LMWH-ISL-SLN against storage time. Even though the lyophilized powders of LMWH-ISL-SLN were stored for 3 months, the particle sizes only slightly increased, but zeta potential values of the lyophilized nanoparticles only slightly decreased. Figure 5B showed that EE and DL of the lyophilized nanoparticles almost unchanged.
The in-vitro release of LMWH-ISL-SLN
The in-vitro release curve of the LMWH-ISL-SLN was shown in Figure 6. Nearly 60% drug was released from the LMWH-ISL-SLN during the first 8 h, which was caused by the different melting points between solid lipid and liquid lipid. Firstly, the solid lipid which has a higher melting point could crystallize forming a core without liquid lipid or with little liquid lipid. Next, most of the liquid lipid located at the outer shell of the nanoparticles led to drug enriched shell. Meanwhile, the medium-chain triglyceride-enriched outer layers possessed a soft and considerably higher solubility for lipophilic drug, in which the drug was easily loaded with higher amount and could be easily released by the drug diffusion or the matrix erosion manners. Therefore, LMWH-ISL-SLN showed the burst release at the initial stage and sustained release subsequently. The results in Table 2. demonstrated that release mechanism of LMWH-ISL-SLN was in line with Weibull’s distribution law.
Antiproliferative activity
Figure 7. showed the inhibition rates of LMWH-ISL-SLN and ISL-Sol in Hep-G2 cell lines in-vitro after 24, 48 and 72 h incubation period. LMWH-ISL-SLN and ISL-Sol showed a similar time-dependent and concentration dependent behavior in the Hep-G2 cell line. The inhibition rates of LMWH-ISL-SLN, at a concentration of 10 μg/mL, caused a strong inhibition of Hep-G2 cell growth after 24, 48 and 72 h exposure, were 65.03 ± 1.81%, 77.21± 2.53%, and 87.16 ± 2.12%, In case of ISL-Sol, the inhibition rates were 59.33 ± 2.72%, 66.14 ± 1.93% and 78.08 ± 2.06 %, respectively. The half maximal inhibitory concentration (IC50) was calculated in order to compare the nanoparticles cytotoxicity (29). IC50 values were presented in Table 3.
Safety
The safety of LMWH-ISL-SLN can be evaluated by the red cell haemolysis assay. The hemolytic potential of LMWH-ISL-SLN was evaluated to ensure their hemocompatibility. In the present study, LMWH-ISL-SLN at the concentration of 1.5 mg/mL did not cause any hemolysis on rabbit erythrocyte comparing with the negative control. The LD50 of LMWH-ISL-SLN and ISL-Sol were determined to compare their dose-related toxic effects. The LD50 and 95% confidence limits of LMWH-ISL-SLN was 525.23 mg/Kg and 504.08-548.12 mg/Kg respectively. The LD50 and 95% confidence limits of ISL-Sol was 415.13 mg/Kg and 396.31-434.64 mg/Kg, respectively. The LD50 of LMWH-ISL-SLN was 1.27 fold higher than that of ISL-Sol. No mouse died after being injected with LMWH-ISL-SLN though the dose went up to 430 mg/Kg. There were no marked toxic effects evident in the experimental animals injected with LMWH-ISL-SLN at a dose of 430 mg/Kg. The results demonstrated that the LMWH-ISL-SLN was safe.
Pharmacokinetics study
After a single intravenous administration of LMWH-ISL-SLN and ISL-Sol in mice at doses of 50, 100 and 200 mg/Kg, the plasma drug concentration-time curves (mean ± SD) of ISL are presented in Figure 8 and the corresponding pharmacokinetic parameters are listed in Table 4. respectively. As shown in Table 4. there were no statistically significant differences in several pharmacokinetic parameters including MRT, t1/2z, Clz and Vss of ISL after an intravenous administration of LMWH-ISL-SLN at the three doses of 50, 100 and 200 mg/Kg. However, these pharmacokinetic parameters showed statistically significant differences between LMWH-ISL-SLN and ISL-Sol at same dose. Compared to ISL-Sol, the parameters of AUC0 →∞ and Vss of ISL were significantly increased (p < 0.05), and the MRT and t1/2z was prolonged (p < 0.05) after an intravenous administration of LMWH-ISL-SLN at the three doses of 50, 100 and 200 mg/Kg. These differences indicated that LMWH-ISL-SLN could postpone the elimination of ISL and lead to a long blood circulating effect in mice plasma. In Table 4, the Cmax and AUC(0→∞) of LMWH-ISL-SLN increased in proportion to the test doses, respectively, suggesting the linear pharmacokinetic behavior of ISL after intravenous administration of LMWH-ISL-SLN over the above dose range, respectively, which was consistent with that previously reported by us (24). For LMWH-ISL-SLN, the AUC (0→∞) of ISL was higher 1.32, 1.67 and 1.58 times than that of ISL-Sol at the three doses of 50, 100 and 200 mg/Kg, respectively. The results of the pharmacokinetics studies showed that the pharmacokinetic behaviors of ISL after administration of the LMWN-ISL-SLN were significantly different from that of ISL-Sol.
Tissue distribution
The organ concentrations of ISL after intravenous administration of LMWH-ISL-SLN in mice were shown in Figure 9. Biodistribution of ISL-Sol was shown in Figure 10. At 0.08 h after administration of LMWH-ISL-SLN, the concentrations of ISL in tissues all reached a maximum and then decreased rapidly. At 2 h after intravenous administration, the ISL concentrations from ISL-Sol were low in all collected tissues, that is, there was no long-term accumulation following intravenous injection of ISL-Sol. While the concentrations of ISL from LMWH-ISL-SLN were higher than that from ISL-Sol in all collected tissues at 6 h after intravenous administration, that is, there was to a certain degree long-term accumulation following intravenous injection of LMWH-ISL-SLN. The total concentrations of ISL from LMWH-ISL-SLN were highest in liver, followed by kidney, lung, spleen, brain and heart. It was noteworthy that at each time point the concentrations of ISL in heart were higher for ISL-Sol than for LMWH-ISL-SLN. The concentrations of ISL in brain were lower for ISL-Sol than for LMWH-ISL-SLN. This indicated a possible reduction of the cardiac toxicity and enhancement of the therapeutic index of brain when administered LMWH-ISL-SLN.
Conclusions
This is the first report describing the in-vitro antiproliferative activity, safety, pharmacokinetics and biodistribution of LMWH-ISL-SLN after intravenous administration. Antiproliferative activity testing in Hep-G2 cell lines of LMWH-ISL-SLN exhibited superior proliferation inhibition effects. Incorporation of ISL in low molecular weight heparin-modified SLN possessed good blood compatibility. The in-vitro release study revealed that the encapsulated ISL in LMWH-ISL-SLN prolonged the release behavior of ISL. Work of LMWH-ISL-SLN on hematology and cytotoxic effects are in progress. Our results suggest that the low molecular weight heparin-modified SLN system is a promising approach for the intravenous delivery of ISL.