Materials and methods
Chemicals
Silymarin (SMN, S 0292), Streptozotocin (STZ, S0130) and melatonin (MEL, M5250) standards were purchased from Sigma-Aldrich (Germany). 2, 4, 6-tri-2-pyridyl-1, 3, 5-triazin (TPTZ), FeCl3, dimethyl sulfoxide (DMSO) and ethanol were obtained from Merck (Germany). All other chemicals were commercial products of analytical grade.
Experimental Design
Thirty male and clinically healthy Wistar-Albino rats (220-250 g) were kept under a 12-h light cycle with free access to a standard diet and water in a temperature controlled room at Urmia University. The animals randomly assigned to five groups (n = 6) including control, non-treated diabetic and treated diabetic. The treated diabetic group subdivided into three groups which received SMN (50 mg/Kg, p.o.), MEL (10 mg/Kg, i.p.) and/or a combination of SMN and MEL for 28 consecutive days. Control rats were only exposed to the same amount of citrate buffer as the solvent of STZ.
Induction of Type 1 Diabetes
Type 1 DM was induced by a single (i.p.) injection of a freshly prepared solution of STZ in 0.01 M citrate buffer, pH 4.5, (50 mg/Kg/BW). Rats with a blood glucose level of 250 mg/dL or greater were accepted as diabetic and included in this study. For monitoring the blood glucose (BG), blood samples were drawn from the tail veins of rats on days of 1, 2, 3, 7, 14, 21, 28 and the glucometer set was used (Elegance, CT-X10, Convergent Technologies GmbH & Co.KG, Marburg, Germany).
Preparation of Serum Samples and Tissue collection
At the end of experiment all rats were anesthetized by using diethyl ether. Blood samples were taken from the heart of animals. Serum samples were obtained via centrifuging of blood samples at 3,000 × g for 10 min at 4 °C. Afterward, the rats were euthanized by inhalation of CO2. The liver and pancreases were removed and after trimming the adipose tissues from pancreases and washing the liver samples with chilled saline normal, the pancreases were fixed in 10% formalin for further histopathological examinations and the liver samples following snap freeze in liquid nitrogen were kept at -70 °C for further biochemical analyses.
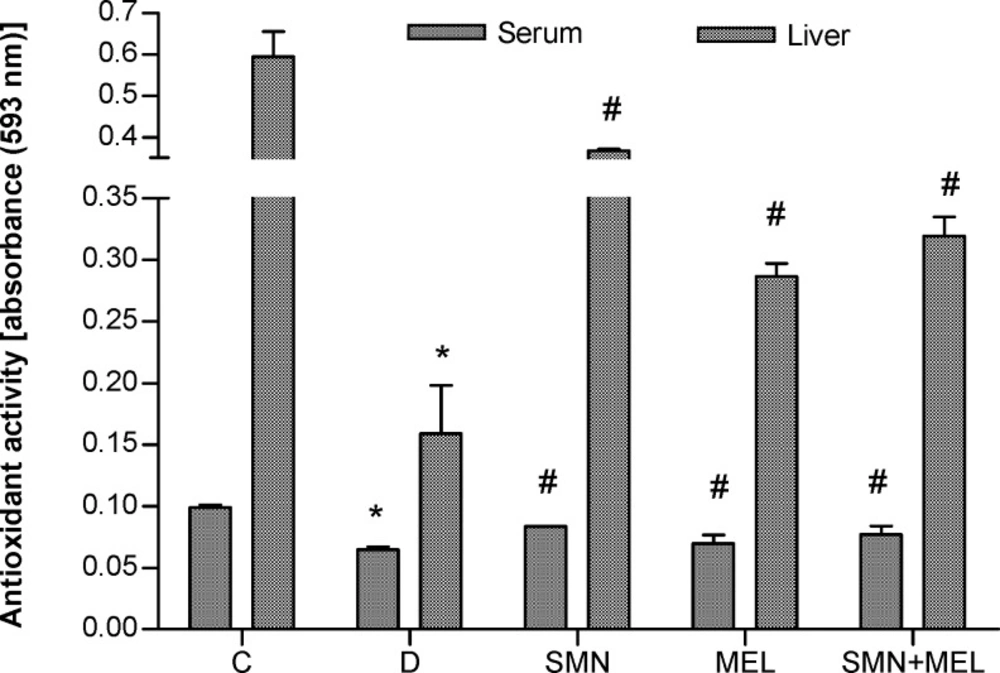
Assessment of total antioxidant capacity (TAC)
To determine the effect of diabetes on total antioxidant capacity and consequently potential therapeutic effect of SMN and MEL on disturbed antioxidant system, the reducing capacity of serum and liver homogenate were measured. The assessment carried out based on ferric reduction antioxidant power (FRAP) assay (
12). Briefly, at low pH which was provided using acetate buffer (300 mM, pH 3.6), reduction of Fe
III-TPTZ (2, 4, 6-tri-2-pyridyl-1, 3, 5-triazin, Merck, Germany) complex to the ferrous form produces an intensive blue color that could be measured at 593 nm. The intensity of the complex following adding the appropriate volume of the serum/or the liver tissue homogenate supernatant to reducible solution of Fe
III-TPTZ is directly related to total reducing power of the electron donating antioxidant. Aqueous solution of Fe
II (FeSO4.7H2O) and appropriate concentration of freshly prepared ascorbic acid were used as blank and standard solutions, respectively.
Insulin measurement
Serum level of insulin was measured by 1-step chemiluminescence sandwich assay using directly coated magnetic microparticles (LIAISON® Insulin, DiaSorin S.p.A. via Crescentino 13040 Saluggia, Vercelli, Italy) and according to instructions of kit manufacturer. The lowest level of detection was 0.23-0.61 µIU/mL and measuring range was 0-500 µIU/mL.
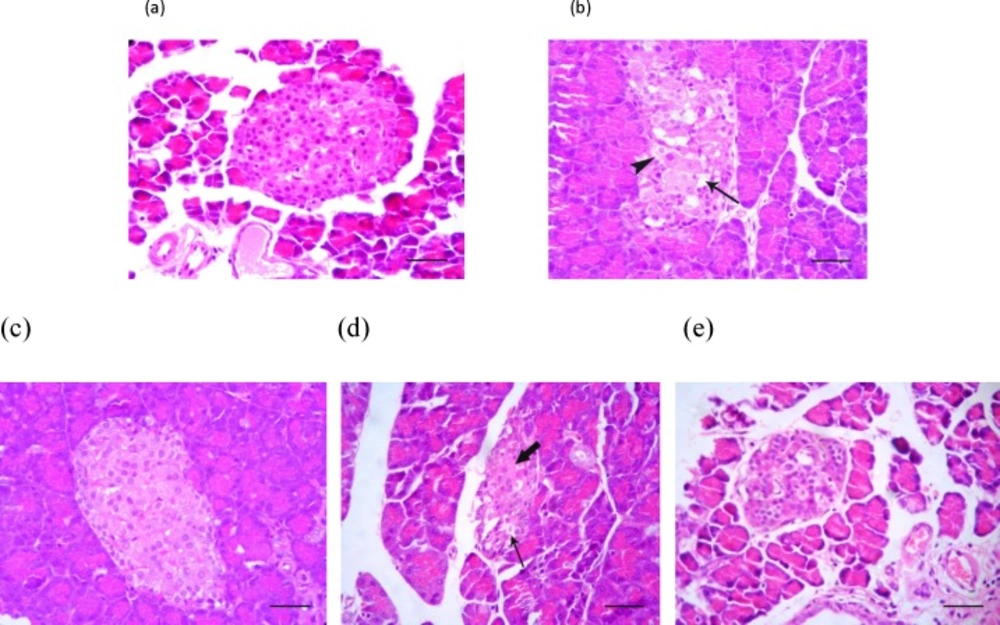
Histopathological and histochemicaal examinations
The Hematoxyline & Eosin staining was performed on the pancreas sections (5 µM) to evaluate any diabetes-induced histological damages. For each animal in the test and control groups at least three slides were prepared.
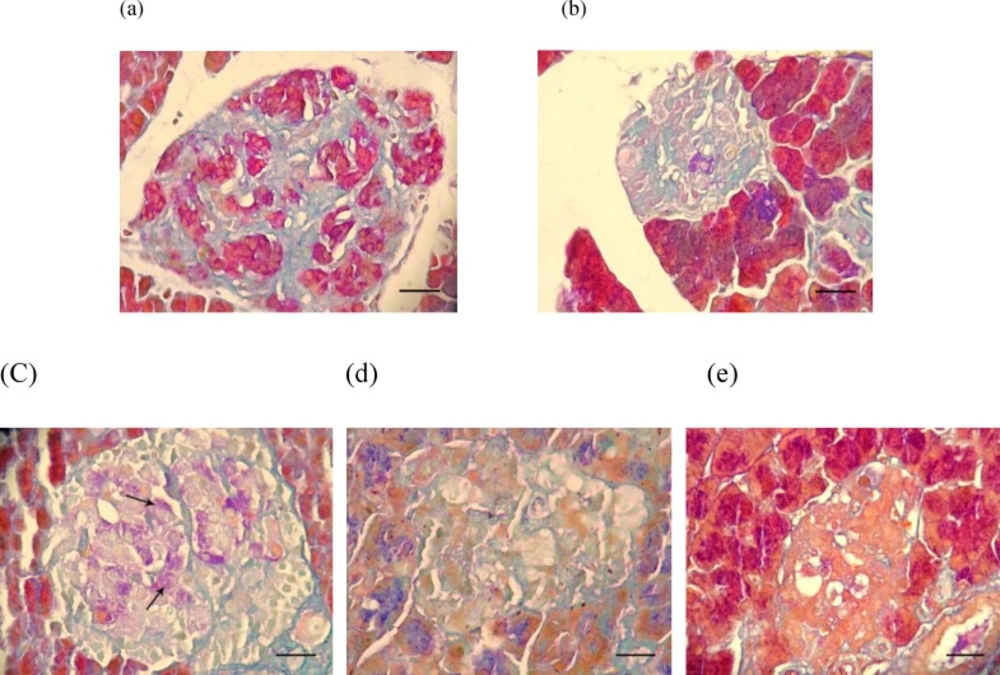
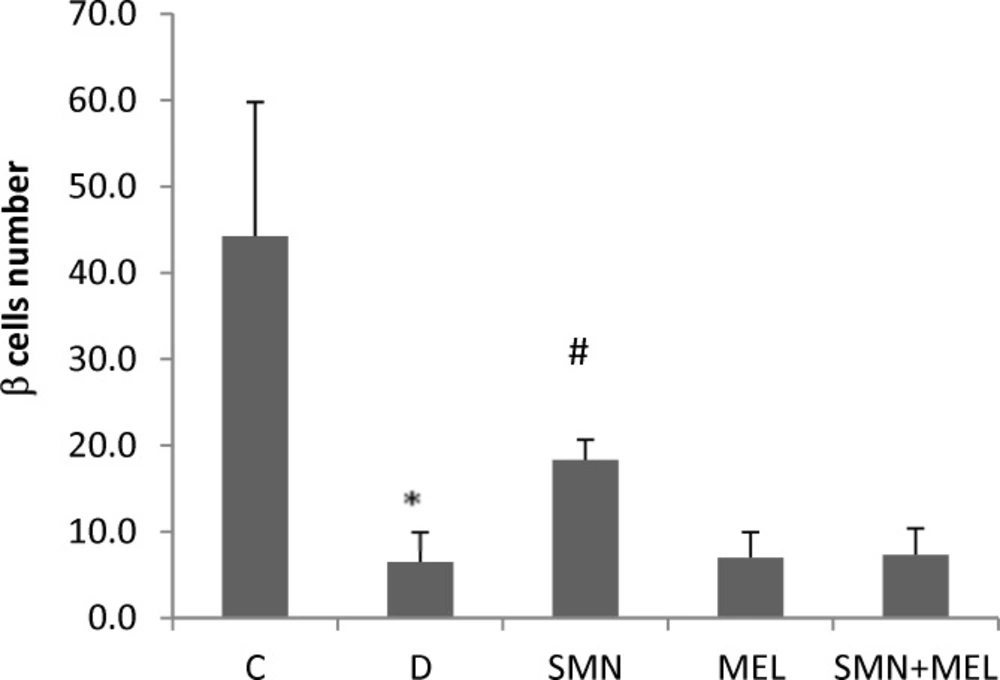
To clarify the diabetes and test compounds effect on beta cells, the aldehyde fuchsin histochemical method was also performed (
13). By this staining beta cells in islets of pancreas are stained purple-violet. In order to enumerate the number of beta cells, for each study group, 10 equally same size microscopic fields were screened and the cells with purple-violet granules counted as beta cells. The pathological examinations were performed by a pathologist who was completely unaware of the study purposes.
Statistical analysis
The obtained numerical data were analyzed using Graph Pad Prism software (version 2.01. Graph Pad software Inc. San Diego, California). The comparisons between groups were made by analysis of variance (ANOVA) followed by Bonferroni post hoc test. A P value <0.05 was considered significant.