The structural features and the experimental cytotoxic potencies (represented as pIC
50) of the 3,5-bis(benzylidene)-4-piperidone derivatives
1-
7 used in this study are shown in
Table 1 (
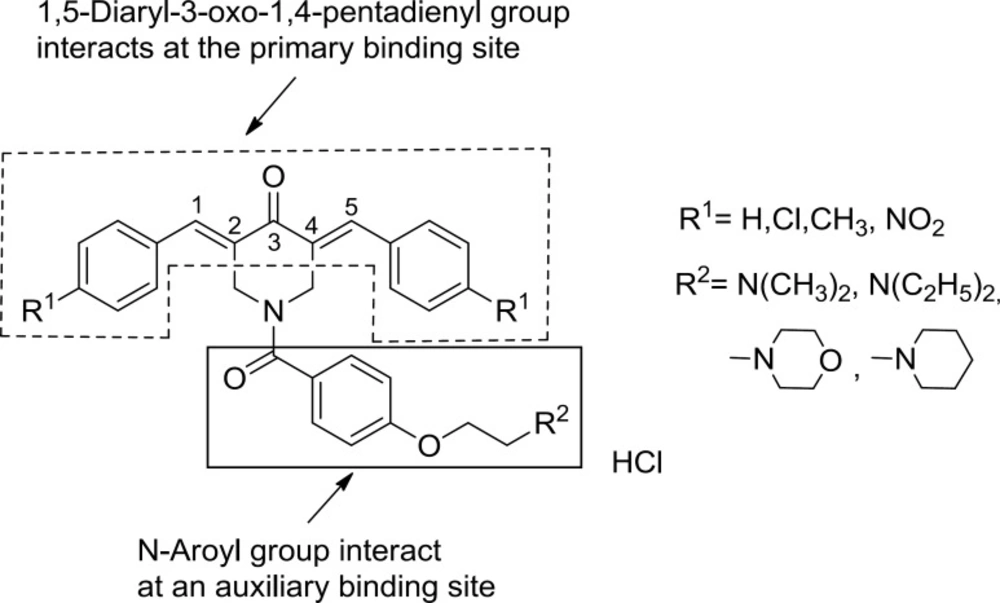
8). A SAR study of these compounds demonstrated that the attachment of the N-aroyl group to the 3,5-bis(arylidene)-4-piperidones resulted in enhanced cytotoxic potencies toward murine L1210 lymphocyte leukemia cells and two human T-lymphocytes Molt4/C8 and CEM. It was suggested that in the case of various members of series
2-
7, alignment of the N-aroyl groups with auxiliary binding sites takes place reinforcing the interaction of the 1,5-diaryl-3-oxo-1,4-pentadienyl pharmacophore with a primary binding site.
REP: Relative error of prediction.
The compounds are included in the prediction set.
In order to find important structural features of the N-aroyl-3,5-bis(benzylidene)-4-piperidones which contribute to the cytotoxic potencies, a QSAR study was performed using different molecular descriptors and chemometrics tools. In this study, the chemometrics methods such as stepwise multi-linear regression (MLR) and genetic algorithm-partial least squares (GA-PLS) were used for modeling the relationship between the biological activity and molecular descriptors and the results were compared to find the best predictive cytotoxicity models.
MLR modeling
Separate stepwise selection-based MLR analyses were performed using different types of descriptors, and then a MLR equation was obtained using the pool of all calculated descriptors. As there are 19 molecules in the training set and according to the rule of thumb (the ratio of 5:1 for molecule ⁄ variable; Toplis ratio) (
16), MLR models with a maximum number of 3 or 4 variables were selected. The results are summarized in
Table 2. A small difference between the conventional and cross-validated correlation coefficients of the different MLR equations (
Table 2) reveals that none of the models are over fitted, which can be partially attributed to the absence of collinearity between the variables in one hand and using no extra variables on the other hand. The correlation coefficient (r
2) matrix for the descriptors used in different MLR equations shows that no significant correlation exists between pairs of descriptors (
Table 3).
| Equation | Cell line | QSAR Model | n | R2a | SEb | RMScvc | Q2d | Fe |
|---|
| 1 | L1210 | Y= 9.037 (±1.56) Molecular density +3.693 (±1.435) HNar -0.007 (±0.003) Heat of formation - 9.712(±3.910) | 19 | 0.70 | 0.38 | 0.44 | 0.50 | 11.25 |
| 2 | CEM | Y=7.352 (±0.913) Molecular density + 0.062 (±0.009) Hydration energy +89.840 (±34.561) X4A - 12.102(±4.537) | 19 | 0.85 | 0.25 | 0.29 | 0.77 | 29.11 |
| 3 | Molt/C8 | Y=7.507 (±1.155) Molecular density -0.493 (±0.084) Homo + 0.09 (±0.031) Dipole X + 6.039(±1.647) | 19 | 0.81 | 0.31 | 0.34 | 0.72 | 21.31 |
Squared correlation coefficient;
Standard error of regression;
Root mean square of cross validation;
Leave-one-out cross-validation correlation coefficient (R2CV);
F-statistics.Squared correlation coefficient (R2) was calculated using following equation: 1-(Σ (y experimental – y calculated by model)2/Σ (y experimental – y average. experimental)2)) Equation for calculation of Standard error of regression: [SE2= Σ ((y experimental – y calculated)2/n - p') (n= number of samples, p'= number of model parameters)]
| Heat of formation | HNar | Molecular density | Hydration energy | X4A | HOMO | Dipole x |
|---|
| Heat of formation | 1 | -0.352 | 0.340 | -0.573 | .334 | 0.653 | 0.045 |
| HNar | | 1 | -0.4920 | 0.232 | .288 | -0.292 | 0.180 |
| Molecular density | | | 1 | -0.159 | -0.121 | 0.364 | 0.244 |
| Hydration energy | | | | 1 | -0.114 | -0.667 | 0.184 |
| X4A | | | | | 1 | 0.110 | 0.192 |
| Homo | | | | | | 1 | 0.4730 |
| Dipole x | | | | | | | 1 |
L1210 cell line. Stepwise selection and elimination of variables produced a three-parametric QSAR equation 1, having moderate statistical quality (R
2 = 0.70, SE = 0.38, Q
2 = 0.50, RMS
CV = 0.45 and R
2pred = 0.69) (
Table 2 and
4). The selected variables demonstrate that chemical (heat of formation), topological and spatial parameters (molecular density and Narumi harmonic topological index (HNar) mainly affect the cytotoxic potential of the 3,5-bis(arylidene)-4-piperidone derivatives against the L1210 cell line.
CEM cell line
The MLR equation 2 obtained from the pool of the calculated descriptors for the CEM cell line possesses good statistical quality (R
2 = 0.85, SE = 0.25, Q
2 = 0.77, RMS
CV = 0.29 and R
2pred = 0.81) (
Table 2 and
4) and demonstrates that the anticancer property of the compounds is mainly dependent on chemical (heat of formation), topological and spatial (molecular density and average connectivity index chi-4:X4A) properties of the molecule. These results show that the parameters that influence anticancer properties of the compounds against the CEM line are similar to those obtained for the L1210 cell line.
Molt/C8 cell line
The three-parametric QSAR equation 3 (
Table 2) demonstrates the quantitative effects of the structural parameters on the cytotoxic potential of 3,5-bis(arylidene)-4-piperidone derivatives on the Molt/C8 cell line. This model demonstrated high statistical quality (R
2 = 0.81, SE = 0.31, Q
2 = 0.72, RMS
CV = 0.34, and R
2pred = 0.64) (
Table 2 and
4) which reveals the significant effects of quantum (HOMO, dipole moment X (DMx)) and spatial parameter (molecular density) on the cytotoxic activity of the compounds. It is revealed that the molecular density plays a determinant effect on the cytotoxic potential of the compounds on this cell line. Therefore, the molecular density and topological parameter are important descriptors that should be taken into consideration in the designing of potent cytotoxic 3,5-bis (arylidene)-4-piperidones analogs.
| Cell line | Method | R2c | Q2d | SEprede | R2predf |
|---|
| L1210 | MLR | 0.70 | 0.50 | 0.44 | 0.69 |
| PLS | 0.86 | 0.66 | 0.37 | 0.81 |
| CEM | MLR | 0.85 | 0.77 | 0.29 | 0.81 |
| PLS | 0.87 | 0.71 | 0.35 | 0.83 |
| Molt4/C8 | MLR | 0.81 | 0.72 | 0.34 | 0.64 |
| PLS | 0.91 | 0.77 | 0.32 | 0.82 |
Multiple linear regressions,
Genetic algorithm-partial least square,
correlation coefficient of regression,
Leave-one-out cross-validation correlation coefficient (R2CV),
Standard error of prediction regression,
Correlation coefficient of prediction regression
GA-PLS modeling
L1210 cell line
In PLS analyses, the descriptors data matrix is decomposed into orthogonal matrices, the scores of which are constrained to have inner relationships with the dependent variables. Therefore the multi-collinearity problem in the descriptors is omitted by PLS analysis. To find a more convenient set of descriptors in PLS modeling, a genetic algorithm was used. To do so, many different GA-PLS runs were conducted using different initial sets of populations. Given 19 calibration samples, the leave-one-out cross-validation procedure was used to find the optimum number of latent variables for each PLS model. For the L1210 cell line, the GA-PLS model that resulted in the best fit contained 7 indices (two of these indices such as molecular density and heat of formation were also obtained by MLR in this cell line). Moreover, similar to the results of MLR analysis, GA-PLS analysis also showed that topological parameters affect the cytotoxic potencies of the compounds in the L1210 cell line. As per GA-PLS modeling, a combination of chemical (heat of formation, melting point), quantum chemical (dipole moment X), conformational (torsion energy) and spatial (molecular density) descriptors account for the cytotoxic potential of the compounds toward L1210 cells. The resulted GA-PLS model possess very good statistical quality (i.e., R
2 = 0.86, Q
2= 0.66). The predictive ability of the model was measured by application to 6 external test set molecules (R
2pred = 0.81 and SE
pred =0.37). The calculated values of pIC
50 obtained by the PLS model in the L1210 assay (refined from cross-validation of external prediction set) are shown in
Table 1.
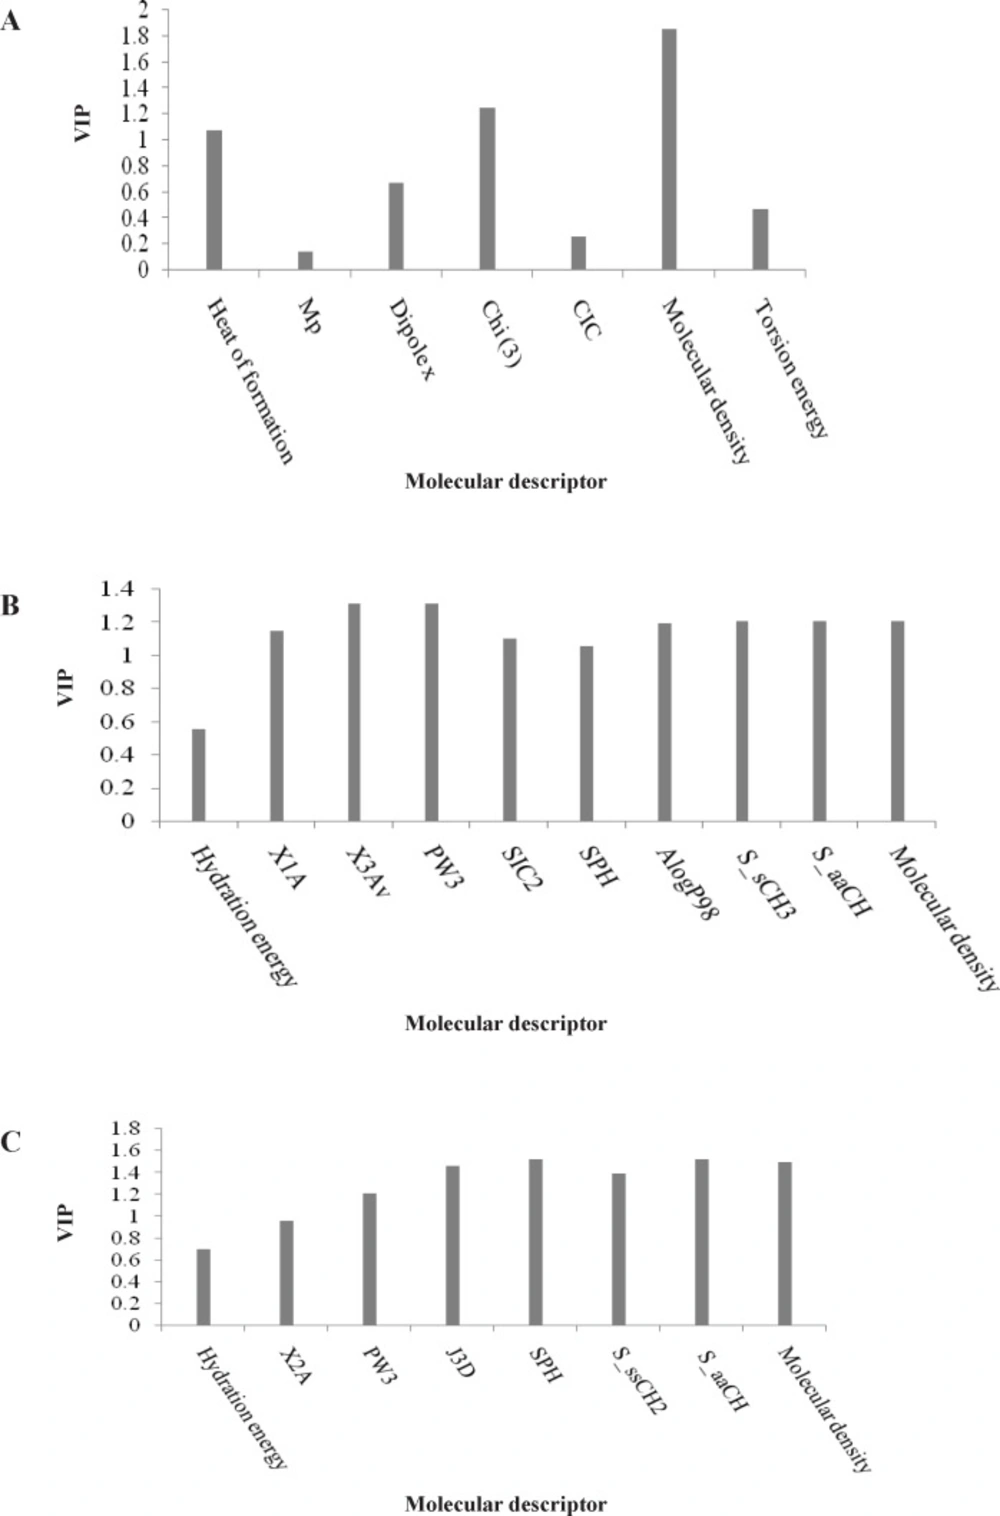
To measure the significance of the 7 selected PLS descriptors, the variable importance in projection (VIP) was calculated for each descriptor. According to the method described by Eriksson et al. (
20), X-variable (predictor variable) could be classified according to their relevance in explaining Y-variable (predicted variable) i.e. VIP > 1.0 (highly influential), VIP < 0.8 (less influential), and 0.8 < VIP < 1.0 (moderately influential). The VIP analysis of the descriptors of the input variables used in the PLS equation (
Figure 2A) shows that the parameters such as topological index (Chi3), molecular density and heat of formation are the most important indices in the QSAR equation derived by PLS analysis for L1210 cell line. The regression coefficients of the selected variables obtained by GA-PLS model of QSAR analysis for three different cell lines are illustrated in
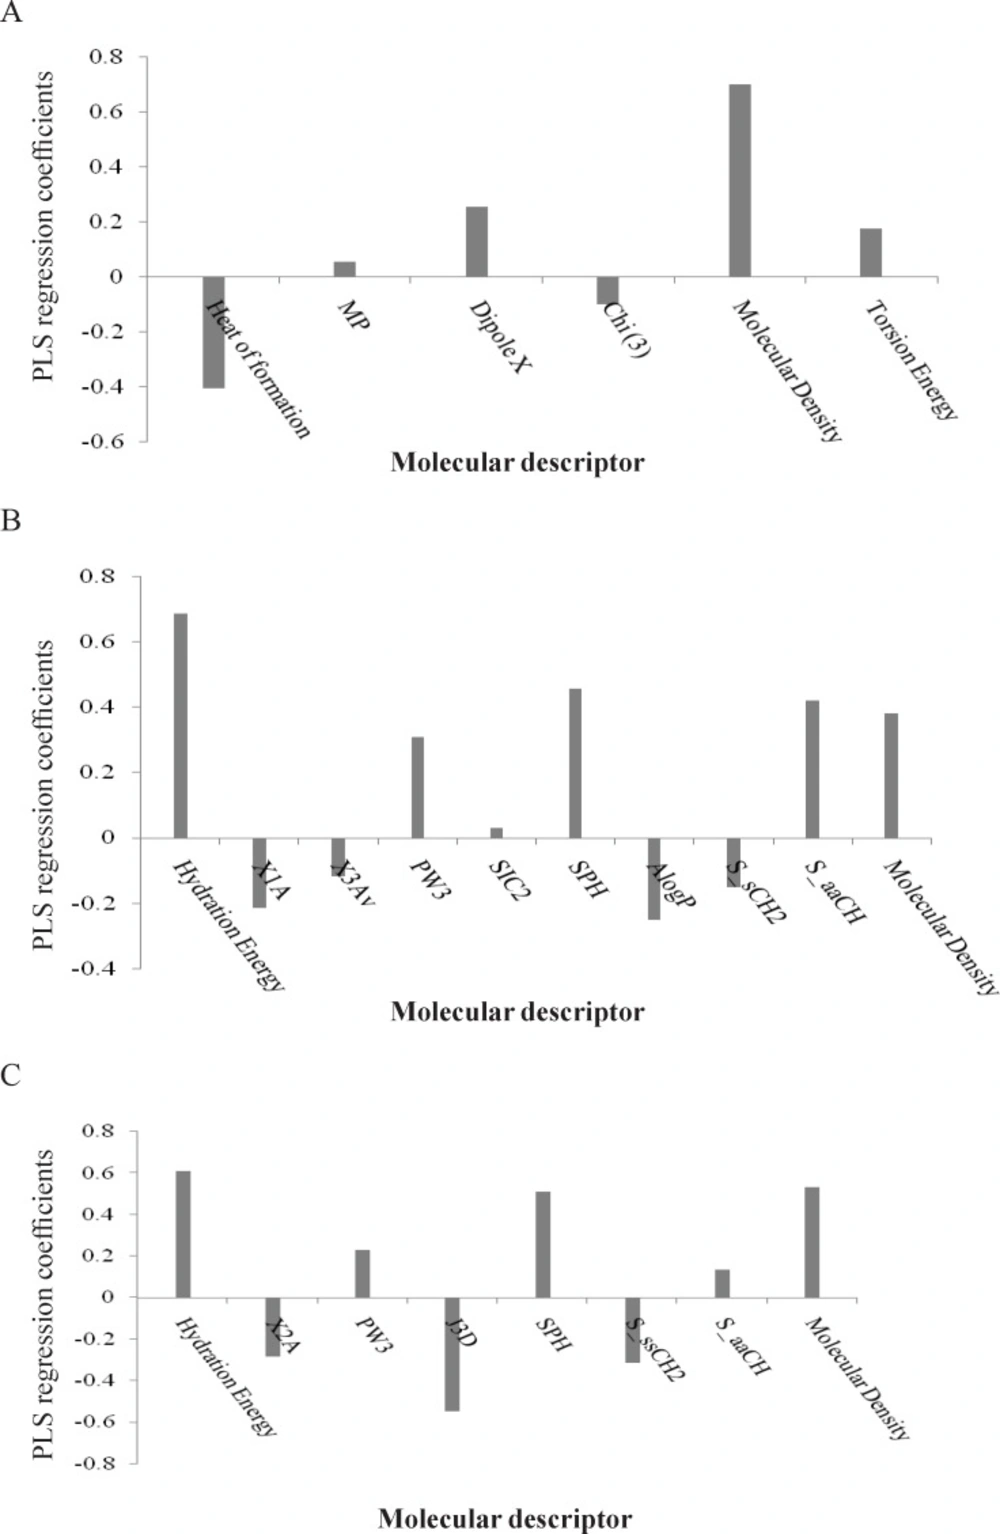
Figure 3.
Variable importance for projection (VIP) of the selected variables obtained by GA-PLS model for the QSAR analysis of three different cell lines: (A) L1210, (B) CEM, and (C) Molt/C8
Regression coefficients of the selected variables derived by the GA-PLS model for QSAR analysis of three different cell lines: (A) L1210, (B) CEM, and (C) Molt/C8
CEM cell line
The best GA-PLS model to predict cytotoxic activities of the compounds in series
1-
7 toward the CEM cell line includes 10 indices (three of the indices are similar to that obtained by the MLR analysis). A combination of topological (X
1A), Chi-1(average connectivity index), PW3 (Randic shape index), X
3Av (average valance connectivity), SIC
2 (structural information content: symmetry 2-order)), geometrical (SPH (spherocity of molecule)), chemical (LogP), spatial (molecular density), electrotopological state (sum of the E-state value for the CH group in the aromatic ring (S_aaCH) and sum of the E-state value for the methyl group (S_sCH
3)) indices account for the cytotoxic properties of the 3,5-bis(arylidene)-4-piperidones toward the CEM cell line. The resulted GA-PLS model showed high statistical quality (i.e., R
2 = 0.87 and Q
2 = 0.71). The PLS estimate of the coefficients for these descriptors are given in
Figure 3B. The predictive ability of the model was measured by application to 6 external test set molecules (R
2pred = 0.83 and SE
pred =0.35).
The pIC
50 values used in the PLS model (refined from cross-validation of external prediction set) are shown in
Table 1. The VIP analysis of PLS equation presented in
Figure 2B suggests that among the selected descriptors, topological and electrotopological parameters such as X
1A, PW
3, X
3Av and estate keys (S_sCH
3 and S_aaCH) are important influential descriptors. Similar to the L1210 cell line, the molecular density of the compounds is also a determinant parameter that influence cytotoxicity of 3,5-bis(arylidene)-4-piperidones against the CEM cell line.
Molt 4/C8 cell line
A combination of 8 selected variables such as chemical (hydration energy), topological (X
2A), geometrical (PW
3, J
3D (3D-balaban index), SPH), spatial (molecular density) and electrotopological state indices (sum of the E-state value for the CH group in the aromatic ring (SaaCH) and sum of the E-state value for the methyl group (S_sCH
3)) influence cytotoxic potencies of the compounds in series
1-
7 against the Molt 4/C8 cell line as indicated by the best GA-PLS model. Most of these variables contribute significantly to the GA-PLS model as discussed previously for the CEM cell line. The resultant GA-PLS model demonstrated very high statistical quality [R
2 = 0.91 and Q
2 = 0.77] [
Figure 3C]. The predictive ability of the model was measured by applying to 6 external test set molecules and the squared correlation coefficient for prediction (R
2pred) was found to 0.82.
The VIP analysis of the GA-PLS model presented in
Figure 2C showed that the molecular density, topological (X
2A), geometrical (SPH, J
3D) and electrotopological state indices influence the cytotoxicity of the compounds in series
1-
7. This result is similar to that obtained for the L1210 cell line.
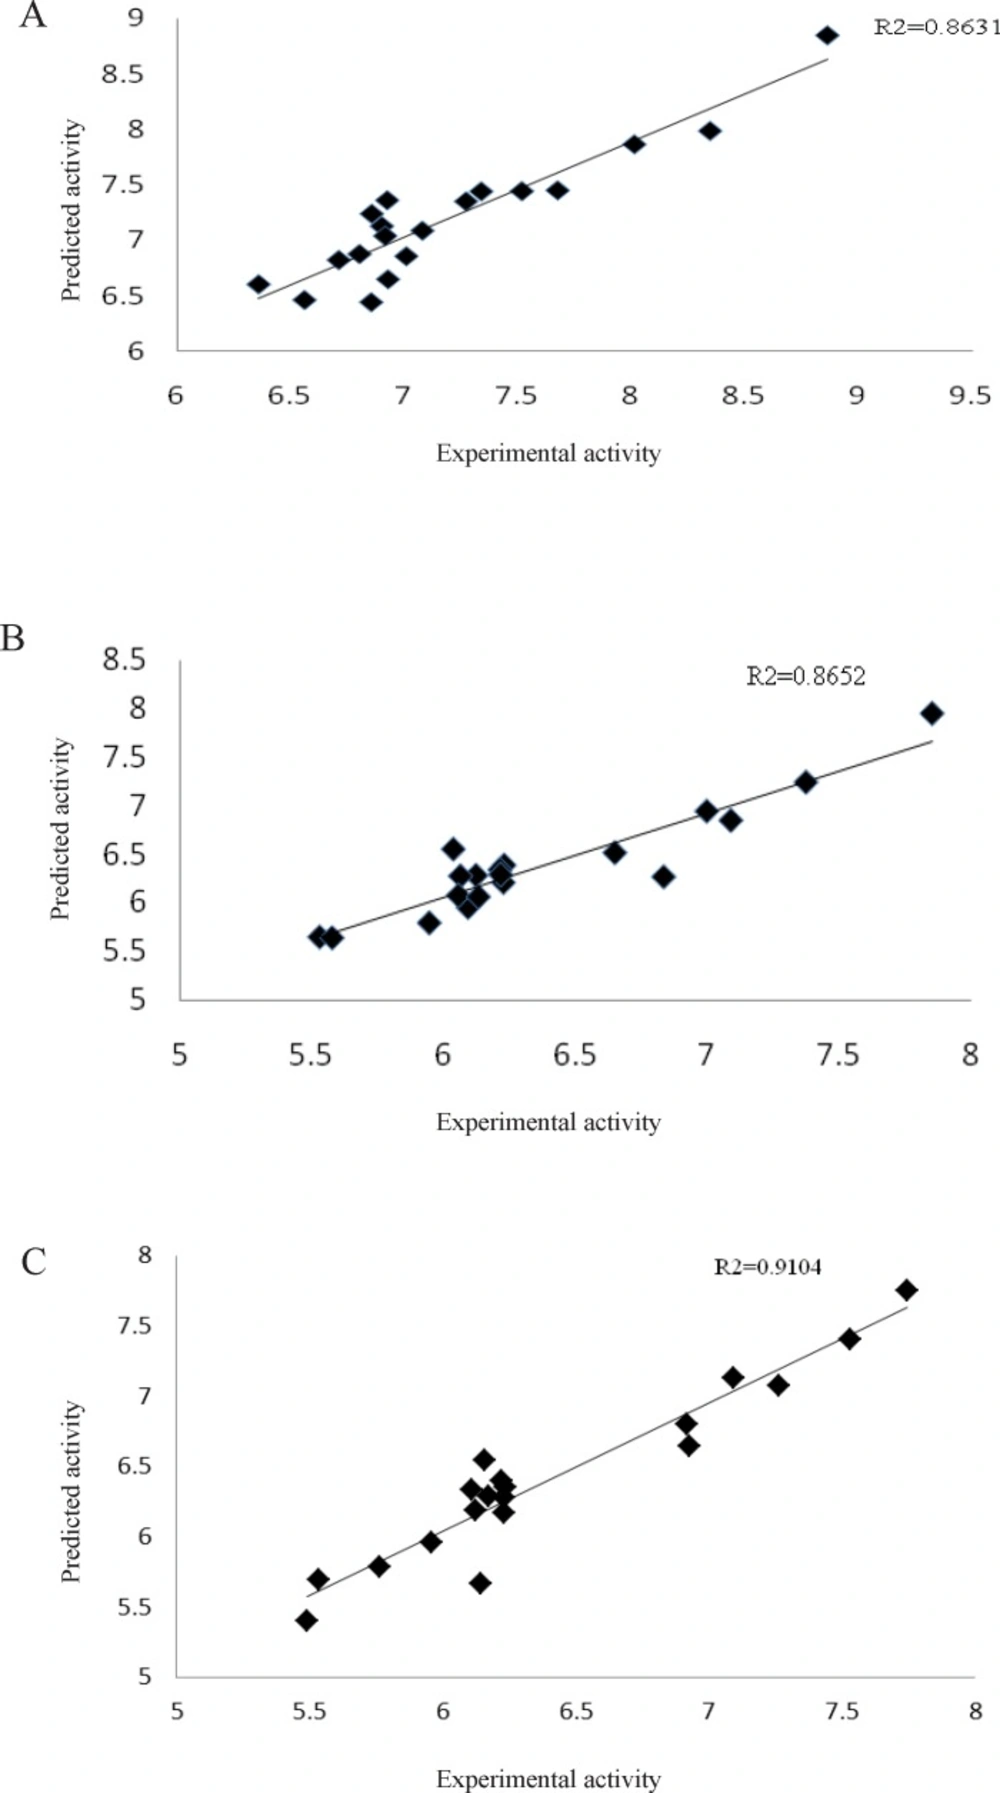
The plots of the predicted pIC
50 values (cross-validated) against the experimental values for the L1210, CEM and Molt4/C8 cell lines by GA-PLS analysis showed R
2 values 0.86, 0.87 and 0.91, respectively (
Figure 4) which indicates that the QSAR models are reliable to predict cytotoxicity of the 3,5-bis(benzylidene)-4-piperidones
1-
7.
Plots of the cross-validated predicted cytotoxic potency values of activity by GA-PLS against the experimental values for three different cell lines: (A) L1210, (B) CEM, and (C) Molt/C8 cell line
All of the generated GA-PLS models were further validated by applying the Y-randomization test. Several random shuffles of the Y vector were performed and the results are shown in
Table 5. The low R
2 and Q
2 values indicate that the good results in our original model are not because of a chance correlation or structural dependency of the training set.
| L1210
| CEM
| Molt4/C8
|
|---|
| Iteration | R2 | Q2 | R2 | Q2 | R2 | Q2 |
|---|
| 1 | 0.11 | 0.03 | 0.35 | 0.12 | 0.02 | 0.00 |
| 2 | 0.26 | 0.06 | 0.01 | 0.00 | 0.11 | 0.01 |
| 3 | 0.10 | 0.02 | 0.18 | 0.05 | 0.14 | 0.00 |
| 4 | 0.34 | 0.11 | 0.28 | 0.03 | 0.29 | 0.03 |
| 5 | 0.16 | 0.00 | 0.20 | 0.01 | 0.33 | 0.12 |
| 6 | 0.22 | 0.01 | 0.08 | 0.00 | 0.24 | 0.10 |
| 7 | 0.03 | 0.00 | 0.31 | 0.14 | 0.17 | 0.00 |
| 8 | 0.19 | 0.03 | 0.30 | 0.10 | 0.36 | 0.08 |
| 9 | 0.08 | 0.02 | 0.17 | 0.07 | 0.25 | 0.02 |
| 10 | 0.38 | 0.04 | 0.06 | 0.00 | 0.23 | 0.05 |
The statistical parameters of QSAR analysis by MLR and GA-PLS are demonstrated in
Table 4. The results indicate that GA-PLS analysis is more accurate for predicting the cytotoxic potential of 3,5-bis(arylidene)-4-piperidones in all three cell lines. The cross-validation statistics reported in
Table 4 suggest the higher prediction ability of the GA-PLS model. This can be a result of the more number of descriptors used by GA-PLS with respect to MLR analysis. As far as the less parametric model is obtained by MLR analysis, the results of MLR analysis are more descriptive for interpretation of the structure-cytotoxic relationship. However for the prediction of the cytotoxic potential of novel compounds of these series, the GA-PLS model is more useful.