Introduction
Dental caries is among the most prevalent and costly oral infectious diseases worldwide (1). The etiology of dental caries is associated with bacterial metabolism of carbohydrates leading to plaque acidification and demineralization of dental hard tissues. Classic bacterial virulence factors contributing to the initiation and progression of dental caries consist of three components, i.e. stable biofilm formation, efficient acid production, and sophisticated environmental stress adaptation (2-5) Streptococcus mutans; one of the primary etiologic agents of dental caries (6, 7) that produces glycosyl transferases (GTFs), which synthesize intracellular and extracellular polysaccharides. The extracellular polysaccharides, especially the water-insoluble glucans, facilitate the initial adherence of S. mutans to tooth surfaces and the formation of mature dental plaque biofilm (8-10). Deletion of gtfB and gtfC genes in S. mutans resulted in diminished biofilm formation with minimal accumulation of bacteria and polysaccharides in-vitro (10). This suggested that suppression of gtf genes may represent an alternative approach for disrupting biofilm formation.
Fixed orthodontic treatment with the use of orthodontic wires provides new surfaces susceptible to plaque accumulation, resulting in an increase in oral microbial count, especially S. mutans (11, 12). Therefore, prevention of bacterial adhesion to orthodontic wires and inhibition of biofilm formation by the use of novel natural anti-plaque agents is an important priority for dental scientists.
Punica granatum L. (Punicaceae), known as pomegranate (Golnar-e-Farsi), is a small tree that is native in the region from Iran to northern India. This medical herb has important antibacterial, antifungal, and antiviral activity (13).
Rhus Coriaria L. (Anacardiaceae), known as sumac (also spelled sumach), grows wild in Iran and Afghanistan and is traditionally used in foods. Antibacterial and antioxidant effects of Rhus coriaria L. extract have been confirmed in several studies (14, 15).
In our previous study, viable cell counting and scanning electron microscopic (SEM) analysis were performed in-vitro to assess the growth of microorganisms and to investigate the effect of Punica granatum L. and Rhus coriaria L. water extracts on microbial attachment to orthodontic wires. These herbal extracts significantly decreased biofilm formation on orthodontic wires (16, 17).
In the current study, quantitative real-time PCR was carried out to assess the effect of Punica granatum L. flower and Rhus coriaria L. fruit water extracts on the transcriptional expression of S. mutans glycosyltransferase (gtfB, C and D) genes.
Experimental
Bacterial growth and extract treatment
For this study, S. mutans ATCC 35668 was purchased from the Industrial Fungi and Bacteria Collection Center (Tehran, Iran). Bacterial suspension was prepared using a pure culture of this bacterial strain, grown in brain heart infusion (BHI) broth (Merck, Germany) medium. The inoculated medium was incubated at 37˚C. After this time, broth culture was inoculated in 8.5 % saline solution to obtain an optical turbidity of 1 McFarland standard. In this study, the water extracts of Punica granatum L. flowers and Rhus coriaria L. fruit, prepared in our previous studies, were used (16, 17).The stock of extracts was prepared with a concentration of 4.68 mg/mL and dissolved in deionized water. Prepared solutions were filter sterilized through a 0.2 μm pore-size polycarbonate filter. Then, extract solutions in a final MBIC (0.39 mg/mL for Rhus coriaria L. and 6.125 mg/mL for Punica granatum L.) were added to BHI broth medium in sterile test tubes. These tubes were then inoculated with the bacterial suspension prepared equivalent to 1 McFarland. The tubes were incubated overnight.
RNA extraction and cDNA synthesis
Total RNA was extracted from planktonic cultures of non-treated (control) and 24 h treated S. mutans with MBIC concentrations of Rhus coriaria L. (0.39 mg/mL) and Punica granatum L. (6.125 mg/mL) (Table 1) (16, 17). Before extraction, bacterial cultures (three cultures for each group; n = 3) were mixed with 2 volumes of RNA protect solution (Qiagen, USA) in order to stabilize bacterial RNA. After 5 min of incubation at room temperature, bacterial cells were collected by centrifugation (5000 g, 10 min). The cells were disrupted with re-suspension of the pellets in TE buffer (10 mM Tris·Cl, 1 mM EDTA, pH 8.0) containing 1 mg/mL lysozyme (Sigma-Aldrich, Germany) and incubation at 37˚C for 20 min. Then, the bacterial total RNA was isolated and purified using High Pure RNA Isolation Kit (Roche, Germany) according to the manufacturer’s instructions. The extraction procedure contained on-column digestion step with RNase-free DNase I in order to eliminate the residual contaminating DNA. The RNA concentration was determined spectrophotometrically using the NanoDrop instrument (mySPEC, Austria). The quality and integrity of the RNAs were determined by measuring OD260/280 ratio and agarose gel electrophoresis of RNA respectively.
Table 1
Effect of Punica granatum L. flower and Rhous coriaria L. fruit water extracts on the formation (MBIC 50) of S. mutans biofilm on orthodontic wire (values were acquired in our previous studies)(16, 17).
| Test agent | MBC1 | MIC2 | MBIC3 |
|---|---|---|---|
| Punica granatum L. | 100 | 50 | 6.125 |
| Rhus coriaria L. | 6.125 | 1.56 | 0.39 |
[object Object]
[object Object]
[object Object]
In order to synthesize cDNA, 1 µg of isolated RNA was reverse transcribed using the High Capacity cDNA Reverse Transcription Kit (Applied Biosystems, USA) according to the manufacturer’s instructions in the presence of random primers on a PCR amplification machine (PeQlab, USA). For additional control for residual genomic DNA contamination, the cDNA synthesis reaction was carried out with each purified total RNA sample in the absence of reverse transcriptase enzyme and served as negative control.
Real-time quantitative PCR and gene expression analysis
In order to quantify the changes in gtfB, C and D mRNA gene expression in S. mutans exposed to the two understudy extracts in comparison with the control (non-treated S. mutans), real-time PCR was performed. All primers (gtf genes and housekeeping genes) for real-time PCR were controlled with NCBI Primer Blast software and obtained commercially from Takapuzist Company (Bioneer, Korea) (Table 2).
Table 2
Specific primers used for real-time PCR
| Gene | Sequence (5´→3´) | Product Size (bp) |
|---|---|---|
| gtfB | Forward: AGCAATGCAGCCAATCTACAAAT | 96 |
| gtfC | Forward: GGTTTAACGTCAAAATTAGCTGTATTAGC | 91 |
| gtfD | Forward: ACAGCAGACAGCAGCCAAGA | 94 |
| 16sRNA | Forward: CCTACGGGAGGCAGCAGTAG | 101 |
| recA | Forward: GCGTGCCTTGAAGTTTTATTCTTC | 75 |
The resulting cDNAs and negative controls (no-RT) were amplified using the SYBR®Green PCR Master Mix (Applied Biosystems, USA). The reaction mixture (20 µL) contained 10 µL of Master Mix, 200 ng of template cDNA (2µL) and 200 nM of forward and reverse primers placed in MicroAmp® Optical tube (Applied Biosystems, USA). Three repeats of the same reaction tubes were used for each test sample and three reaction tubes without cDNA template were used as negative controls (NTC) for each primer pair in order to check for DNA contamination.
Amplification and detection of specific products were performed on the ABI StepOne™ detection system (Applies Biosystems, USA) with the following thermal cycling conditions: initial denaturation at 95˚C for 10 min (holding stage), denaturation at 95˚C for 15seconds, followed by 40 cycles of annealing and extension at 60˚C for 1 min (cycling stage). All primer pairs were checked for primer dimer by adding a melt curve stage to the end of protocol.
Threshold cycle (Cт) values were determined, and relative expression levels were calculated by StepOne ™ software version 2.1 (Applied Biosystems, USA) according to the comparative Cт (ΔΔCт) method. The quantities of cDNA for gtfB, gtfC, and gtfD genes were normalized to that of cDNA synthesized from recA gene in the same sample. These values were then compared to those obtained from the non-treated control to determine the change in gtf gene expression level in each test sample.
Statistical analysis
All real-time PCR assays for three target genes and two target samples were performed in triplicate at the same time and reproduced at least three separate experiments. The differences between the experimental group and the non-treated control group were analyzed by GraphPad Prism (version 6.01, USA). The data from fluorescent intensities were assessed by one-way analysis of variance (ANOVA) in the Tukey-Kramer post deviation test for all pairs. A P value < 0.05 was considered statistically significant.
Results
In order to determine the effect of Rhus coriaria L. fruit (sumac) and Punica granatum L. (pomegranate) flower (Golnar) water extracts on the virulence factors associated with attachment and biofilm formation by S. mutans, we performed real-time PCR to quantify the abundance of gtfB, gtfC and gtfD specific mRNA expression.
Interestingly, we found that expression of 16sRNA gene (internal control) decreased by understudy water extracts (data not shown). According to these findings, recA was selected as internal control for real-time PCR reactions. Melt curves revealed the absence of non-specific products in all amplification reactions.
The analysis revealed that the gtf genes were more abundantly expressed in non-treated cultures. Significant differences were observed in gtfB, gtfC and gtfD mRNA transcripts among different treatment groups.The mRNA expression of gtfB, C, and D was significantly down-regulated when S. mutans was cultured with sub-MIC (MIBC) concentrations of extracts.
Water extracts of Punica granatum L. flower and Rhus coriaria L. fruit at MBIC (sub-MIC) level (6.125 and 0.39 mg/mL, respectively) significantly inhibited the gtfB, C and D gene expression by 85.3 ± 7.5%, 33.3 ± 6.4% and 25 ± 14% respectively for Punica granatum L. extract (Figure 1-A, p < 0.05), 73.4 ± 7.3%, 93.8 ± 2.7%, and 59.3 ± 9.8% respectively for Rhus coriaria L. extract (Figure1-B, P < 0.05) compared to the non-treated control.
Figure 2 shows the comparison effects of two studied extracts on gtf gene expression. The effect of Rhus coriaria L. extract in MBIC concentration on down-regulation of gtfC and gtfD was more remarkable than that of Punica granatum L. extract in its MBIC concentration. The mRNA expression of gtfC and gtfD was significantly higher in S. mutans after treatment with Punica granatum extract, 10.8-fold, and 1.8-fold respectively compared to Rhus coriaria L. extract (P < 0.05).
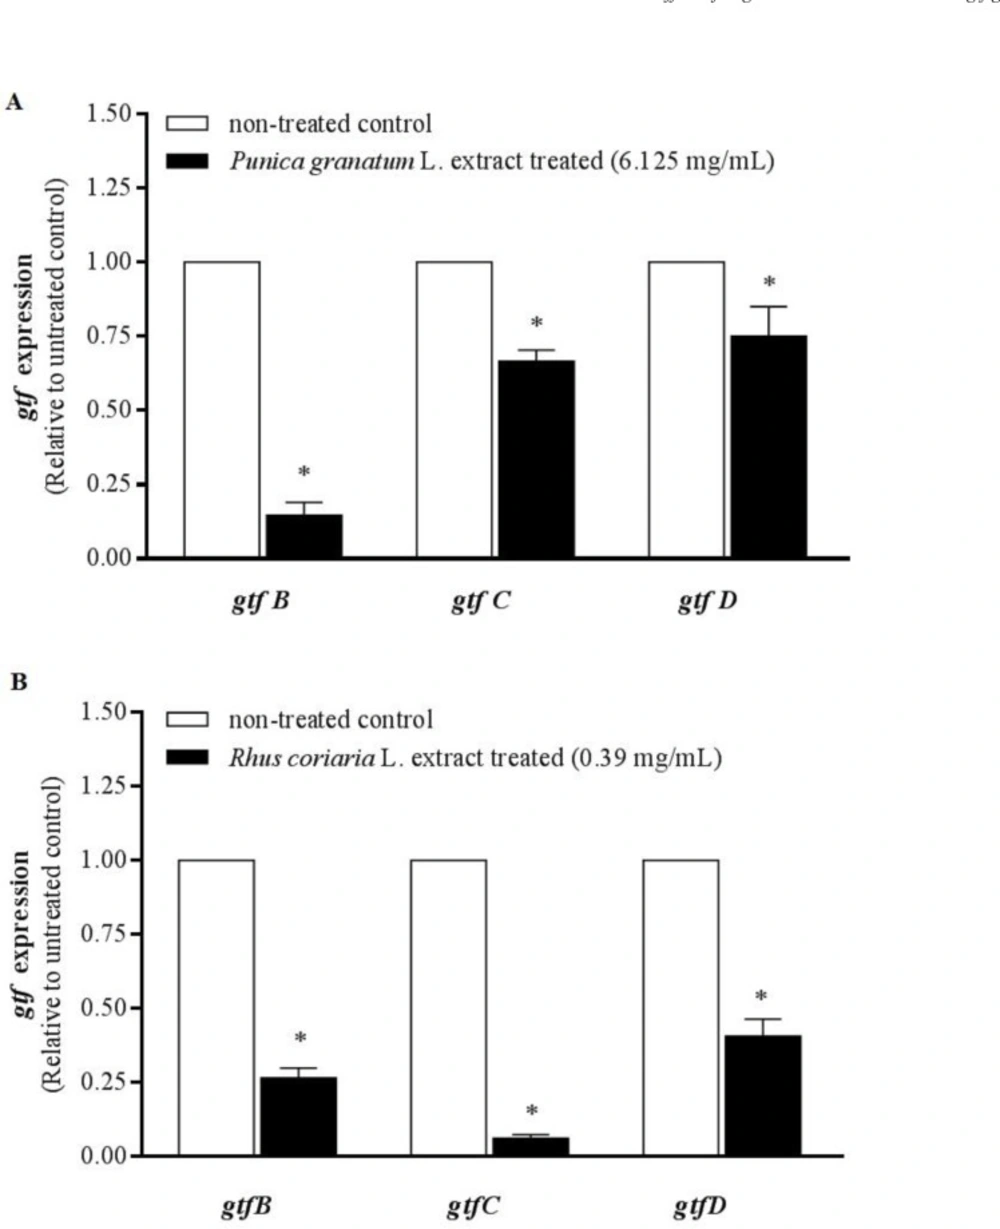
Figure 1
Real-time PCR analysis of gtfB, gtfC, and gtfD gene expression in S. mutans growing in presence of 6.125 mg/mL Punica granatum L. flower (A) and 0.39 mg/mL Rhus coriaria L. fruit (B) water extracts. The mRNA levels of each gene was normalized to that of recA (internal control) and then expression in treated cells was compared to that in non-treated control (value of 1). The results are presented as mean ± SE of three independent experiments (n = 3, * P < 0. 05
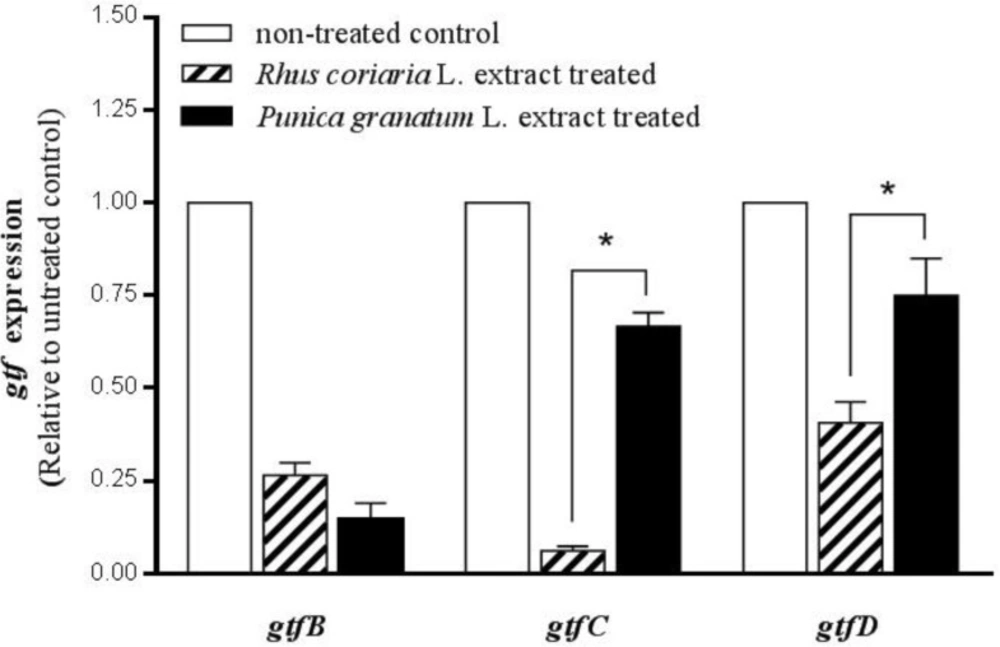
Figure 2
Comparison effects of Punica granatum L. flower and Rhus coriaria L. fruit water extracts on gtfB, gtfC, and gtfD gene expression. The planktonic cultures of S. mutans were treated with MBIC (sub-MIC) level of water extracts (6.125 mg/mL for Punica granatum L. and 0.39 mg/mL for Rhus coriaria L.). The expression rate in non-treated cultures (control) was considered to be 1. Stars (*) in-between the columns indicate significant differences (n-fold) between the groups (P < 0.05
Discussion
Dental plaque is a complex bacterial biofilm that develops naturally on the tooth's smooth surface. Many species of bacteria especially Streptococcus mutans, fusobacterium, and actinobacteria are involved in the formation of biofilm. S. mutans, the primary constituent of dental plaque, synthesizes extracellular adherent glucans from dietary sucrose via GTFs and thus, promotes the accumulation and colonization of oral bacteria on teeth surfaces. Bacterial attachment is an important initial step towards the subsequent formation of mature biofilm. Therefore, compounds with the potential of inhibiting the initial attachment of S. mutans to the surface can efficiently prevent the formation of biofilm and maturation of dental plaque (18). Initial prevention is easier and more important than subsequent mechanical treatments (e.g scaling and root planning) especially in patients with fixed orthodontic appliances.
In our previous studies, we reported that Punica granatum L. flower and Rhus coriaria L. fruit water extracts inhibited S. mutans biofilm formation in-vitro at MBICs of 6.125 mg/mL and 0.39 mg/mL, respectively. (16, 17).
In the current study, we aimed to confirm the inhibitory effects of Punica granatum L. and Rhus coriaria L. extracts on dental biofilm formation by analyzing gtf gene expression in S. mutans.
Several studies have shown that some herbal extracts have inhibitory effects on biofilm formation by gtf family gene suppression. For example, one study showed that Tea catechin epigallocatechin gallate inhibited S. mutans biofilm formation by suppressing gtfB, C and Dgenes at sub-MIC levels (19)
Another study indicated that the phenolic fraction from the pomace of Vitis coignetia may play an important role in prevention of adherence of S. mutans and has a medicinal potential for reducing dental caries when used as a food additive (20).
Also, significant inhibition of GTFs activity by Nidus vespae extract revealed its potential as a promising natural product for prevention of dental caries (21).
In the current study, real time PCR assay revealed significant decrease in gtfB, gtfC and gtfD expression following Punica granatum L. flower and Rhus coriaria L. fruit water extract treatments of S. mutans. Based on our findings, both extracts at sub-lethal concentrations are capable of decreasing biofilm formation by S. mutans via down-regulating all three gtf genes without necessarily suppressing the growth of oral bacteria. These suppressing effects were more remarkable for Rhus coriaria L. extract in comparison with Punica granatum L. extract.
In conclusion, Punica granatum L. flower and Rhus coriaria L. fruit water extracts (especially Rhus coriaria L.) are promising natural antiplaque agents and may be used as food additives or in the formulation of dental care products (e.g. mouth washes and toothpastes).