Cancer treatment is still an ongoing field of study for many of cancer researchers and one of the important issues in this area is reaching to better understanding of biology of the tumor cells to be equipped with more complete knowledge for improving more effective treatments. It has been widely believed that amino acids play a crucial role in cancer cell development (
7).
In-vitro cancer studies with cancer cell lines provide the cells with the required amino acid supply with adding fetal bovine serum, which also contains necessary growth signals for the cells to proliferate and survive. Serum restriction, on the other hand, has been a protocol for normal cell arrest in G
1 phase of the cycle, a phenomenon called quiescence. G
1-S transition has been known to need continuous stimulation by amino acids (
8). In fact, Arthur B. Pardeecould for the first time explain the existence of restriction point(commonly known as R point) in G
1, when the cells would check their environment for sufficient nutrients and growth signals to allow them to precede the cycle (
9). Furthermore, high cell density and exposure to some chemicals have also been considered as contributing factors for quiescence induction (
10,
11). However, cancer cells’ behavior is thought to be different from normal ones. Within normal to cancer cell transformation, various capabilities are acquired including limitless proliferation potential, avoiding apoptosis and resisting death, metastasis, insensitivity to anti-growth signals and etc (
12,
13). Therefore, in suboptimal environmental conditions, cancer cells may have different behavior profiles compared to normal cells.
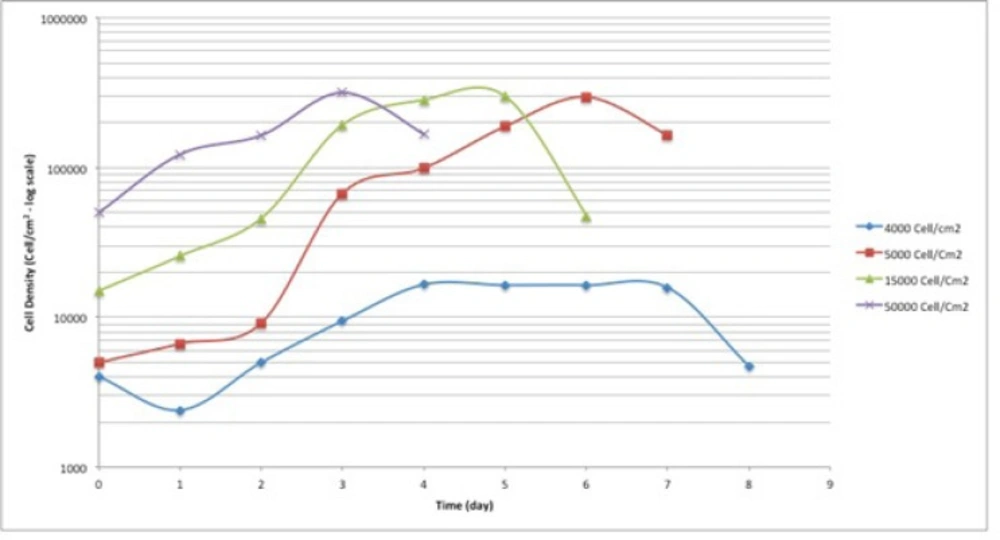
Cell seeding density calculation for A549 cell line. The cells were seeded at 4 different seeding densities; 4000, 5000, 15000 and 20000 cell/cm2.
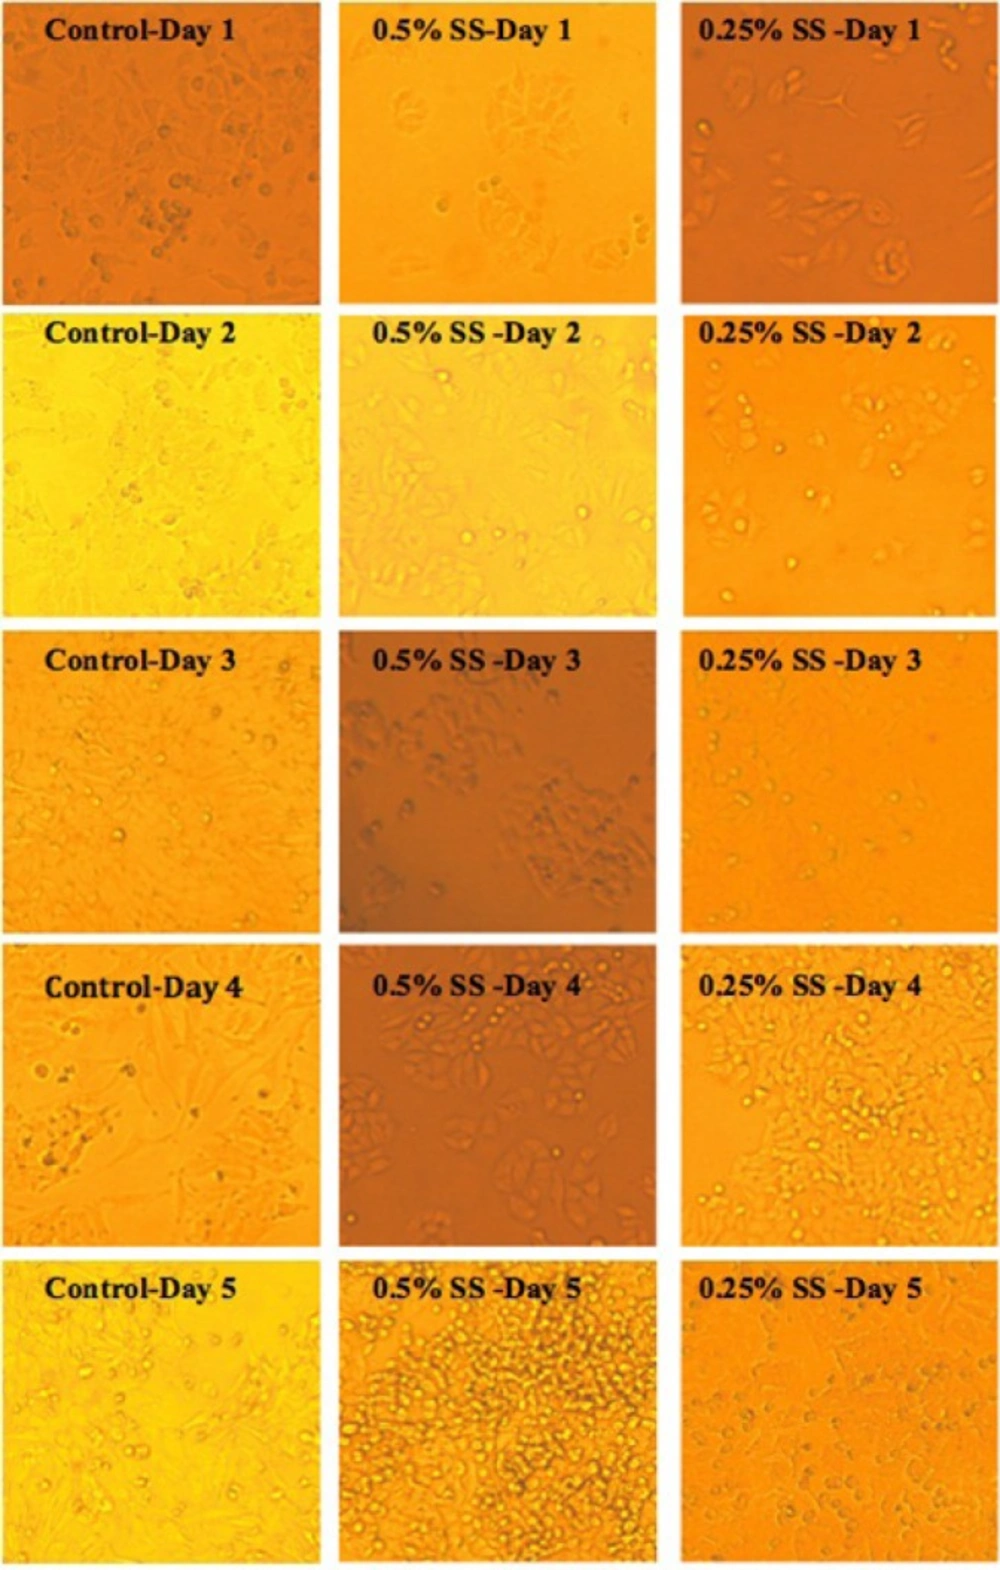
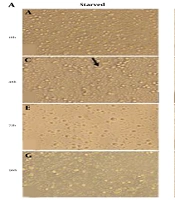
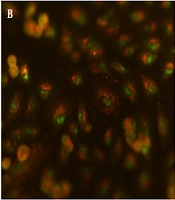
Morphological study on A549 cell line, following exposure to 10% serum (control), and starved stated at 0.5% and 0.25% serum. In the images below, SS indicates “Serum Starvation”.
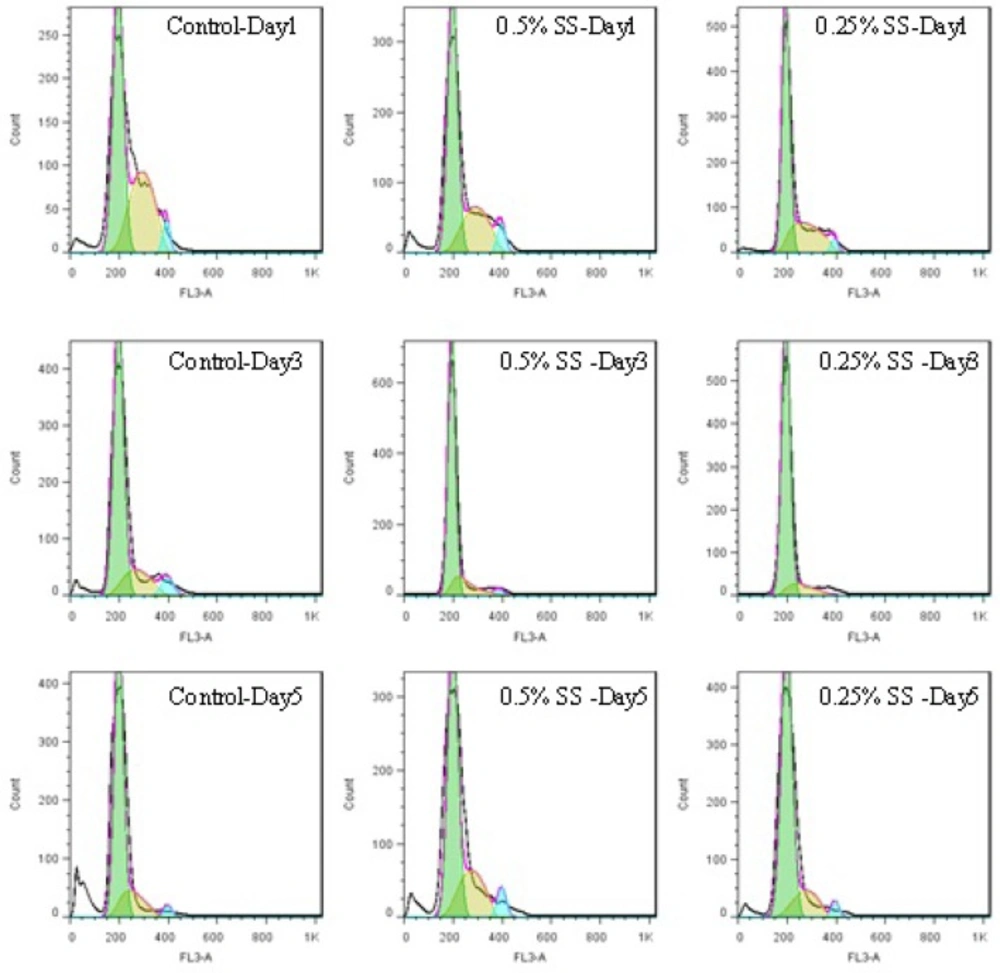
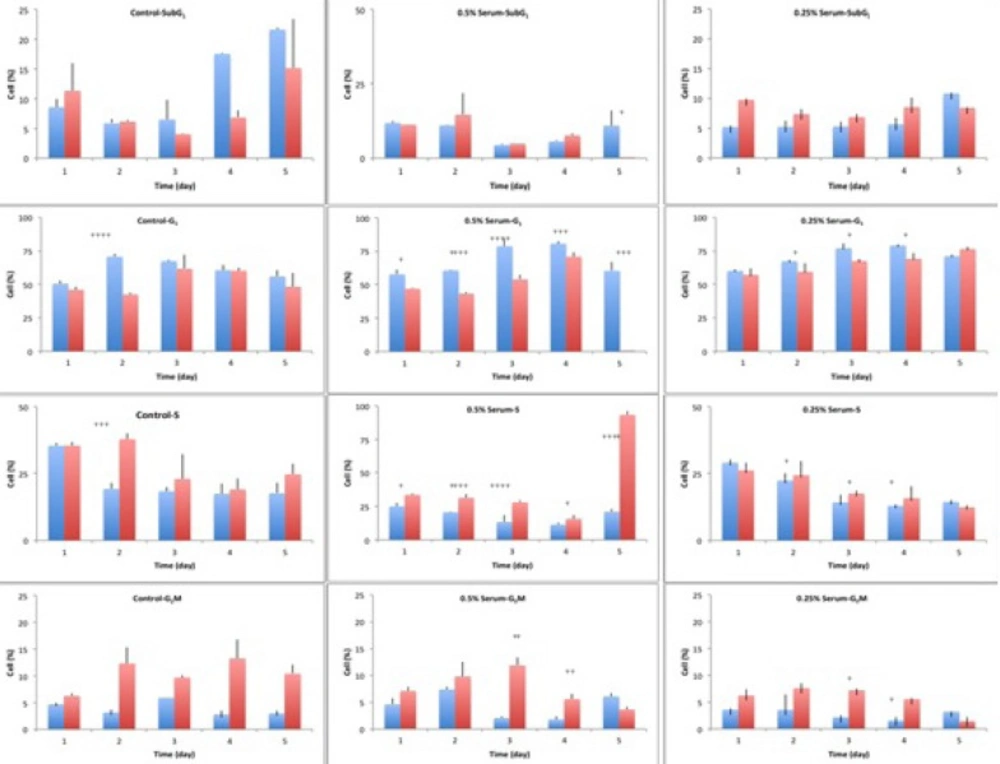
Histograms of cell cycle of A549 cell line, in a 5-day study. The cells were starved for 1 to 5 days in media containing 0.25% and 0.5% serum, while 10% serum was considered as control. In each day of the study, the cycle of the cells was analyzed using flow cytometry
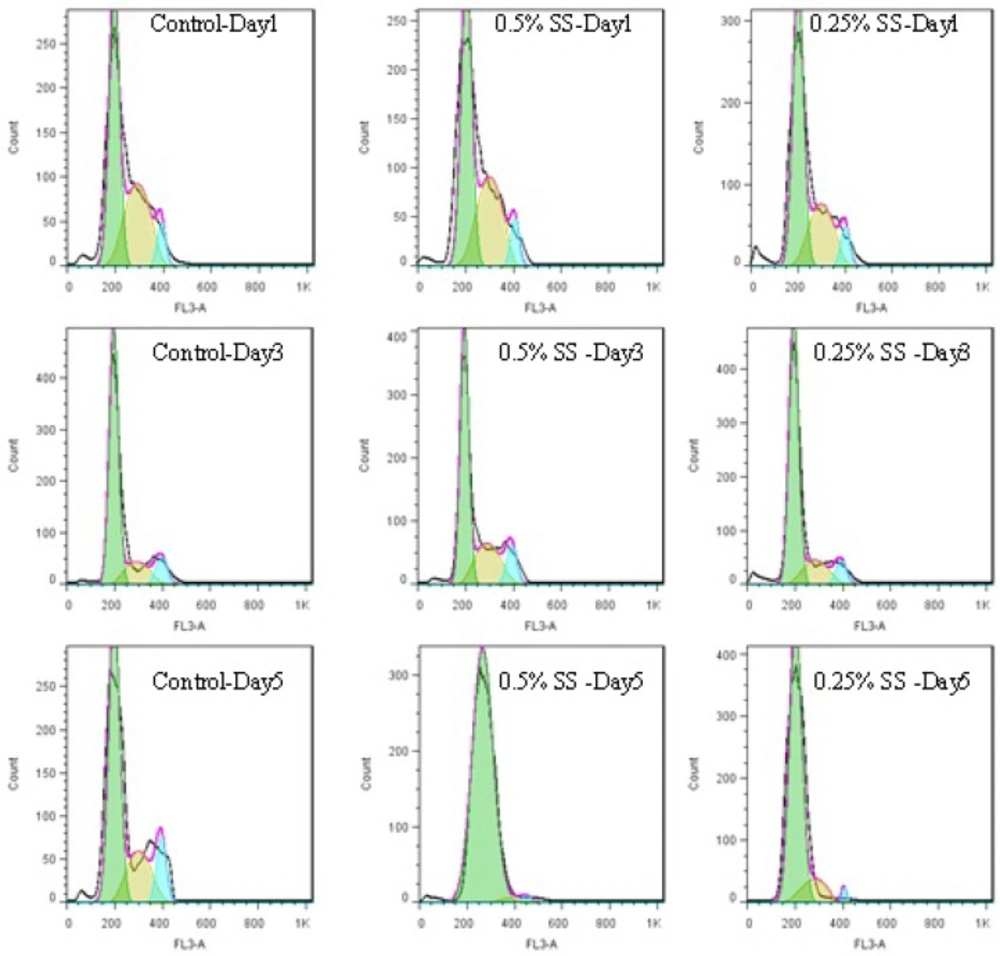
Histograms of cell cycle of A549 cell line, released after starvation in a 5-day study. The cells were starved for 1 to 5 days in media containing 0.25% and 0.5% serum, while 10% serum was considered as control. In each day of the study, the cell were released in media containing 10% serum
Cell cycle analysis of A549 cells, in a 5-day study, at starvation and release status. The cells were starved for 1 to 6 days in media containing 0%, 0.25% and 0.5% serum, while 10% serum was considered as control. In each day of the study, the cells were released in media containing 10% serum, for 24 hours. The cycle of the cells was analyzed using flow cytometry. In each graph, blue columns indicate starvation and the red columns show the release status of the respective cell, after 24 hours of release.The significance level was considered as p<0.05
In the current study, the cell cycle changes of human lung adenocarcinoma cell line, A549, to harsh environmental conditions; in terms of serum restriction was investigated at 0.5% and 0.25% serum. Based on the results of cell seeding density calculations, the cells were seeded at the density of 4000 cells/cm
2. At this seeding density, the cells had the longest plateau phase, which was suitable for long-term study (
Figure 1.). Therefore, the starting point of the experiment was the 4
th day after seeding the cells. The cells were at plateau phase to mimic the cells’ state deep inside the central parts of a tumor, in terms of cell density.
Control cells with sufficient access to optimal environmental conditions go on their natural cycle. The histograms of cells cycle are illustrated in
Figure 3. Based on the results illustrated in
Table 1. sub-G
1 control cells populationdo not make statistically significant changes in the first 3 days of the study, while the sub-G
1populationincreaseson the last 2 days of the study, as the cells enter their death phase. Control G
1 cells’ population is increased by day 2 of the study (
p<0.0001) while the S phase cells population decreases at the same time. From day 3 onwards, as the cells start to slowly die, the G
1 population starts gradual decreasing and sub-G
1 increases. Knowing that the G
2/M cells’ population also do not change statistically, it is possible to conclude that the cells are arrested at G
1-S transition on day 2 of the study. The possible explanation for this observation might be confluency, asconfluency had been shown to play a role in G
1 accumulation in normal cells (
14). It is possible that some similar mechanisms play role in the observed G
1 accumulation in this cancer cell line. It can be explained that the cells accumulate in G
1, however, after day 2 of the study, G
1 arrested cells enter the death phase and sub-G
1 apoptotic status. Confluent A549 colonies are observable in
Figure 2.
For the test cells grown in 0.5% and 0.25% FBS, this arrest happens on day 3 (
p<0.0001). At 0.5% serum starvation, G
1 accumulation lasts for 2 days, while at 0.25% serum starvation, no statistically significant changes in cell population of different phases is detected. It seems that the harsher the conditions become, the more resistant the cells react. The other evidence to this statement is the lack of sub-G
1 increase in starved status cells. Furthermore, the morphological studies show that along with the starvation period, by the time control cells pass the final days of their growth curve, starved cells are making denser colonies. In fact this observation is in accordance with other evidences that state fasting imposes further tumor cell proliferation(
15).
Exchanging the cells media with media completed with 10% FBS for 24 h, could cause decreasing the cells population in G
1 phase and increasing the cells’ population in S and G
2M phases ( 4. and 5.). In other words, the cells were released from the arrest. The general pattern of release in starved cells shows growth factor dependency of the cells to go on their cycle. Therefore, it is possible that some mechanisms similar to R-point (
8) in normal cells exist in cancer cells too, which sensitize them to the environmental conditions. Releasing A549 cells with media containing 10% serum showed that the damage to the remaining cells was not irreversible with regard to the cell cycle, but the cells could still go on through their cycle.
This shift in cells accumulation happened only on day 2 for the control cells. Test cells grown in 0.5% FBS showed better release pattern compared to cells grown in 0.25% serum. The possible reason for this might be explained by Lum’s research. He believed that stress induced on the cells within the starvation period leaves the cells requiring longer time for recovery and for re-synthesis of intracellular organelles (
16). As 0.25% starved cells underwent harsher environmental conditions, it is possible that they require longer time for a better release.
One of the interesting observations in this study was that despite the metabolic stress induced on the cells and the observed G
1 accumulation, no statistically significant change happened in the sub-G
1 population, as a marker of apoptotic cells. There are many compounds that induce G
1/G
0 arrest in A549 cell line and apoptosis arises along with the arrest, even in short term exposure to the compounds as long as 24 to 72 h (
18). The levels of various intracellular molecules change based on the exposed compound, including decrease in levels of cdc2 and cdc4, cdk2, cdk4, cdk6 and cyclin-D1 and cyclin-D3, increase in the level of p27
KIP1, Rb2/p130 and also the activation of apoptosis inducing caspases and biomolecules (
18). Their observations approve the G
1 arrest and the observed increased sub-G
1 population. However, the results of our study basically lack such increase in sub-G
1populationin starved cells.
In general, there are some imaginable explanations for the observed effects; autophagy is one of the probable subjects that needs to be studied in such starved cells. Since amino acid starvation is known to trigger autophagy (
17), a pathway that the cells use to degrade their intracellular organelles as a source of energy for longer survival (
18). Therefore such cells would not go through apoptosis, unless autophagy pathways are defected.
In conclusion, to address one of the main questions about the survival and recurrence of cancer tumor cells even after intensive chemotherapy programs that include anti-angiogenesis agents, we have studied the adaptability of the human lung adenocaarcinoma cell line, A549, to harsh environmental conditions in this study. We assessed the impact of starvation on this cancer cell line. As described in the results and discussion sections, starvation does not seem to have a very dramatic effect on the cellular survival, as the cells react in a very complex way. We have shown good cell survival and cell functional abilities even after 5 days of starvation. Our results have confirmed recurrence of cellular cycling after the release of cells from starvation-imposed harsh condition. This may help explain aggressive re-growth of cancers after initial response to chemotherapy combined with anti-angiogenic agents, which restrict cells’ access to sufficient nutrients.