Chemicals and reagents
Baicalin was provided by Nanjing ZeLang Medical Technology Co., Ltd. in China, and the determined purity was 98.12%, with Lot number ZL101005. DMEM/HIGH GLUCOSE was obtained from Thermo Fisher Scientific Inc. Domestic superior grade fetal bovine serum and Annexin V-FITC apoptosis detection kit were purchased from Nanjing KeyGen Biotech.Co., Ltd. in China. MTT cell proliferation and cytotoxicity assay Kit, Caspase-3 activity assay Kit, BCA protein assay kit, Dimethyl sulfoxide(DMSO), Trypsin-EDTA solution, Protein molecular weight marker, Cell lysis buffer for Western and IP, HRP-labeled goat anti-rabbit IgG (H+L) and PVDF membrane were purchased from Beyotime Institute of Biotechnology in China, while rabbit anti-Bcl-2, anti-Bax, anti-Fas, anti-FasL, anti-Caspase-8 and β-actin were obtained from Beijing biosynthesis biotechnology Co., Ltd. in China. All other chemicals and reagents used were of analytical grade.
Cell culture
HeLa cells obtained from Tumor Hospital of the Chinese Academy of Medical Sciences were cultured in DMEM containing 10% fetal bovine serum(FBS), 100 u/mL penicillin and 100 u/mL streptomycin in a humidified incubator at 37 °C under a 5% CO2 atmosphere. Cells were passaged every two to three days.
Drug preparation
Baicalin was dissolved in 100% DMSO at a concentration of 60 mg/mL as a stock solution and stored at 4 °C, it was diluted with DMEM medium before each experiment. The final concentrations of DMSO were less than 0.1% in all baicalin groups.
MTT assay
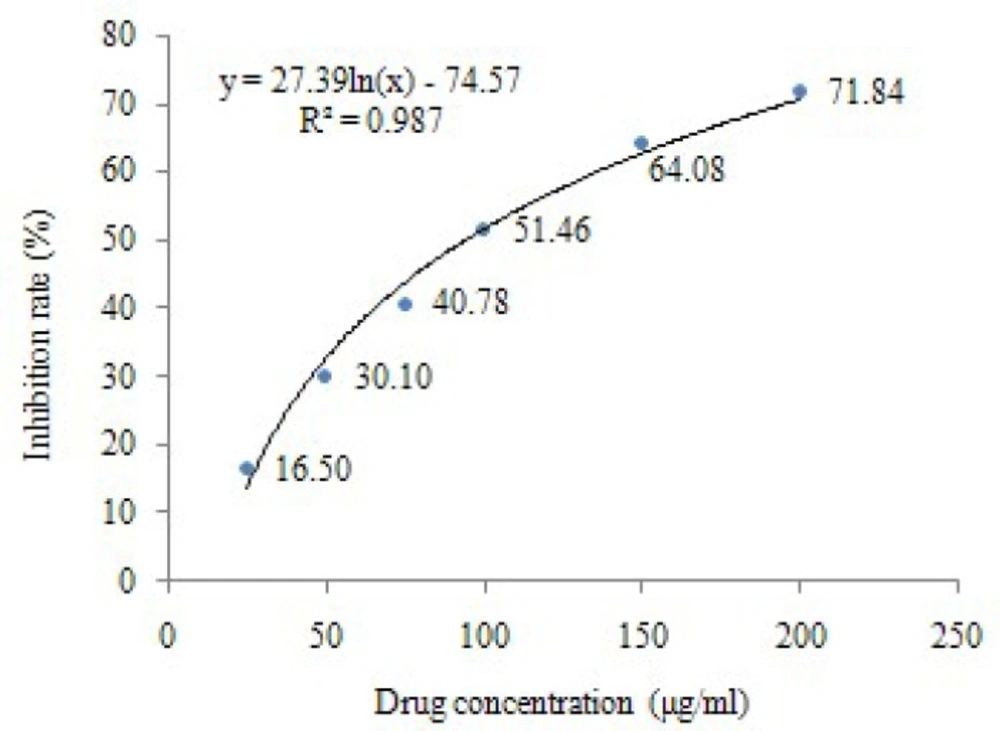
The effects of baicalin on HeLa cells viability were determined by a colorimetric MTT assay. HeLa cells were cultured in DMEM until the mid exponential phase, and then seeded in a 96-well plate at a density of 5×10⁴/mL per well in 100 μL of medium. After incubation for 24 h, the cells were exposed to baicalin (25, 50, 75, 100, 150, 200 μg/mL) or 10 μL DMEM (control) for 24 h under an atmosphere of 5% CO2 and 37 °C. After treatment, 10 μL of 5 mg/mL MTT was added, and the cells were incubated for 4 h at 37 °C. Then 100 μL Formanzan was added to dissolve the formazan crystals for 4 h, and the spectrophotometric absorbance at 570 nm was measured using a microplate reader .The inhibition rate was calculated as follows:
Inhibition rate (IR) (%) = (1–ODtreated/ODcontrol)×100%
IC50 value was calculated by regression curve of IR at different concentrations.
Cell scratch method
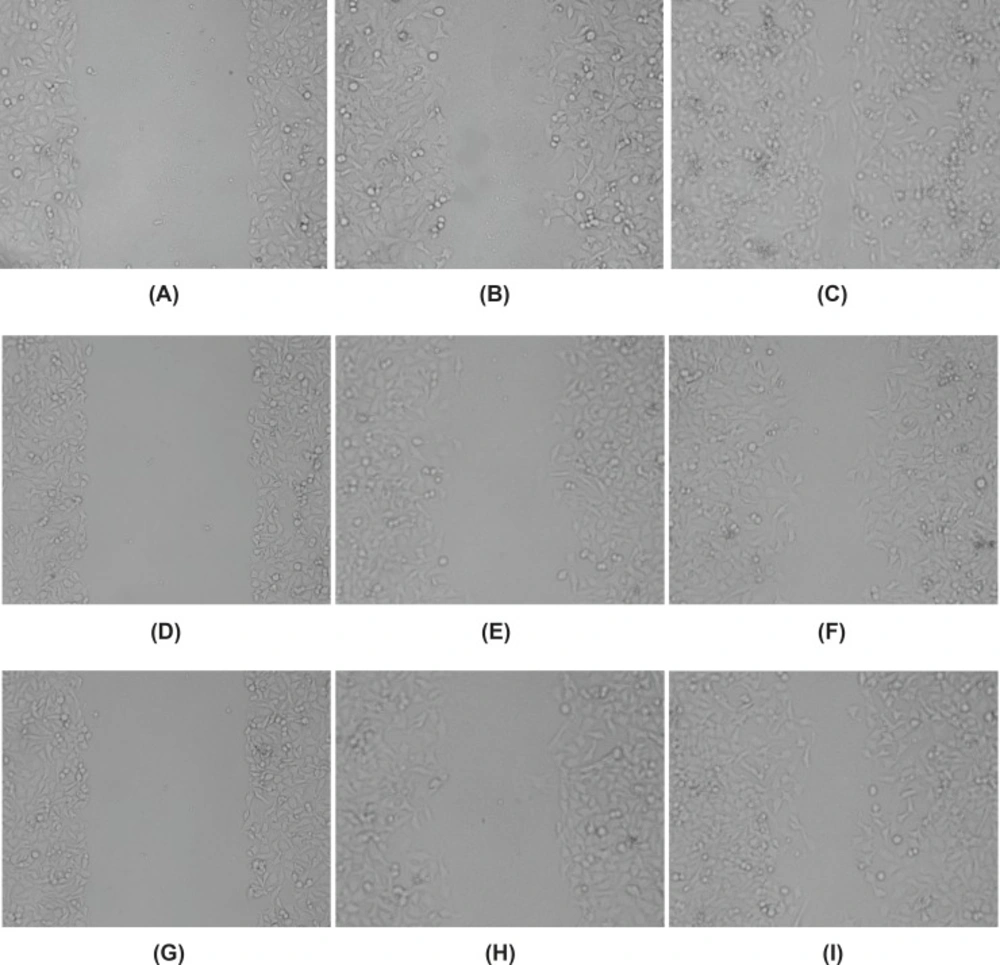
HeLa cells were seeded into six-well plates; straight lines were drawn by a pipette tip on the bottom of culture plate when cells spread to 80%-90% of the culture plate. Cells were washed with PBS to remove detached cells. Then cells were
separately cultured in complete medium containing high dose (100 μg/mL) and low dose (50 μg/mL) baicalin, whereas cells of control group were incubated in complete medium. In the same multiple, cell migration into the scratch surface of
Mark Points was observed by microscopy at 0-, 12-, and 24-h time points respectively.
Edge distances of scratches were measured in photos and analyzed by computer software. The migration distance ratio was calculated as follows:
Migration distance ratio (%) = (1 – scratch distances at 24-h time point / scratch distances at 0-h time point)×100%
Cell morphological assessment byinverted microscopy
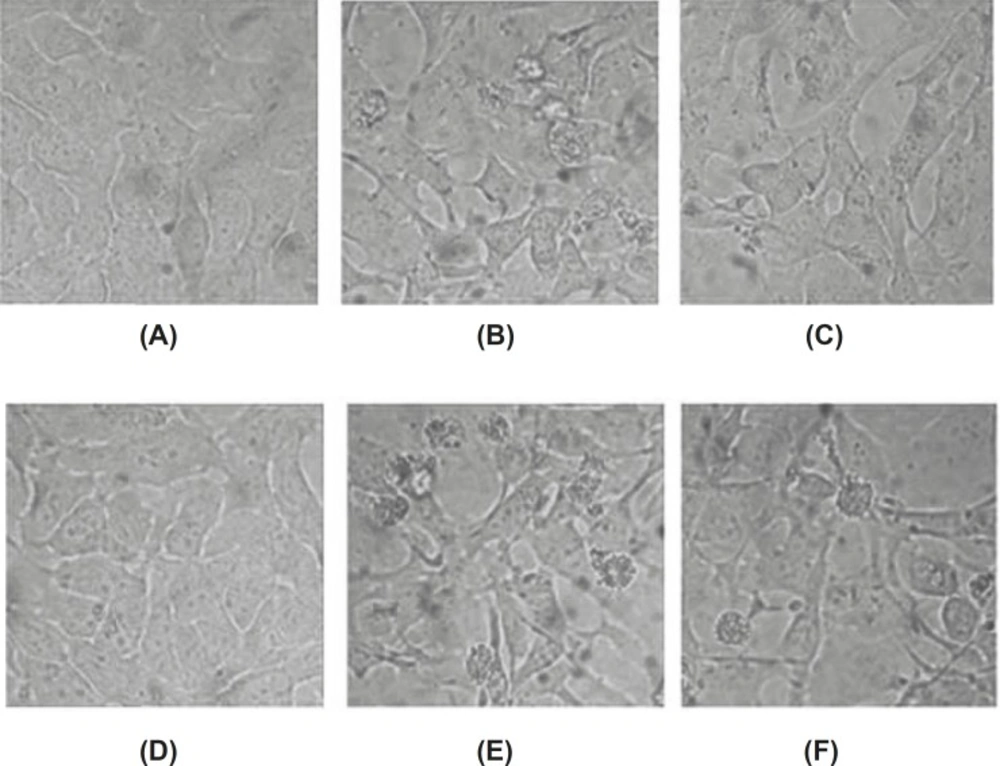
HeLa cells in the logarithmic phase were seeded in a 6-well plate. After incubation for 24 h, high dose (100 μg/mL) and low-dose (50 μg/mL) of baicalin were added into treated group respectively, while the
samevolume of DMEM medium was added into control group. After treatment for 24 h and 48 h, cell morphology was viewed by inverted microscopy.
Cell morphological observation by TEM
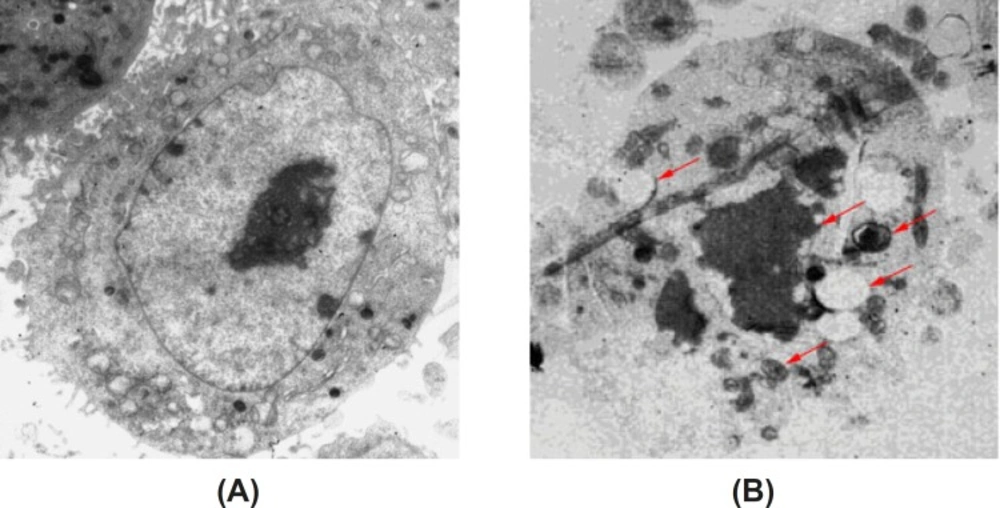
HeLa cells were cultured for 24 h, high dose (100 μg/mL) and low-dose (50 μg/mL) of baicalin, and the
samevolume of DMEM medium were separately added into treated group and control group, cultured continually at 37
oC under a 5% CO
2 atmosphere. After treatment of baicalin for 48 h, cells were collected and fixed in 2.5% glutaraldehyde for 12 h at 4 °C, then fixed in
1% osmium tetroxide, dehydrated with graded concentrations of acetone and embedded in epoxy resin. Ultrathin sections were cut and stained with uranyl acetate for 30 min and then with lead citrate for 20 min, finally ultrastructure of apoptotic cells was examined by TEM (transmission electron microscope).
Annexin V-FITC/PI flow cytometric analysis
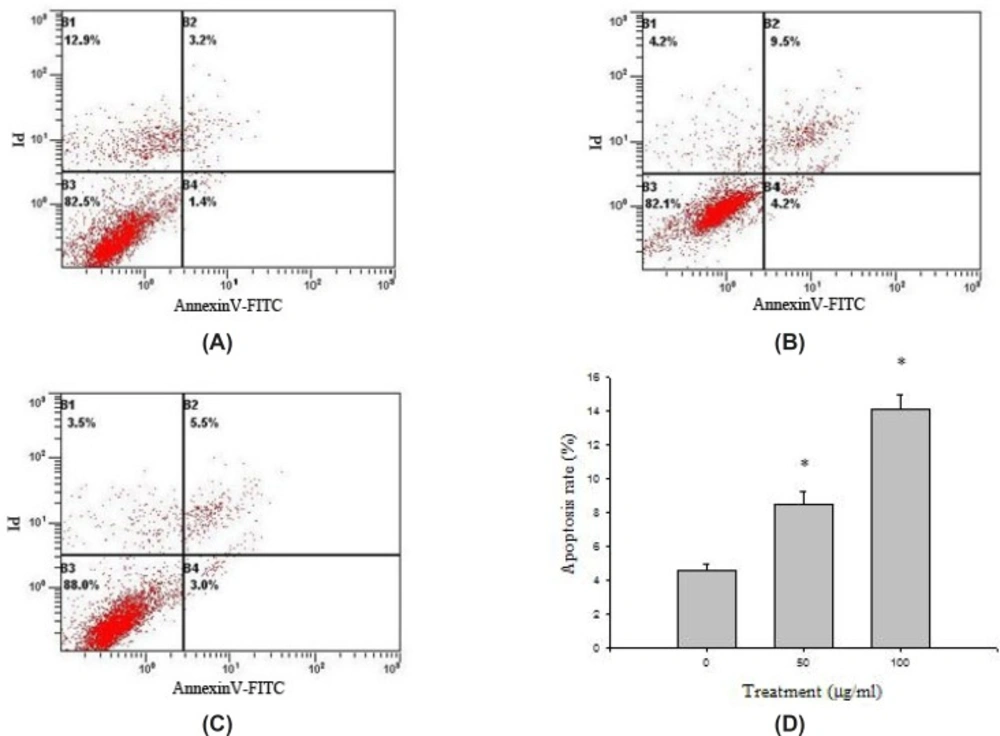
HeLa cells were treated with high and low dose baicalin for 48 h, then harvested and washed twice with PBS. 300 mesh strainers for filtration was used to obtain single cell suspension. 1×10⁶ cells were counted and resuspended in 500 μL binding buffer, then incubated with 5 μL Annexin V-FITC and 5 μL PI for 10 min in the dark. HeLa cells were assayed by FACSCalibur flow cytometer, and cell apoptotic rate was obtained with ModFIT software.
Western blotanalysis
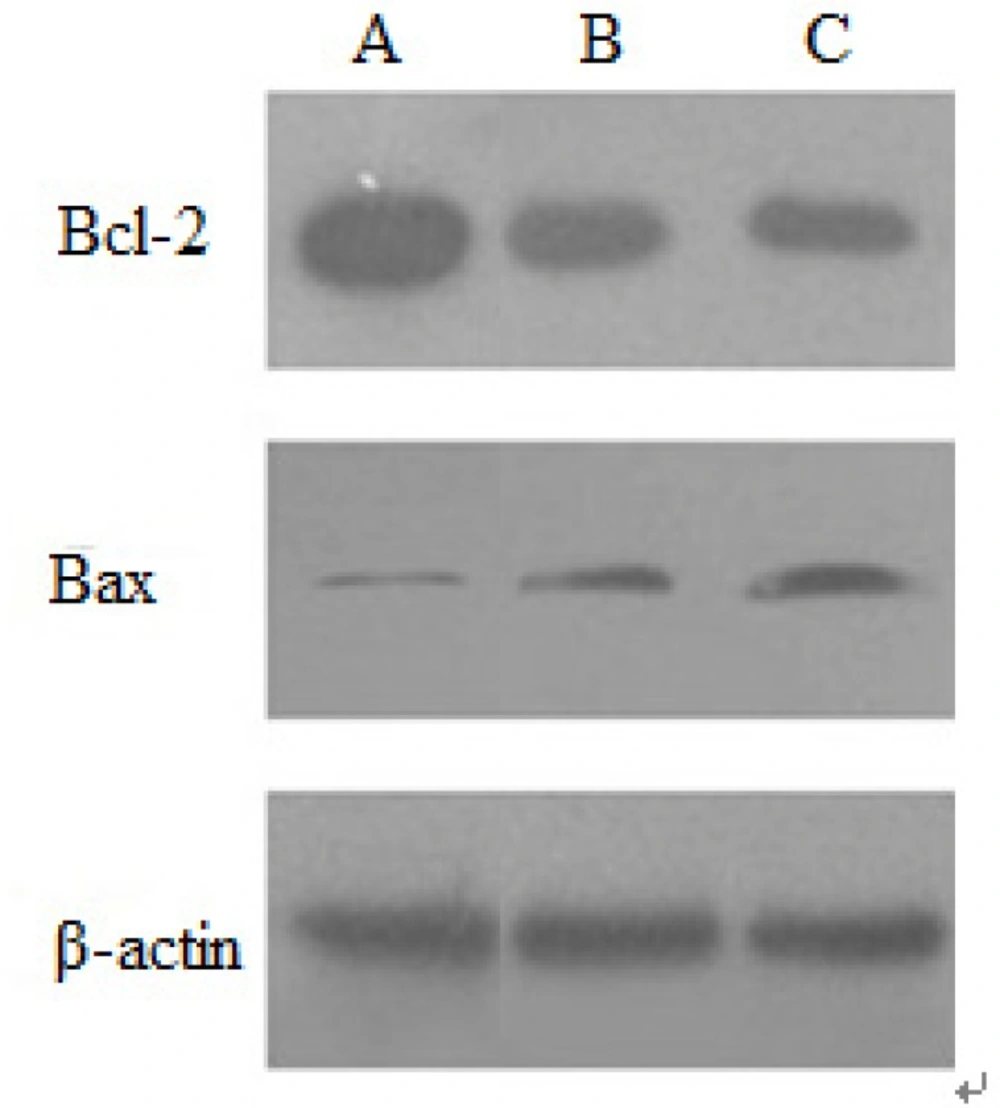
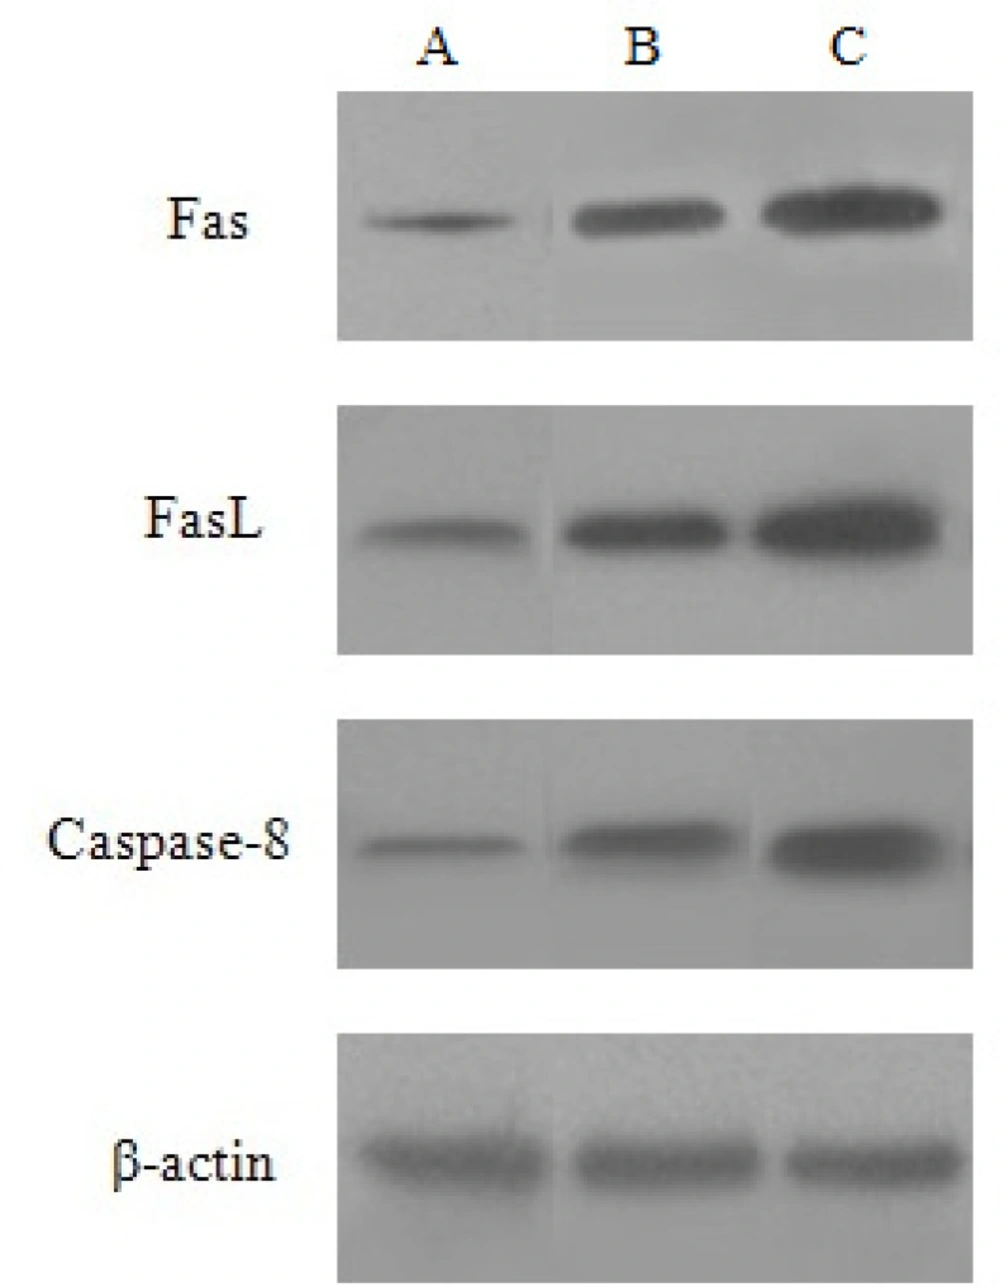
The expression of apoptosis-associated genes was investigated by Western blot analysis. HeLa cells(1×10⁶/mL) were seeded in a plate, then cultured for 24 h. After treatment with baicalin for 48 h, HeLa cells were collected and washed twice with cold PBS. The cells were then lysed in lysis buffer for Western and IP. Protein concentrations were quantified using BCA protein detection assay kits. Briefly, equal amounts of proteins were separated by SDSPAGE and transferred to a PVDF membrane. After blocking with 5% nonfat skim milk, the membrane was incubated overnight with the primary antibodies, and then with the secondary antibodies. Anti-rabbit Bcl-2, Bax, Fas, FasL, Caspase-8 and β-actin antibodies were used as the primary antibodies with horseradish peroxidase (HRP)-conjugated goat anti-rabbit IgG as secondary antibodies. After washing, proteins were detected with Western blot chemiluminescence assay, and the images were obtained by the TMW type gel imaging system.
Caspase-3 activity assay
The activation of caspase-3 was detected by spectrophotometric method. 5×10⁶ cells were collected from the HeLa cells treated with high and low dose of baicalin for 12 h. Then cold lysis buffer was added into cells, and cells were lysed on ice, oscillated in vortex oscillator and centrifuged at 10,000 rpm for 1 min. After that the supernatant was drew to another centrifuge tube, protein concentrations were determined by bicinchoninic acid (BCA) method. 50 μL 2×reaction buffer and 5 μL Caspase-3 substrate were added into 50 μL cell lysis supernatant containing 200 μg protein, while 50 μL lysis buffer and 50 μL 2×reaction buffer were added into the control group. After culture at 37 °C for 4 h in dark, the absorbance at 450 nm was measured using a microplate reader, and caspase-3 activity was represented by the value of ODtreated/ODcontrol.
Statistical analysis
Statistical analyses were performed using SPSS13.0 statistical software. Data were analyzed by one-way analysis of variance; differences between groups were tested by unpaired Student’s t-tests and expressed as the mean ± SD. A difference at: p <0.05 was considered to be statistically significant.