Voltammetric behavior of diclofenac
The electrochemical behavior of diclofenac was investigated at the Pt disc electrode in anhydrous acetonitrile solution containing 0.1 M TBAClO
4 as the supporting electrolyte by using cyclic voltammetry (CV).
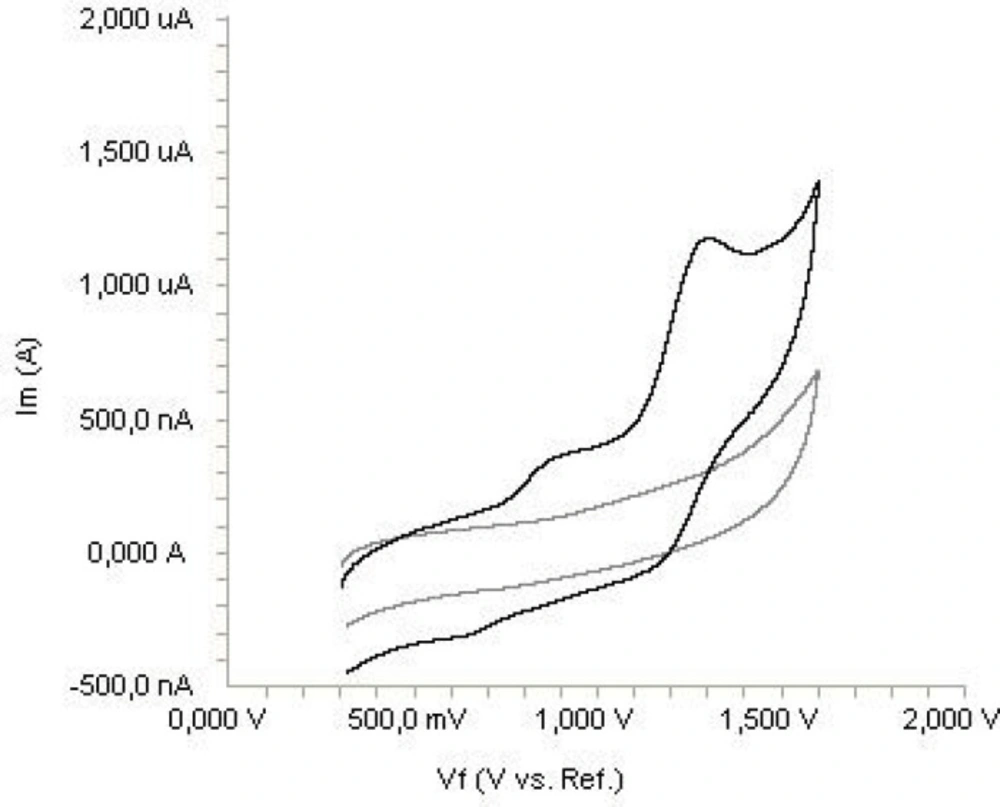
Figure 2 shows a typical cyclic voltammogram of 20 μg mL
-1 diclofenac recorded under these conditions for the scan rate of 0.2 V s
-1. In the anodic sweep, two oxidation peaks are seen at about potentials of 0.87 and 1.27 V, respectively.
Cyclic voltammogram for the oxidation of 20 μg mL-1 diclofenac in acetonitrile containing 0.1 M TBAClO4 at Pt disk electrode, scan rate: 0.2 V s-1.
In order to gain a deeper insight into the voltammetric waves, the effect of scan rate on the anodic peak currents (
İm) and peak potentials (E
p) was studied in the range of 0.01-1 V s
-1 of the potential scan rates in acetonitrile solution containing 20 μg mL
-1 concentration of diclofenac (
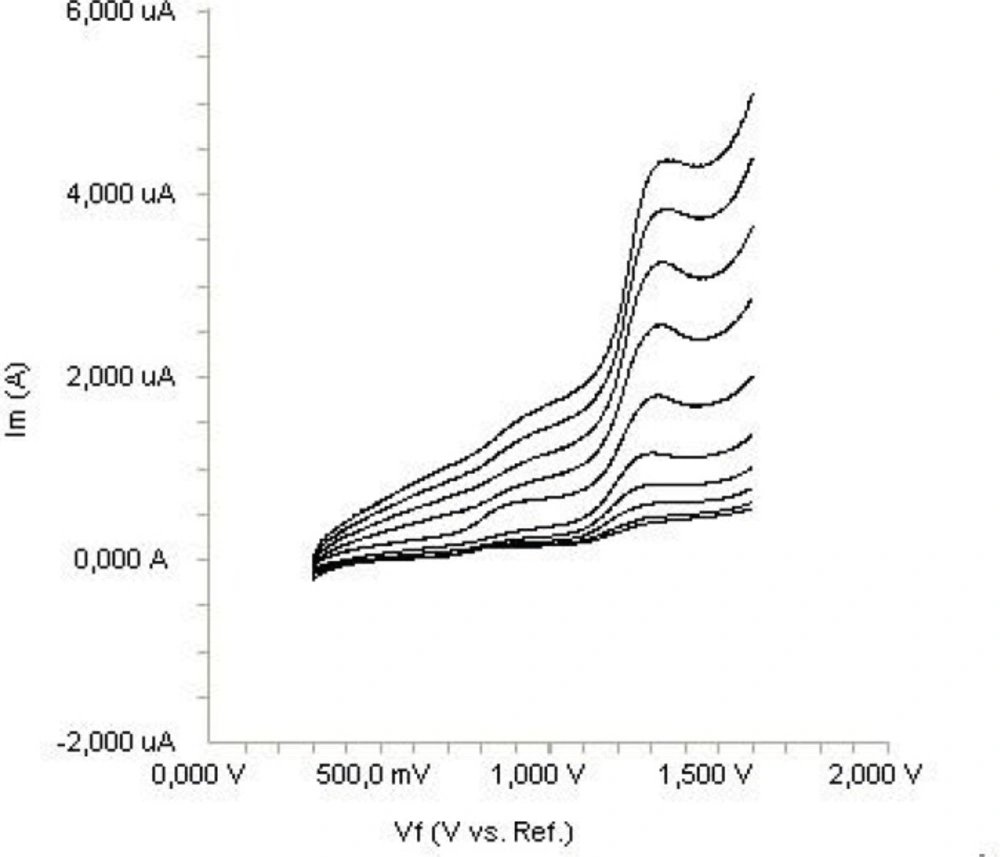
Figure 3). The representative linear sweep voltammograms obtained at Pt electrode for 20 μg mL
-1 diclofenac as a function of the scan rate are presented in
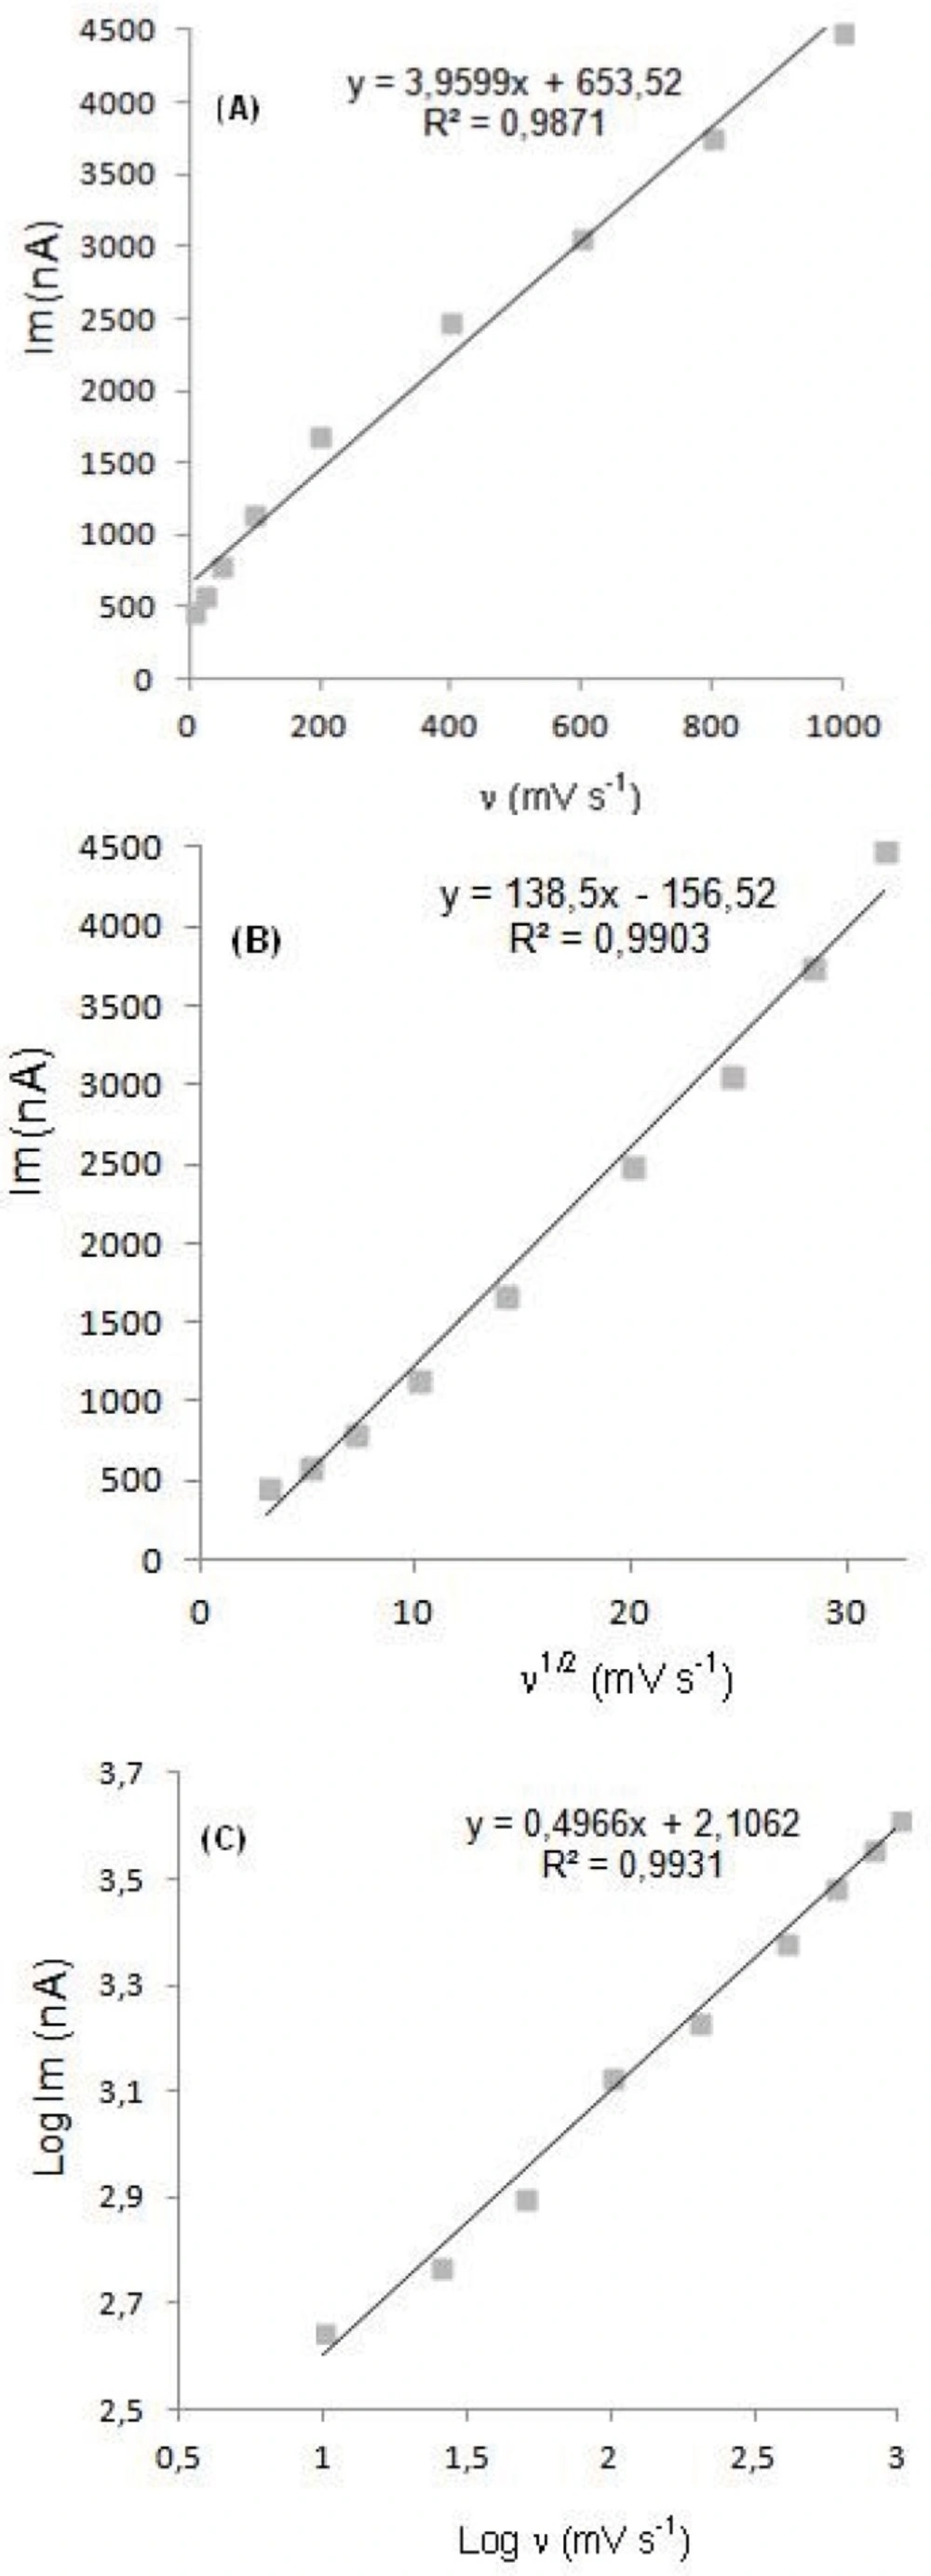
Figure 4. Scan rate dependency experiments show that the peak currents for peak vary linearly with the scan rate (ν) (
Figures 4a,b), which points out the adsorption-controlled process. However, the plots of logarithm of peak currents versus logarithm of scan rates for 20 μg mL
-1 concentration of diclofenac display straight lines with 0.497 slope (
Figure 4c), which are close to theoretical value of 0.5 expected for an ideal diffusion-controlled electrode process (
25). Log I
m-log ν curve is more eligible for this aim, therefore, a diffusional process for peak should be considered. These results suggest that the redox species are diffusing freely from solution and not precipitating onto the electrode surface. The reason for this behavior may be due to the solubility of the intermediate species in acetonitrile or poor adherence of products on the electrode surface.
Linear sweep voltammograms for the oxidation of 20 μg mL-1 diclofenac in acetonitrile containing 0.1 M TBAClO4 as a function of scan rate.
Dependence of peak current on the scan rate (20 μg mL-1).
Analytical applications and validation of the proposed method
In order to develop a voltammetric procedure for determination of the drug, we selected the SWV technique, since the peaks were sharper and better defined at lower concentration of diclofenac than those obtained by cyclic and linear sweep voltammetry with a lower background current, resulting in improved resolution. SWV is effective and rapid electroanalytical techniques with well-established advantages, including good discrimination against background currents and low detection limits (
26,
27).
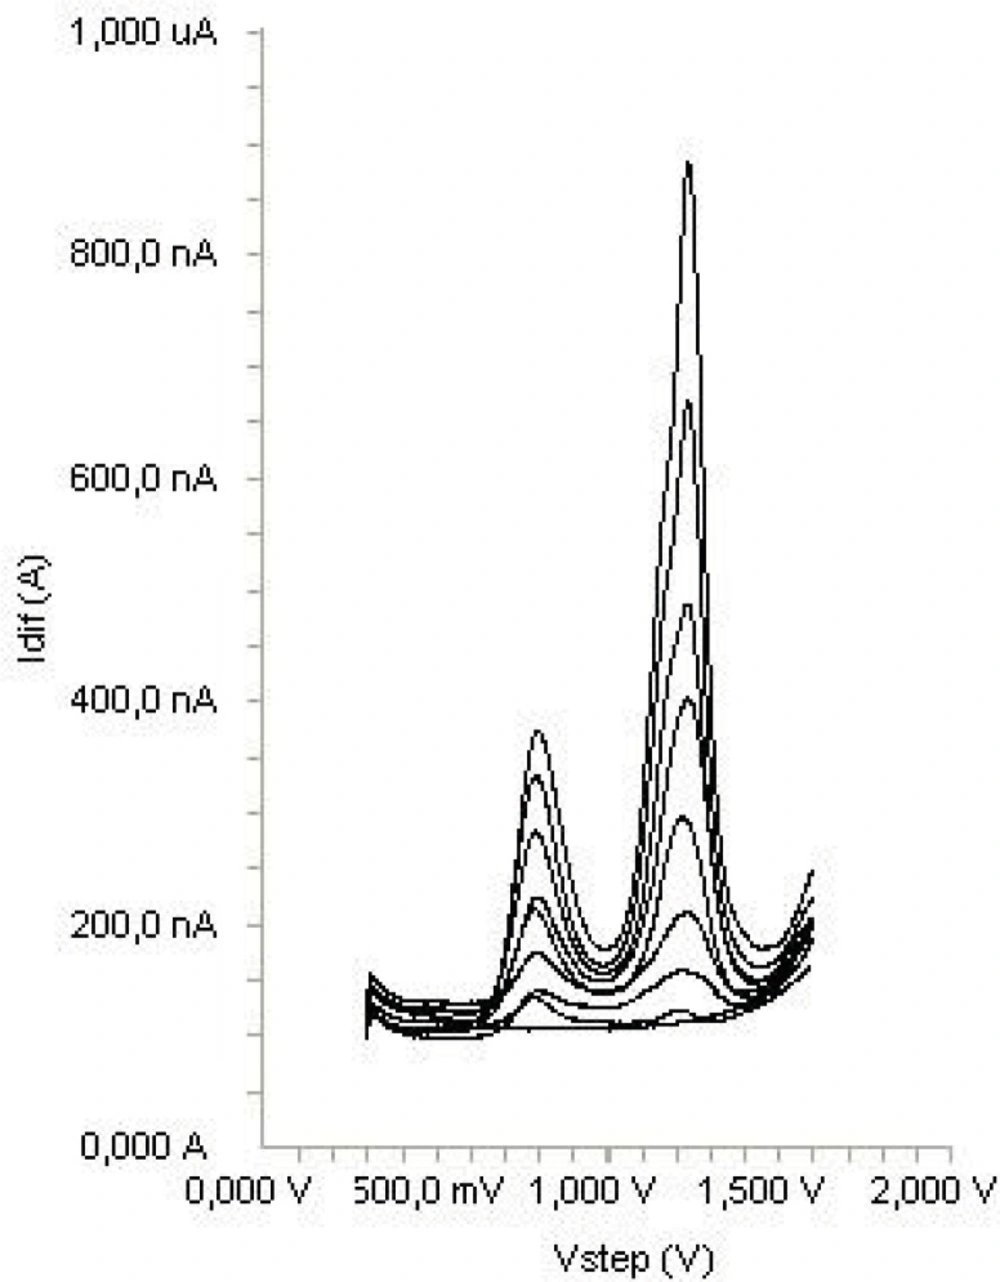
Calibration graphs from the standard solution of diclofenac according to the procedures described above was constructed by using SWV. A linear relation in the concentration range between 1.5-17.5 μg mL
-1 was found, indicating that the response was diffusion controlled in this range (
Figure 5). Above this concentration (17.5 μg mL
-1) a loss of linearity was probably due to the adsorption of diclofenac on the electrode surface. The characteristics of the calibration plots are summarized in
Table 1. The limit of detection (LOD) and the limit of quantification (LOQ) were calculated on the peak current using the following equations:
LOD = 3 s/m; LOQ = 10 s/m
SWV voltammograms obtained for the determination in supporting electrolyte (blank, 1.5, 2.5, 5, 7.5, 10, 12.5, 15 and 17.5 g mL-1).
where s is the standard deviation of the peak currents (three runs) and m is the slope of the calibration curve. The LOD and LOQ values were also shown is
Table 1. Repeating five experiments on 15 μg mL
-1 diclofenac for SWV technique tested the repeatability and reproducibility of peak potential and peak currents. The results were shown also in
Table 1. Repetition of sample analysis after 72 h period did not show any significant change in results of analyses.
| Parameters | SWV
|
|---|
| Supporting electrolyte | Serum |
|---|
| Measured potential (V) | 1.24 | 1.29 |
| Linearity (μg mL-1) | 1.5-17.5 | 2-20 |
| Slope | 7.8094 | 6.9425 |
| Intercept | 87.52 | 95.43 |
| R | 0.998 | 0.997 |
| Sa | 10.64 | 23.46 |
| Sb | 0.625 | 1.247 |
| LOD (μg mL-1) | 0.50 | 0.67 |
| LOQ (μg mL-1) | 1.50 | 2.00 |
| Repeatability of peak current (RSD%)a | 1.25 | 2.35 |
| Repeatability of peak potential (RSD%) | 1.34 | 1.94 |
| Reproducibility of peak current (RSD%) | 2.34 | 2.39 |
| Reproducibility of peak potential (RSD%) | 0.64 | 0.92 |
Average of six replicate determinations, Sa: Standard deviation of intercept of regression line, Sb: Standard deviation of slope of regression line, R: Coefficient of correlation, LOD: Limit of detection, LOQ: Limit of quantification
Determination of diclofenac in tablets
On the basis of above results, SWV method was applied to the direct determination of diclofenac in pharmaceutical preparations, using the related calibration straight lines without any sample extraction or filtration and after an adequate dilutions. The results show that the proposed method was successfully applied for the assay of diclofenac in its pharmaceutical dosage forms (
Table 2). The accuracy of the method was determined by its recovery during spiked experiments. Recovery studies were carried out after the addition of known amounts of the pure drug to various pre-analyzed formulation of diclofenac. According to the results, excipients presented in tablet do not interfere with the analysis (
Table 2).
| Diclomec | Dicloflam | Voltaren |
|---|
| Labeled claim (mg) | 100 | 50 | 75 |
| Amount found (mg)a | 99.8 | 50.4 | 75.6 |
| RSD% | 2.13 | 1.97 | 2.68 |
| Bias% | -0.2 | 0.8 | 0.8 |
| Added (mg) | 10 | 10 | 10 |
| Found (mg) | 9.98 | 10.12 | 10.09 |
| Recovery% | 99.8 | 101.2 | 100.9 |
| RSD% of recovery | 2.45 | 1.98 | 2.04 |
Each value is the mean of five experiments
There is no official method in any pharmacopoeias (e.g. USP, BP or EP) or literature method related to pharmaceutical dosage forms of diclofenac. To prove the absence of interferences by excipients, recovery studies were carried out. The results demonstrate the validity of the proposed method for the determination of diclofenac in tablets. These results reveal that both methods had adequate precision and accuracy and consequently can be applied to the determination of diclofenac in pharmaceuticals without any interference from the excipients.
Determination of diclofenac in human serum samples
Acetonitrile and methanol were tried as a serum precipitating agents. Also, different amount of acetonitrile were tried. The best results were obtained using 0.7 mL acetonitrile. The measurements of diclofenac in serum samples were performed as described in Section 2. The applicability of the proposed method to the human serum, the calibration equations were obtained in spiked serum samples. Calibration equation parameters and necessary validation data were shown in
Table 1. Obtained recovery results of spiked serum samples were given in
Table 3. Analysis of drugs from serum samples usually requires extensive time-consuming sample preparation, use of expensive organic solvents and other chemicals. In this study, the serum proteins and endogenous substances in serum samples are precipitated by the addition of acetonitrile, which is centrifuged at 5000×
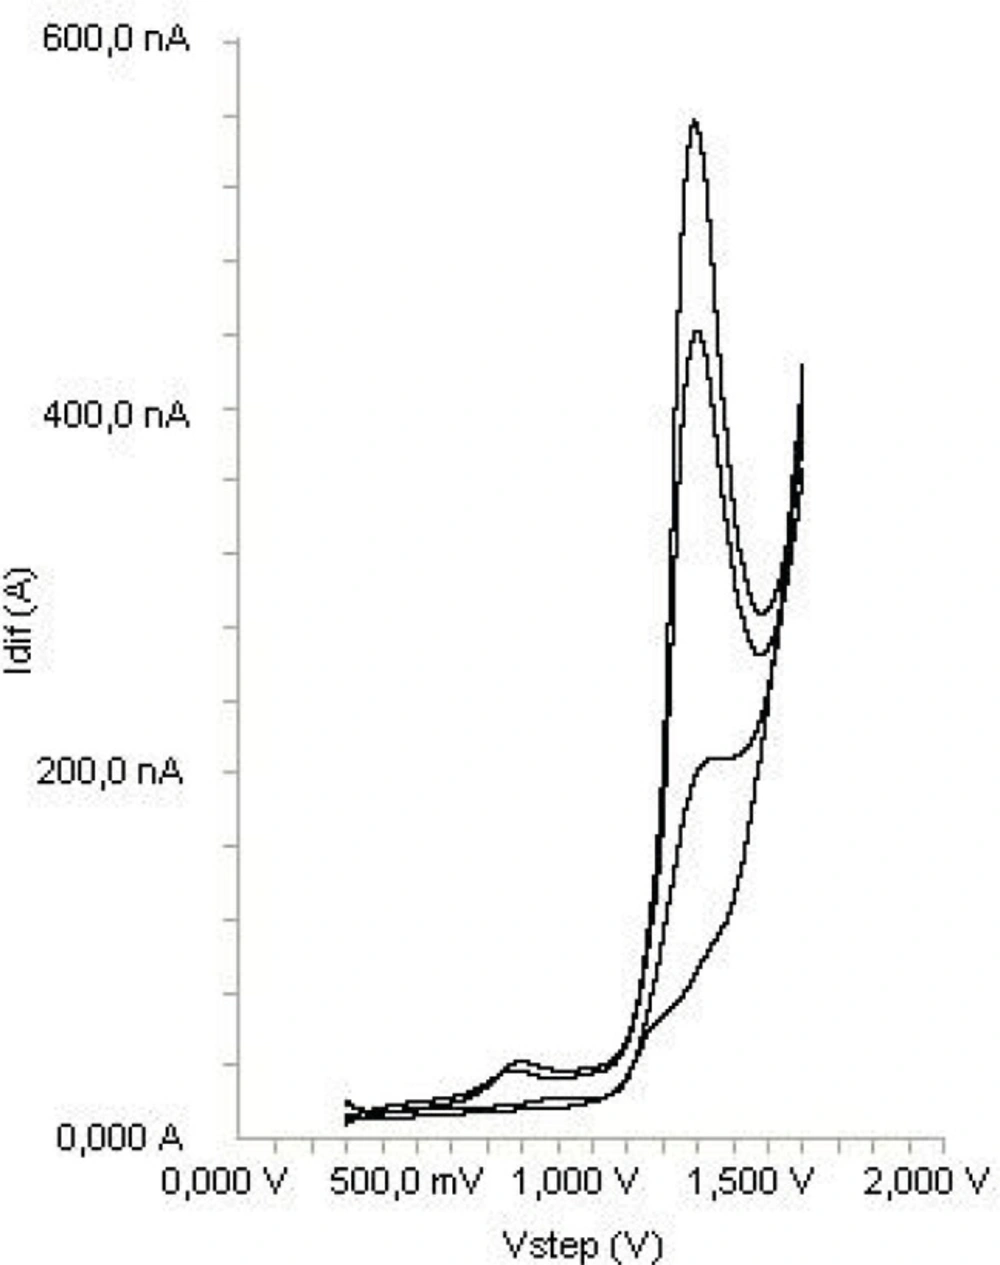
g, and the supernatant was taken and diluted with the supporting electrolyte and directly analyzed. Typical SWV curve of diclofenac examined in serum samples are shown in
Figure 6.
SWV voltammograms obtained for the determination in spiked serum (blank, 5, 10 and 15 g mL-1).
Using SWV technique, no sample pre-treatment was required, other than precipitation and dilution steps. The recovery results of diclofenac (
Table 3) in serum samples were calculated from the related linear regression equations, which are given in
Table 1. As it can be seen in
Figure 6, no oxidation compounds and no extra noise peaks present in biological material peak occurred in the potential range where the analytical peak appeared.
Stability of serum samples kept in refrigerator (+4 0C) was tested by making five consecutive analyses of the sample over a period of approximately 5 h. There were no significant changes in the peak currents and potentials between the first and last measurements.
| Added (μg mL-1) | Found(Mean ± SDa) | % Recovery | % RSDb |
|---|
| 2 | 1.94 ± 0.052 | 97.0 | 2.68 |
| 5 | 4.86 ± 0.218 | 97.2 | 4.49 |
| 7.5 | 7.42 ± 0.504 | 87.2 | 6.79 |
| 10 | 9.78 ± 0.718 | 98.9 | 7.34 |
| 12.5 | 12.43 ± 1.09 | 99.4 | 8.77 |
| 15 | 14.76 ± 1.28 | 98.4 | 8.67 |
| 17.5 | 18.14 ± 1.36 | 103.6 | 7.49 |
| 20 | 20.1 ± 1.51 | 100.5 | 7.51 |
: Standard deviation of six replicate determinations, RSD: Relative standard deviation
Average of six replicate determinations