Chemicals
2’, 7’ –Dichlorodihydrofluoroscein diacetate (H2DCF-DA) was obtained from Molecular probes (Leiden, The Netherlands). Tetracycline, mycophenolic acid (MPA), hygromycin B, phenyl methyl sulfonyl fluoride (PMSF), and monoclonal rat antibody for cytochrome C were purchased from Sigma Chemical Co. ST Louis, MO, USA.
RPMI 1640 was supplied from Biocambrex, Belgium. Genecitin (G418), penicillin and streptomycin, Non Essential Amino Acids (NEAA), Foetal Calf Serum (FCS), and Trypsin EDTA were supplied by Invitrogen (Breda. The Netherlands). Tet system Approved Foetal Bovine Serum (Tet-Off FBS) and horse serum, were supplied from BD Bioscience Clontech, Palo Alto, CA, USA. Collagen Vitrogen-100 was obtained from Cohesion Technologies, INC. Palo Alto, California, USA, Caspase-3/7 assay kits were obtained from Promega (The Netherlands) and the DNA Laddering kit was purchased from Roche Diagnostics GmbH (Germany). Alamar Blue (AB) was obtained from Biosource International, Biosource, The Netherlands. Sucrose was purchased from BDH chemicals Ltd., Poole England. All other reagents were purchased from well-known chemical companies.
PC12-Tet Off (PTO) cells were a kind gift from Dr. Silvia Stingele, ECVAM, Italy.
Cell culture
PTO cells were grown in RPMI 1640 that supplemented with 10% horse serum, 5% Tet- Off FBS, 1 % L-glutamine, 150 μg/mL G418, 150 μg/mL hygromycin B, 2 μg/mL Tetracycline and 1% penicillin (100 units/mL), Streptomycin (100 μg/mL). Cells were incubated at 37 °C in a humidified atmosphere of 5% CO2 in air. Collagen Vitrogen-100-coated flasks and dishes were used during maintenance and experiments, respectively.
The collagen solution (1% -v/v- collagen Vitrogen-100; 1% -v/v- BSA, 10% HBS, 122 mM NaCL; 2.67 mM KCL; 9.4 mM Glucose; 14 mM NaH2PO4; 20 mM Hepes; pH 7.5) was added at least 3 hours at 37 °C prior to use. The coated flask was used immediately upon removal of the excess collagen. The P53 expression in PTO cells at protein level was tested in the presence and absent of 2 μg/mL tetracycline as a prerequisite of the study and the results showed that P53 is expressed in the absence of tetracycline 2-fold more than in the presence of tetracycline.
Exposure of cells to MPA
For AB reduction, caspase-3/7 activities and ROS generation assays PTO cells were seeded in 96-well tissue culture plates at density of 2 x 10⁴ cells/well. For Cytochrome C and DNA-laddering experiments, PTO cells were seeded in tissue culture dishes (60/15 mm), at density of 2-3 x 10⁶ cells /dish and in 4 mL medium with all supplements except tetracycline. Cells were incubated for 48 hours prior to adding the MPA for more expression of p53 gene.
For all assays the old medium was removed and replaced with fresh medium containing the MPA at various concentrations (0, 10, 25, 50, 75 and 100 μM). The cells were incubated for an additional 24 hours, after which time caspase-3/7 activities, ROS production, Cytochrome C releasing and DNA-laddering assays were conducted.
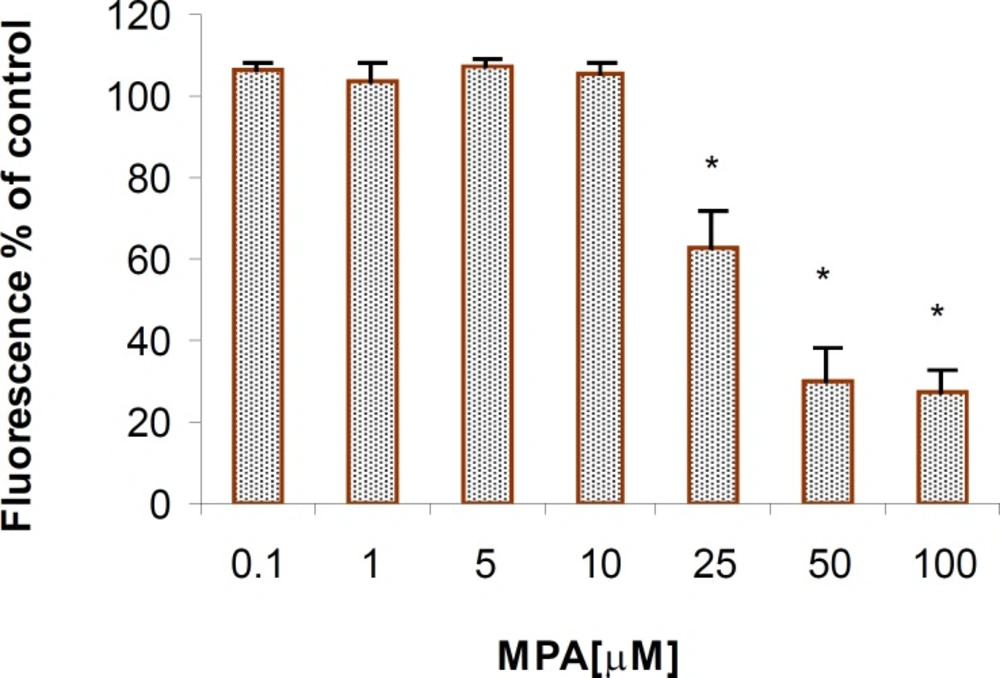
Alamar Blue Reduction Assay
Mitochondrial activities were measured following treatment with MPA serum by using AB reduction assay according to previous reports (
13). In short; the commercial stock solution of AB was diluted 10-fold in RPMI-1640. Following incubation of the cells with the test compound, the medium was removed and the cells washed with warmed PBS. Medium containing AB (Diluted, 1:10) and cells were incubated for 3 hours at 37 °C.
Thereafter, the fluorescence of the reduced AB was measured by using an excitation wavelength of 560 nm and an emission wavelength of 590 nm (Cytoflour 2300 Fluorescence Measurement System, Millipore Corp. Bedford, MA, USA). Cell viability was expressed relative to the controls (A- treated cells/ A-control cells) x 100.
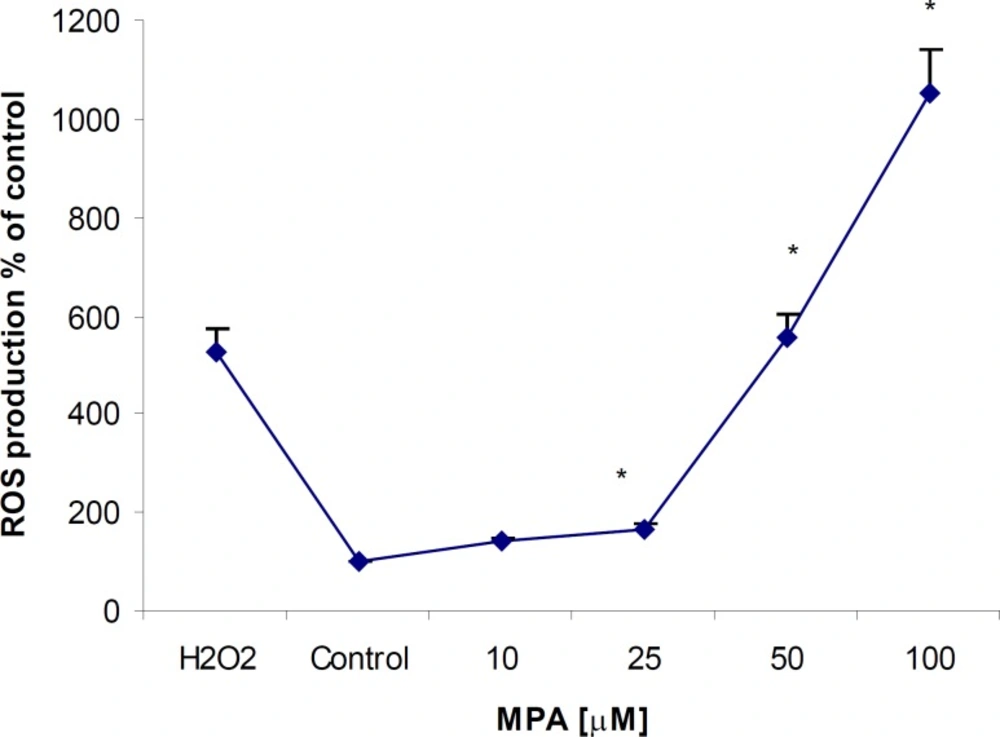
Determination of ROS production
Production of ROS was measured by using 2’, 7’, -dichlorodihydrofluorescein diacetate (H2DCF-DA), according to previously described method (
14). The principle of this assay is that DCFH-DA diffuses through the cell membrane and is enzymatically hydrolysed by intracellular esterases to nonfluorescent dichlorofluorescein (DCFH). In the presence of ROS, this compound is rapidly oxidized to highly fluorescent dichlorofluorescein (DCF). Briefly, PTO cells were plated in 96-well culture plates. After 48 hours incubation, cells were washed with pre-warmed PBS and pre-incubated for 60-80 minutes with 20 μM H2DCF-DA in 50 μL krebs Ringer Phosphate Glucose solution (KRBG; 10 mM glucose, 10 mM Hepes, 140 mM NaCl, 5 mM KCl, 1.8 mM CaCl2, 1 mM MgSO4, pH 7.4). After mentioned incubation time H2DCF-DA solution was removed and cells rinsed with PBS and treated with different concentrations of MPA. Twenty four hours after treating of the cells with MPA, ROS production was measured using a spectofluorometer microplate reader (Fluostar optima, BMG Labtechnologies GmbH, Germany) at an emission wavelength of 538 nm and an excitation wavelength of 485 nm. Relative ROS production was expressed as an increase in fluorescence compared to fluorescence of the appropriate control (100%). H2O2 at 10 μM concentration was used as a positive control.
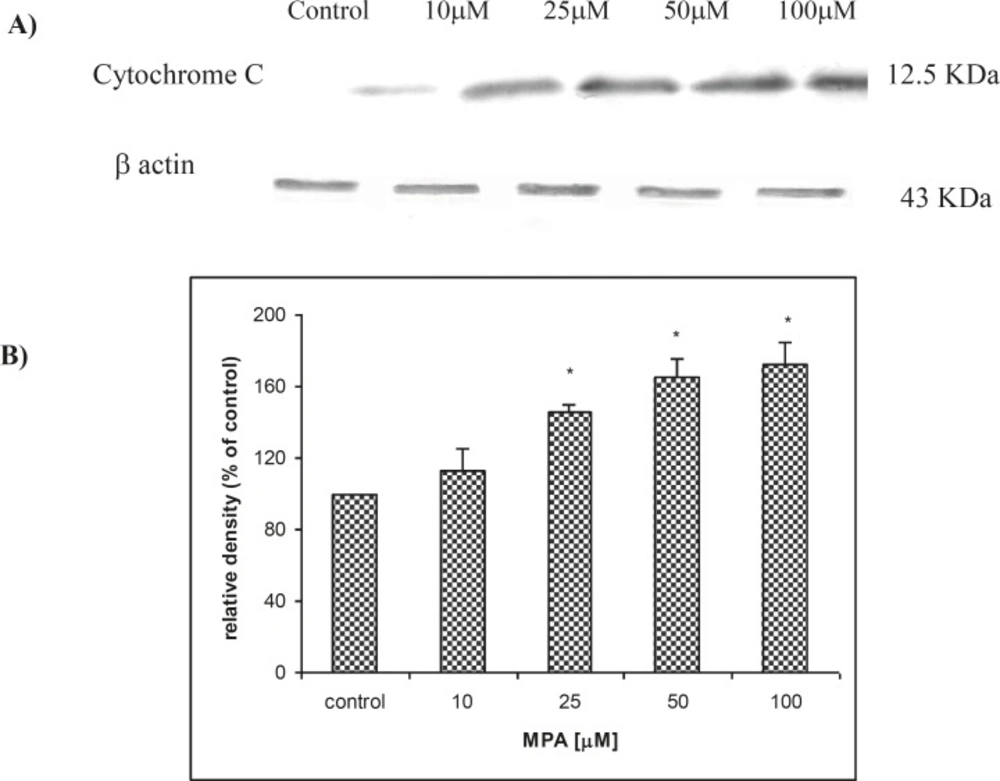
Cytochrome C assay
After the given treatment period, PTO cells were harvested with buffer containing 0.25 M sucrose, 0.1 mM EDTA, and 1 mM PMSF, and kept in ice for 15 minutes. Cells were disrupted using a glass homogeniser according to methods described previously (
15). Following centrifugation at 10,000 x
g for 15 min, 5 μg of cytosolic protein was fractionated by SDS-PAGE and analyzed by western blot analysis using a monoclonal rat antibody to Cytochrome C as described by Laemmli (1970) (
16).Detection was performed by separately rinsing of monoclonal rat Anti-Cytochrome C as test protein (Bioscience) and rabbit monoclonal anti-β actin as a reference protein (Millipore) against mouse (IgG2bκ) for immunological staining. Protein concentrations of the PTO cells were determined based on Lowry
et al. (1951) (
17). Densitometric analyses of Western blots were performed using Molecular analyst software (version 1.5) from BioRad (Hercules. CA, USA) and the density of Cytochrome C bands were normalized against corresponding β actin bands.
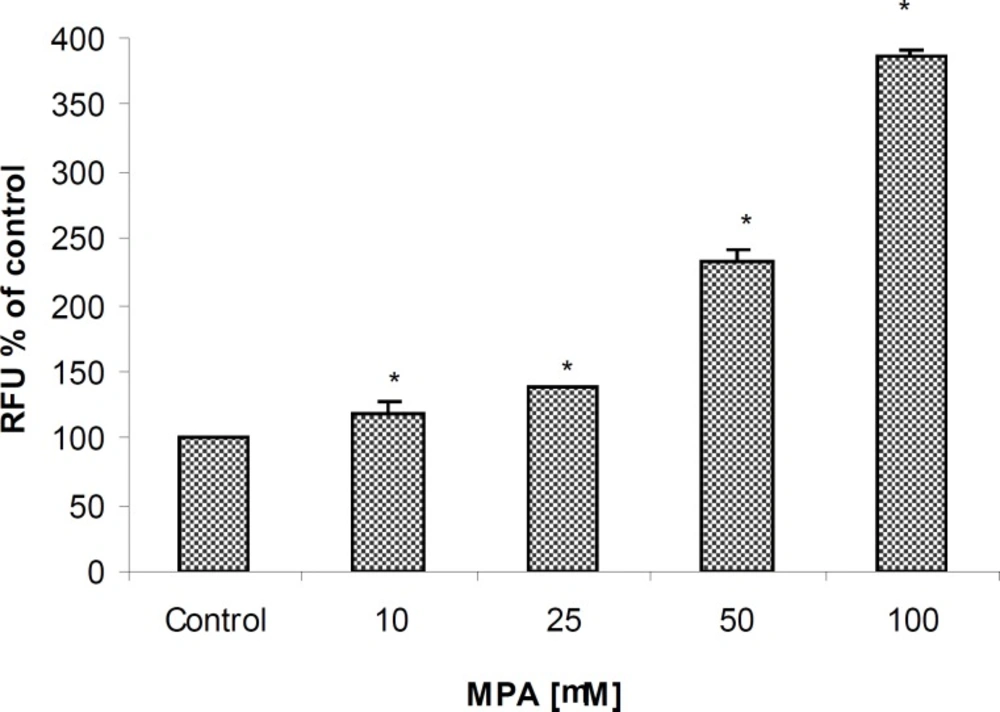
Caspase-3/7 activities assessment
Following exposure of PTO cells to MPA at various concentrations for 24 hours, 100 μL of homogeneous caspase-3/7 reagent was added on cells and cultured plates covered with aluminium foil were then gently shaken using a plate shaker at 300-500 rpm for 30 seconds to 1 min. Thereafter, cells were incubated for 8 hours. The fluorescence of treated cells was measured at an excitation wavelength of 498 nm and emission wavelength of 530 nm. Caspase-3/7 activities were expressed relative to controls as (A- treated cells/ A-control cells) x 100.
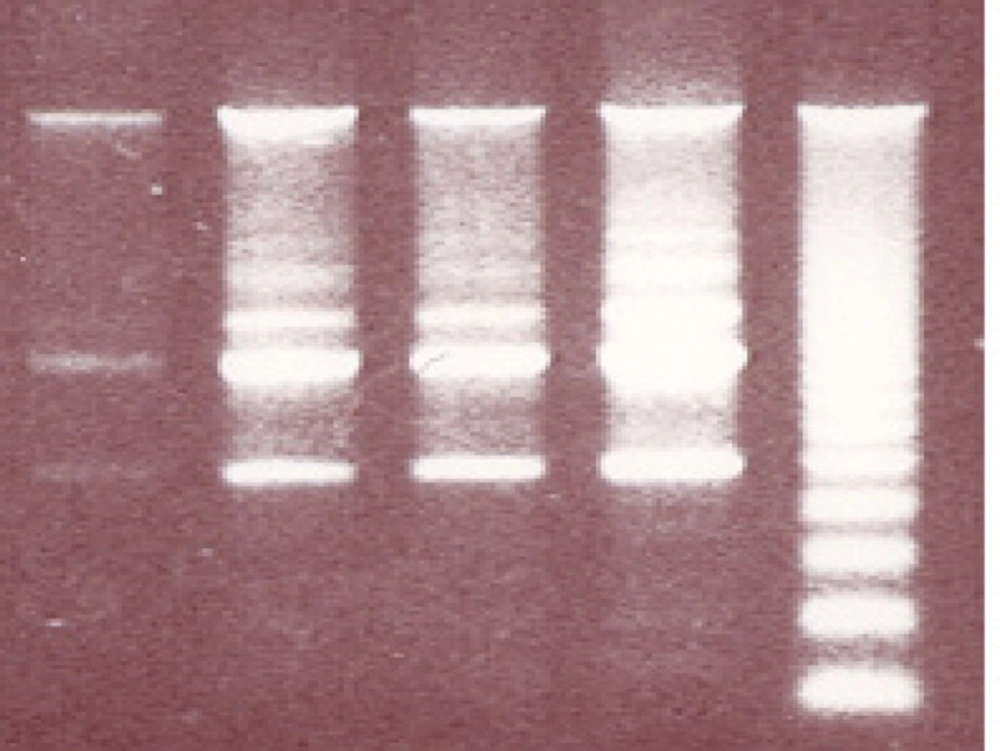
DNA-Laddering
DNA of the MPA-treated PTO cells was purified based on apoptotic DNA Laddering kit manufacturer’s instructions (Roche Diagnostics, GmbH). Briefly, PBS and l lyses buffer (6 M guanidine-HCL, 10 mM Urea, 10 mM Tris-HCL, 20% Triton X-100 [v/v], pH 4.4) were added to cells and incubated for 10 min at 15-25 °C, after which time isopropanol was added to the samples. The filter and collection tubes (provided in the kit) were combined and samples pipetted into the upper reservoir. After centrifugation for 1 minute at 2860 x g (eppendorf centrifuge 5417 R) the eluate was discarded and the used collection tubes were combined with filters. 500 μL washing buffer (20 mM NaCl; 2 mM Tris-HCl; 80 % [v/v] ethanol: pH 7.5) centrifuged at 2860 x g for one minute, and after discarding the collection tube this washing phase was repeated and the residual wash buffer was removed by centrifuging for 10 seconds at 7550 x g, and was added to the upper reservoir. The filter tube was then inserted into a clean Eppendorf tube and for the elution of DNA, 200 μL of 72 °C pre-warmed elution buffer (10 mM Tris, ph 8.5) was added to the filter tube and centrifuged for one minute at 2860 x g. The eluted DNA was used directly or stored at –20 °C for subsequent analysis.
DNA was quantified and a volume of the eluate corresponding to 2-3 μg DNA (15-17 μL of eluted DNA) was added to loading buffer (50% glycerol; 2 mM EDTA; 0.4 % bromphenol blue), and the DNA solution was run on a 0.8 % agarose gel for 60 minutes at 60 V constant voltage. λPST1 also was loaded as a marker for identification of amount of DNA. Gels were stained with ethidium bromide and visualized by UV light.
Statistic analysis
Significance of differences between control and treatment with various concentrations of MPA in AB reduction, caspase-3/7 activities, Cytochrome C and ROS production assays determined using a one-way ANOVA and then Bonferroni test was used as posthoc test using Graph pad Prism (Version 4.1). Differences were considered significant if p < 0.05.