Model results versus reported pharmacokinetic data
Table 1 shows the pharmacokinetic parameter values considered for solution of the model. Most parameters were taken or calculated from data reported by Abrams
et al. (
6,
8). The elimination constant (K
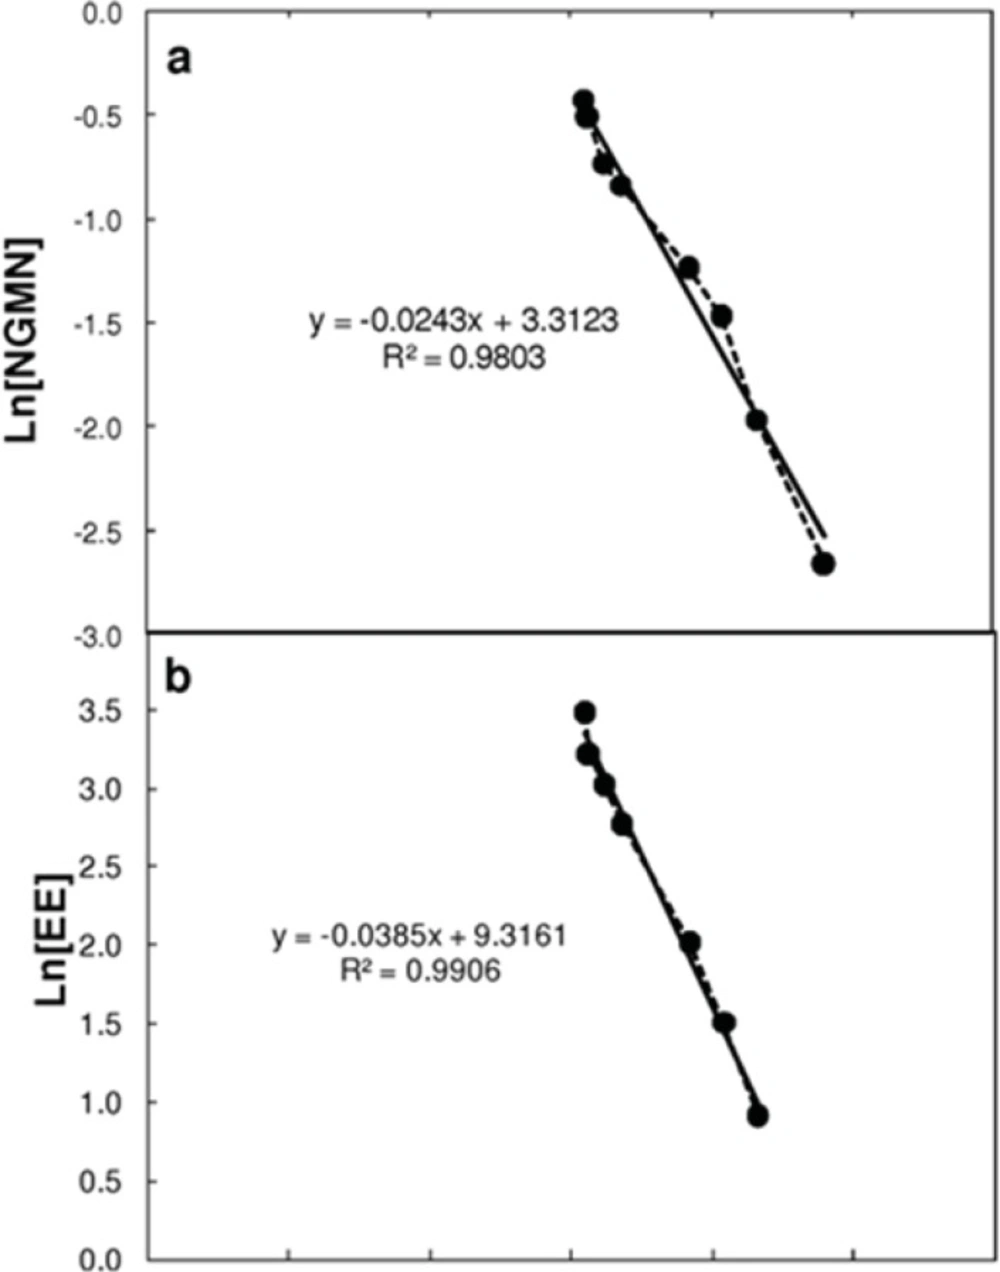
elim) was obtained by plotting the natural logarithm of the plasma concentration values for NGMN and EE after patch removal at the end of the cycle. The elimination process followed an exponential decay behavior that was a first order process (dependent on the drug concentration in the serum) characterized by a single constant (see
Figure 2).
| Kinetic constants | NGMN | EE |
|---|
| ko | 150 μg day-1 | 20.5 μg day-1 |
| Cl a | 7.89 L h-1 | 18.3 L h-1 |
| t1/2 b | 28.4 h | 15.2 h |
| kelim c | 0.0244 h-1 | 0.0385 h-1 |
| Vd d | 323,300 mL | 401,385 mL |
| α | 0.0028 | |
| β | | 0.0034 |
Estimation of the elimination constant (Kelim) by linearization of the concentration profiles of (a) Norelgestromin (NGMN) and (b) Ethinylestradiol (EE) in plasma after patch removal. Linearization was performed by assuming a first order decay, and plotting the natural logarithm of the concentration of each active ingredient versus time. The slope of each curve corresponds to the elimination rate constant
Probably the most adventurous assumption made in our model refers to the time dependence of the absorption rates of each active ingredient. We proposed that the variation in absorption rate with time corresponded to an exponential function (see Equations 5a and 5b). Ideally, a descriptive model of release/absorption should consider (a) diffusion of the active compound from the bulk of the patch to its surface, (b) diffusion of the active compound from the membrane of the patch to the
stratum corneum of the skin, (c) sorption and penetration from the
stratum corneum to inner layers of the tissue, and (d) uptake from the capillary network (
19,
20). It has been suggested that either the
stratum corneum (
19) or the delivery device can control the rate of drug delivery to plasma (
20). Moreover, the observed flux can be the result of the combined effects of the skin and the device (
20). In the model presented here, we follow the later approach and consider that the combined effects of the transport through the patch and the skin can be modeled by the actual delivery rate (k
o) and an exponential decay component of the type [exp (-α*t)]. This exponential decay term conceptually lumps the effect of diverse mechanisms responsible of progressively attenuating the release of the active compound in time (depletion of the active compound from the bulk of the patch, saturation of the
stratum corneum, changes in the permeability of the patch due to use, among others).
In literature, k
o values of 150 ± 38.0 and 20.5 ± 6.6 were originally reported (
6) for NGMN and EE, respectively. Recently, Health Canada endorsed a bulletin by Janssen-Ortho (
27), manufacturer of Ortho-Evra, providing updated information on the average daily release rates of NGMN (200 micrograms [μg] every 24 h) and EE (35 μg every 24 h). These updated values were used in the model as initial absorption rates. The parameters α and β, modulating the time dependency of the overall absorption rate for each active ingredient, were adjusted using the experimental data presented by Abrams
et al.(
8). Indeed α and β were the only two adjustable parameters used in the model. We observed a significant improvement in the fitting to experimental data (measured as mean squared error) when this assumption of time dependant absorption rate was implemented.
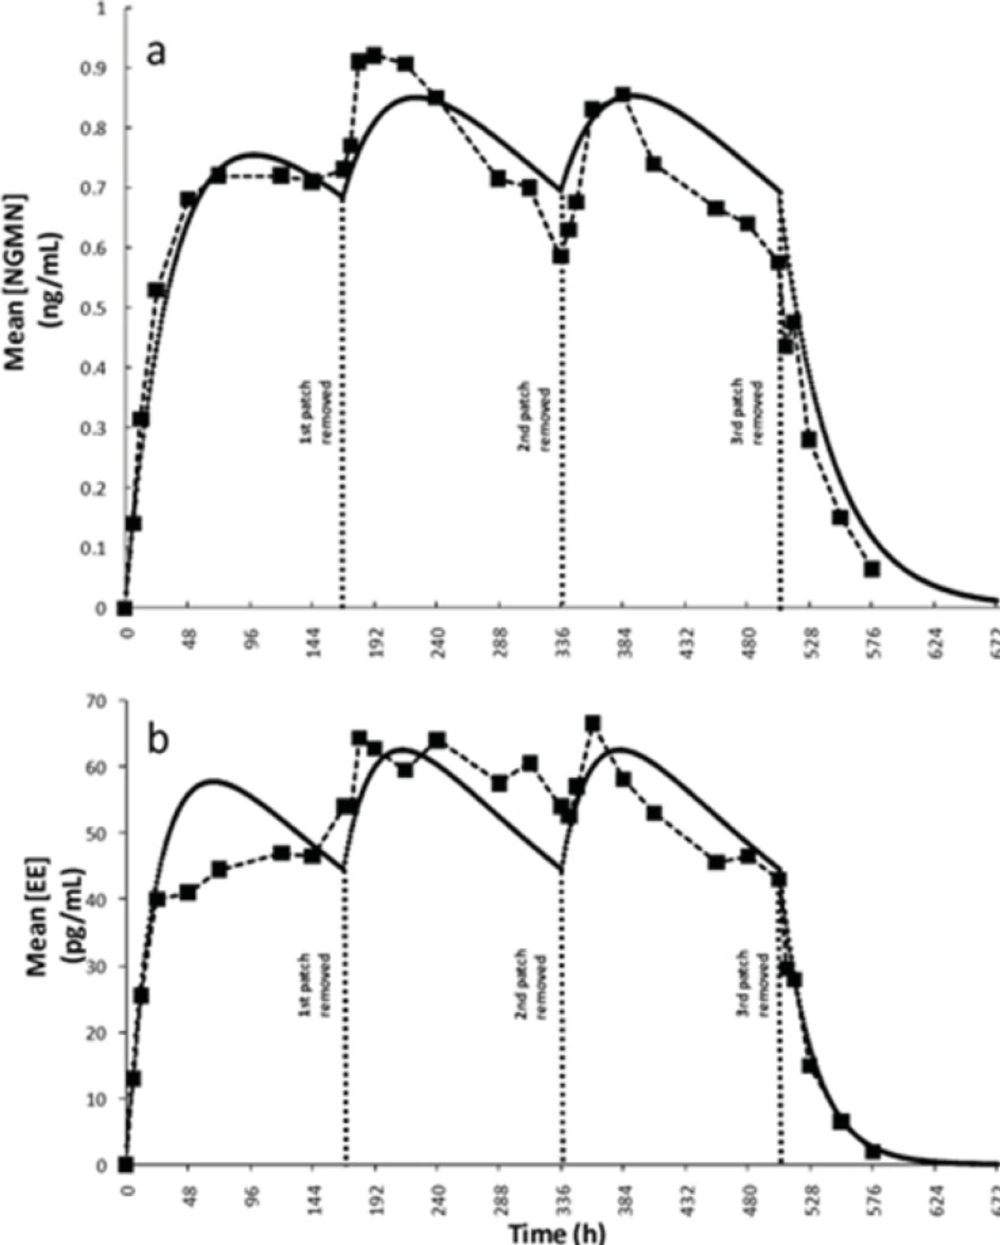
Figures 3a and 3b show comparisons of the concentration profiles obtained from simulations using the proposed model with the experimental data reported previously by Abrams
et al.(
8). This simulation corresponded to a typical treatment. The periodic behavior displayed was due to the restoration of the k
o when the patch was replaced at the start of weeks 2 and 3. The literature data also indicated that plateau serum concentrations for both active principles are typically reached approximately 48 h after the patch has been applied (
24,
25). A consistent behavior was observed in our simulation results (see
Figure 3).
Simulation results and validation of the model. Plasma concentration profiles for a typical three weeks administration treatment: (a) Norelgestrmin (NGMN) obtained by Abrams et al. (6) (--■--), as predicted by simulations (—). (b) Ethinylestradiol (EE) experimentally obtained by Abrams et al. (6) (--■--), as predicted by simulations (—).
We also compared several relevant pharmacokinetic parameters, including the steady state concentration of each active ingredient (C
ss), the half-life time (t
½), and the area under the curve of plasma concentration versus time per week (AUC
0-168h). As shown in
Table 2, values derived from modeling showed a satisfactory agreement with experimentally calculated values.
| | Reference values (8, 9) | Predicted values from model fit |
|---|
| NGMN | | |
| Css(ng ml-1)a | 0.83 ± 0.21 | 0.773 |
| AUC0-168 (ng h ml-1)b | 123 ± 32.3 | 123.40 |
| t1/2 (h)c | 28.4 ± 12.8 | 27.96 |
| k0 (μg day-1) | 150 ± 38.0 | 150 ± 20.5 |
| EE | | |
| Css (pg ml-1)a | 56.7± 22.6 | 52.63 |
| AUC0-168 (pg h ml-1) b | 8543 ± 3488 | 8463.75 |
| t1/2 (h) c | 15.2 ± 3.3 | 15.57 |
| k0 (μg day-1) | 20.5 ± 6.6 | 20,67 ± 3.41 |
In summary, the proposed mathematical model reproduces the experimentally observed pharmacokinetic behavior reported previously. To do so, the model assumes a restoration of ko at each patch replacement, and a time-dependent rate of drug release into the plasma. The variation in the release rate is attributed to two factors: a gradual decrease in the hormone concentration in the patch, and a gradual saturation of the skin with the active ingredients. Both of these effects would decrease the rate of drug absorption. As the model shows, the efficacy of the contraceptive treatment is not severely compromised by these factors under a typical administration scheme.
Beyond describing the behavior of NGMN and EE in serum, the proposed mathematical model can be used to predict pharmacokinetic behaviors under different administration scenarios.
Simulation of non-compliant scenarios
Under the recommended administration protocol, the patch does not cause any overdose because the amounts of hormones released are adequately balanced by drug elimination. However, non-compliance is a common problem compromising treatment effectiveness. Particularly, in the case of contraceptive patches, the occurrence of non-compliance behavior has been relatively well characterized (
12-
14). For example, in a sample of 812 north american women using contraceptive patches, the percentage of perfect compliance range between 88.1% and 91% among different age groups (
12). In another study, a population of 812 users of contraceptive patches exhibited perfect compliances in the range of 89.6 to 91.8%. In an parallel group of 605 users of oral contraceptives, perfect compliance did vary among different age brackets, being as low as 67.7% in users aged 18-20 years and as high as 80% in those aged 30 years and older (
13). Although perfect compliance among patch users is comparatively high, the consequences of non-compliance events are highly significant. In that very same study, the risk of pregnancy increased 5 to 10 fold among the non-perfectly compliance subgroup (
13).
Our model was also used to explore performance under common non-compliance scenarios, with the aim of estimating potential pregnancy risk or even suggesting adequate corrective actions.
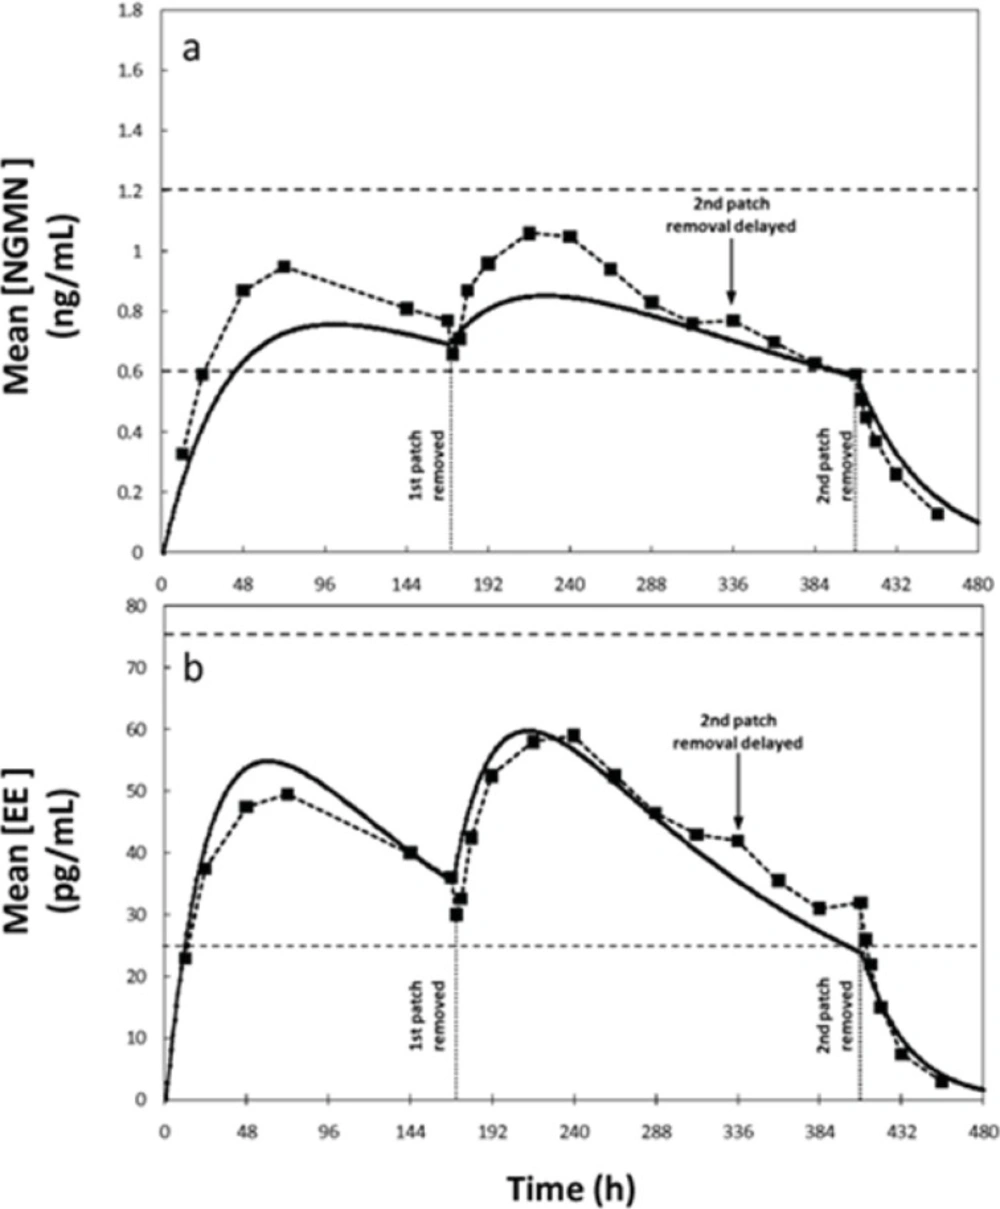
For example, for a patch administration regimen consisting of a 504 h cycle (3 weeks), with patch replacement every 168 h (7 days), effective concentration values of 0.6–1.2 ng/mL for NGMN and 25–75 pg/mL for EE have been established (
6,
8). For comparison, we considered an alternative scenario where the user forgets to replace the patch at the prescribed time (14
th day or 336 h), and retains it until the 17
th day. The experimentally determined concentration profiles for this scenario were reported elsewhere (
8). Through blood sampling, the authors found that serum concentrations of NGMN and EE remain in the reference therapeutic range during these 17 days, suggesting that the treatment is still effective between day 14 and 17. Similarly, our simulation results indicated that concentration of EE remains within the therapeutic range despite the delayed patch replacement but the concentration of NGMN falls below the effective range at day 16 for approximately 26 hours (
Figure 4). Note that, at hour 408, the serum concentrations of both hormones are at the lowest values of the reference range. Further delay in patch replacement would be detrimental to treatment effectiveness.
Concentration profiles of Norelgestromin (NGMN) and Ethinylestradiol (EE) for a non-compliance scenario where patch removal is delayed during the second week of application. Comparison 1of experimental data reported by Abrams et al. (6) (--■--), and (b) predictions obtained by simulations using the proposed model (—).
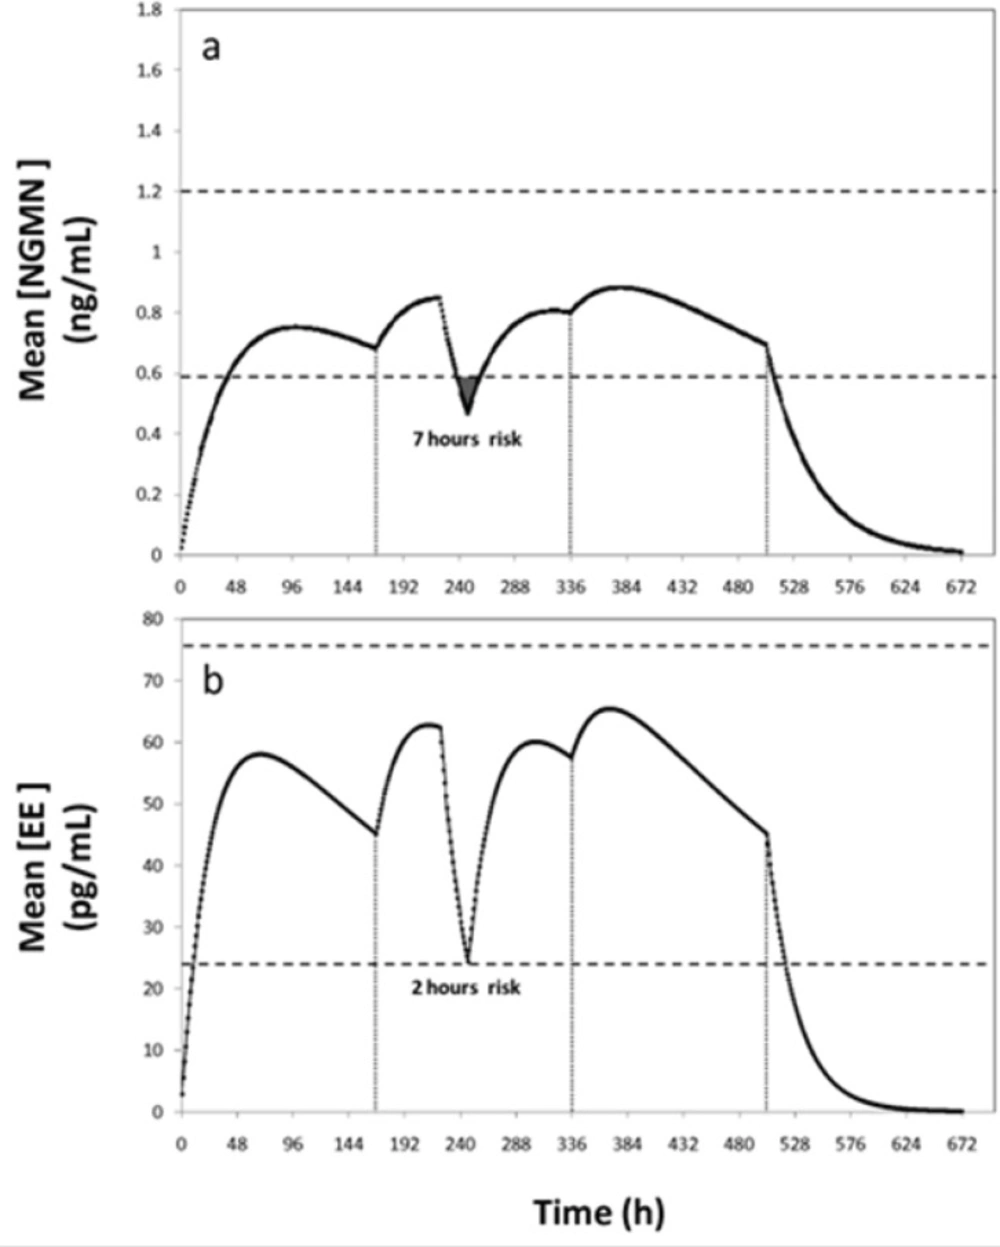
A second non-compliance case would be a patient who forgets for 1 or 2 days to replace the patch in the second or third week of the cycle. In these circumstances, the manufacturer recommends applying a new patch and continuing the cycle to maintain an acceptable low risk of pregnancy. If the patient forgets to change the patch for more than 2 days, the risk of conception rises and a new cycle should be started. Use of additional contraceptive methods is also recommended to reinforce protection during the first week of the new cycle. These indications are consistent with our simulation results. The efficacy of the contraceptive treatment becomes seriously compromised if the patch is not replaced after the second day of the second or third week of application (
Figure 5).
Concentration profiles of (a) Ethinylestradiol (EE) and (b) Norelgestromin (NGMN) for a non-compliance scenario where the patch is completely detached for 24 h during the second week of contraceptive treatment. Patch detachment and patch reapplication events are indicated with arrows. Therapeutic range is indicated between dashed lines
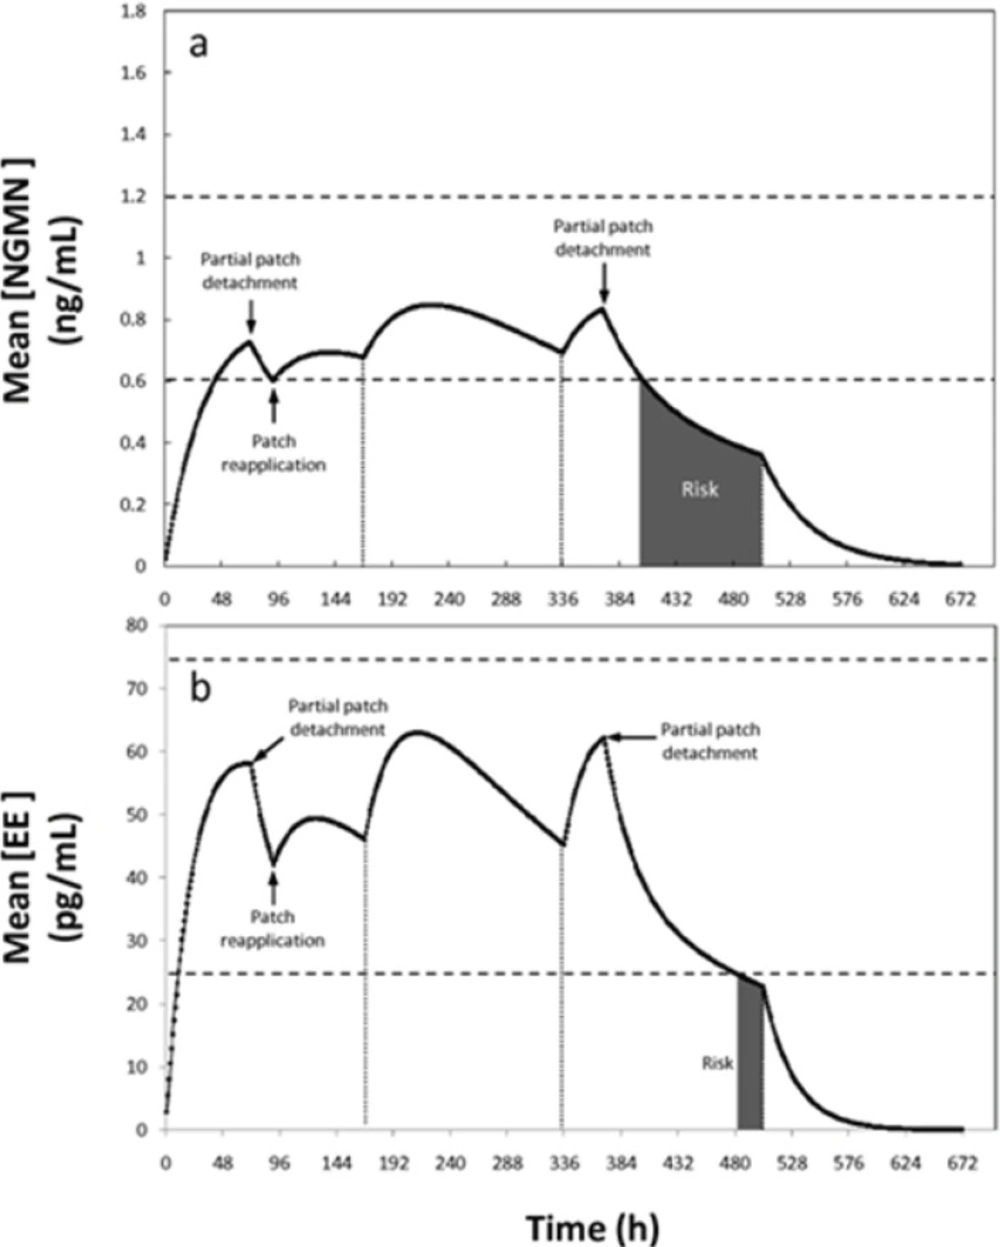
In a third non-compliance situation, partial or complete patch detachment was simulated. In practice this is a relevant scenario to simulate. In a recent study with more than 3319 woman, the adhesion of Ortho Evra® under different climate and physical activity conditions (including exercising) was determined (
10). Results indicated that patch adhesion is adequate and not statistically compromised by weather or activity conditions. Only nearly 5% of the Ortho Evra patches applied in the referred study were detached partially (2.9) or totally (1.8%) (
10). Therefore, although not highly frequent, the event of patch detachment and its potential consequences in patch efficacy deserves some attention. In the event of total patch detachment, if the patch was absent for less than 24 h, the manufacturer recommends re-application in the same place or immediate application of a new patch, without any adjustment of the regimen. In particular, detachment of the patch occurring during the first week becomes a critical situation, considering that the serum concentrations of the patch active ingredients are at lower levels than during the following weeks. The proposed model can be used to study partial detachment situations in detail. For example, if only 50% of the patch area detaches at the end of day three of the first cycle, situation depicted in
Figure 6, the concentration of NGMN becomes the limiting factor. Our simulations suggest that, following detachment, the concentrations remain within the therapeutic reference range for 22 h for NGMN (see
Figure 6).
Concentration profiles of (a) Ethinylestradiol (EE) and (b) Norelgestromin (NGMN) for a non-compliance scenario where a patch is partially detached (50% of its contact area is detached for 24 hours) during the first and third week of contraceptive treatment. Patch detachment and patch reapplication events are indicated with arrows. Therapeutic range is indicated between dashed lines. Periods with pregnancy risk are indicated as shaded areas
Therefore, based on the model output, a window of pregnancy risk begins 22 h after patch detachment. Replacement or re-application of the patch is therefore advisable within this timeframe. If the time limit of 22 h is exceeded, a new patch should be applied and a new cycle should be started. In addition, a backup contraception method should also be used for at least one week after detachment. This is, however, not the most pessimistic scenario, since at the end of the third day the concentration of NGMN has reached its plateau its first week plateau. Based on the model output, if a detachment of 50% of the total area of the patch occurs earlier during the first week (for example after 48 h), the device should be re-adhered within a period of no longer than 14 h to maintain efficacy (scenario not shown). Consistent with the current clinical recommendation, the regimen should not be changed if replacement is done during this time period.
During the second and third weeks, when higher drug concentrations are achieved in the serum, this 22 h period could be extended to approximately 34 h without increasing the pregnancy risk (see
Figure 6). Consequently, the model partially supports the manufacturer’s indications related to patch detachment scenarios. Our results suggest the establishment of specific indications for critical situations. Full patch detachment and the occurrence of incidents during the first week of application should be considered as particularly critical conditions.
It is important to note that the proposed model is not able to address all physiological events that occur due to treatment non-compliance. For example, after an intentional dosing error, significantly lower follicular size and incidence of ovulation have been reported in women using the Ortho EVRA® patch than in those who used oral contraceptives (
26). This data suggests that, for some non-compliance scenarios, the potential pregnancy risk caused by treatment faults could be higher than our model indicates.
Alternatively, the model can be conveniently adapted to anticipate the effect of variations on patch characteristics such as differences in contact area (
9), doses and materials with different properties. Recently, there has been controversy on the possible increased risk of venous thromboembolism (VTE) in contraceptive patches containing EE (15-17). Although some reports indicate that no-increased risk of VTE was observed in women using contraceptive patches versus oral formulations containing EE (
15,
16), other reports suggest an increased risk of 5 fold in subjects using Ortho Evra® (
17) Mathematical modeling can be a valuable tool to determine optimal concentrations of active ingredients, or alternatively precise surface areas, that guarantee lower side effects without compromising efficacy. In our simple model, a sensibility study on the effect of changing the surface area of the patch or the concentration of each active ingredient on their serum concentration profiles can be easily done by only adjusting initial condition values. With relatively minor modifications and additional pharmacokinetic data, the model could be even adapted to describe similar transdermal drug delivery devices.