HPLC method development
Choice of detection wavelength
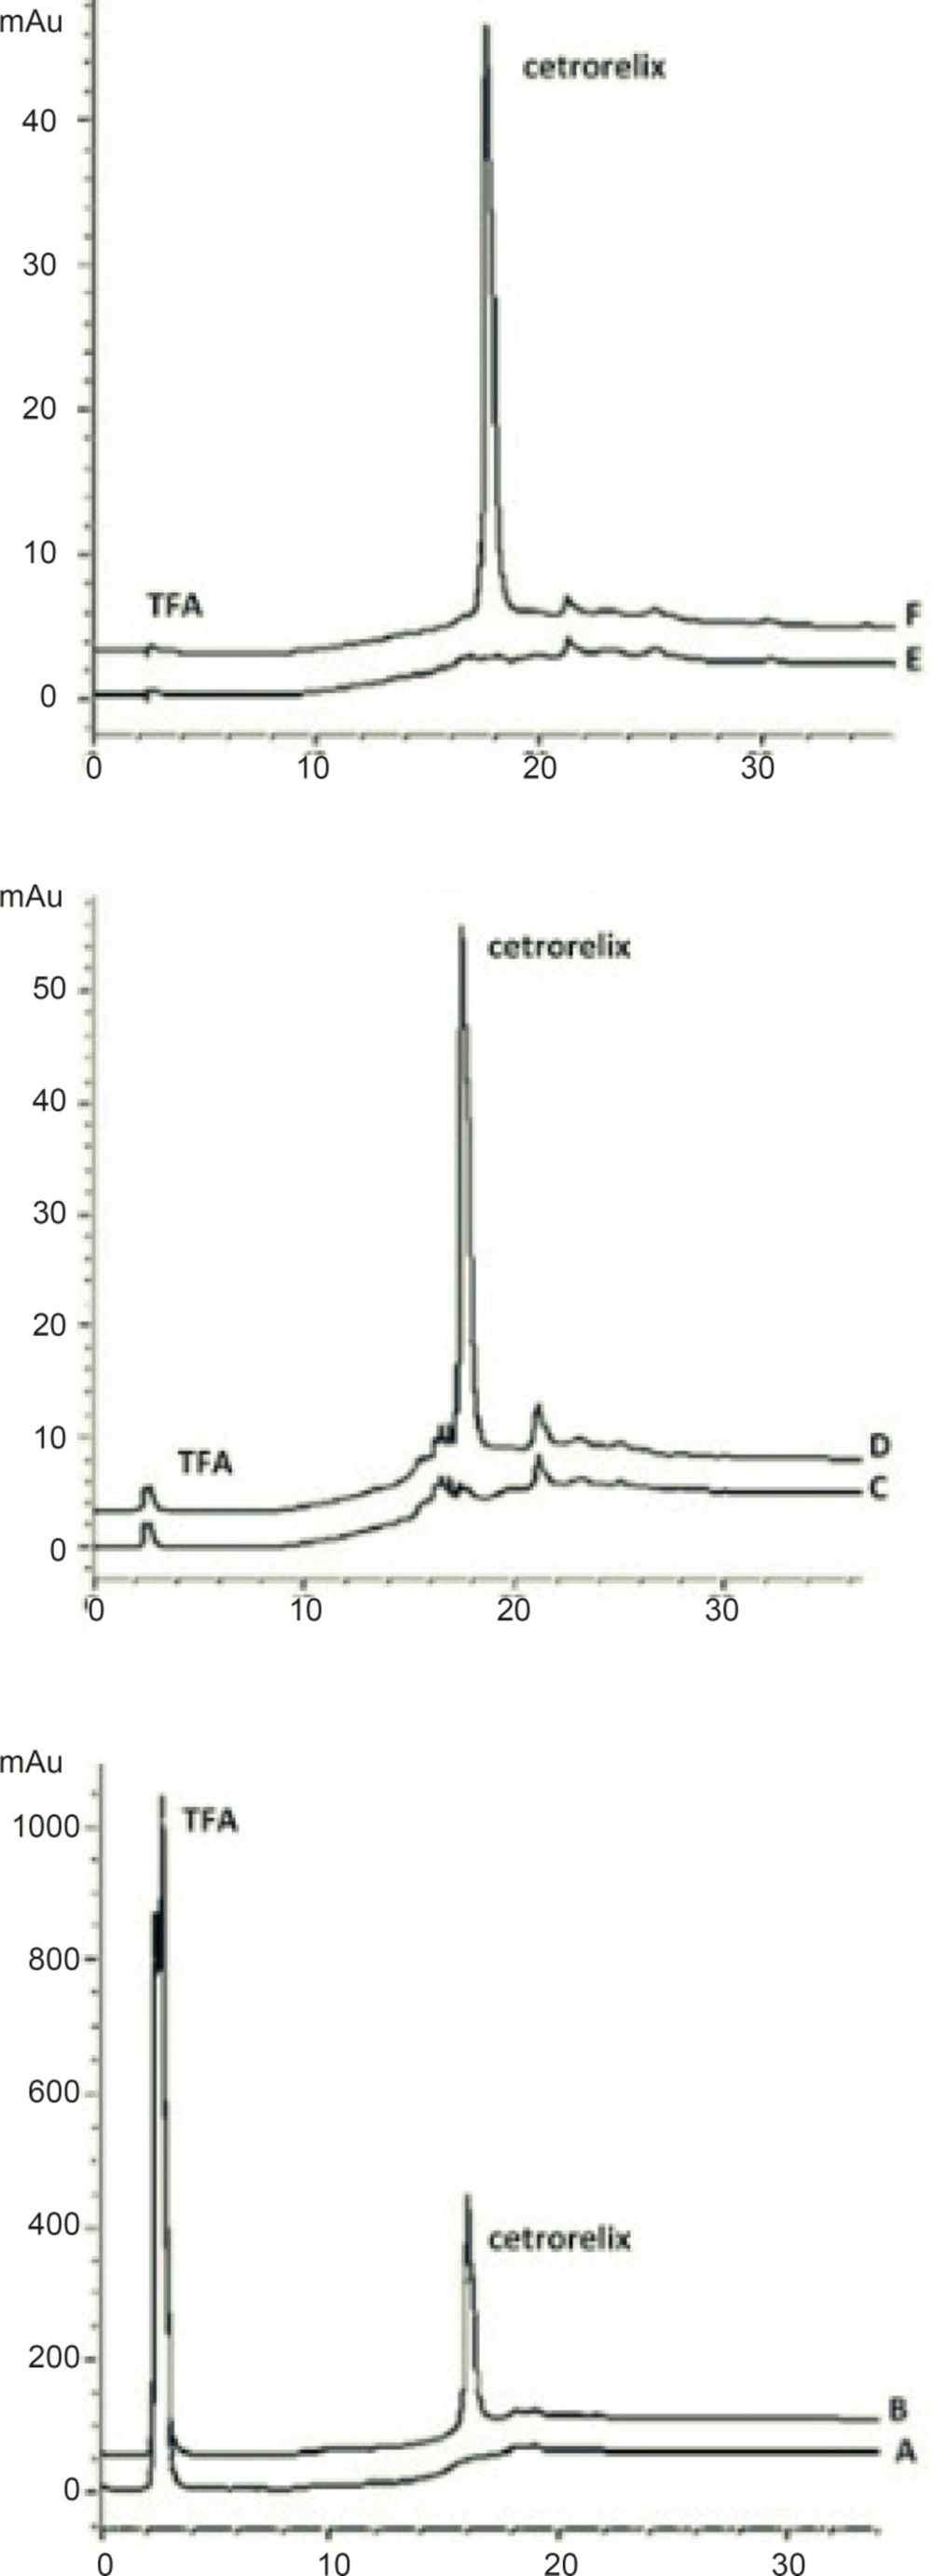
Cetrorelix peak was monitored at different wavelengths (230, 265 and 275 nm) and a compromise wavelength of 275 nm was selected as the optimum wavelength for HPLC analysis because it maximizes the peak symmetry of cetrorelix, while giving a flat baseline and minimum signal of TFA (
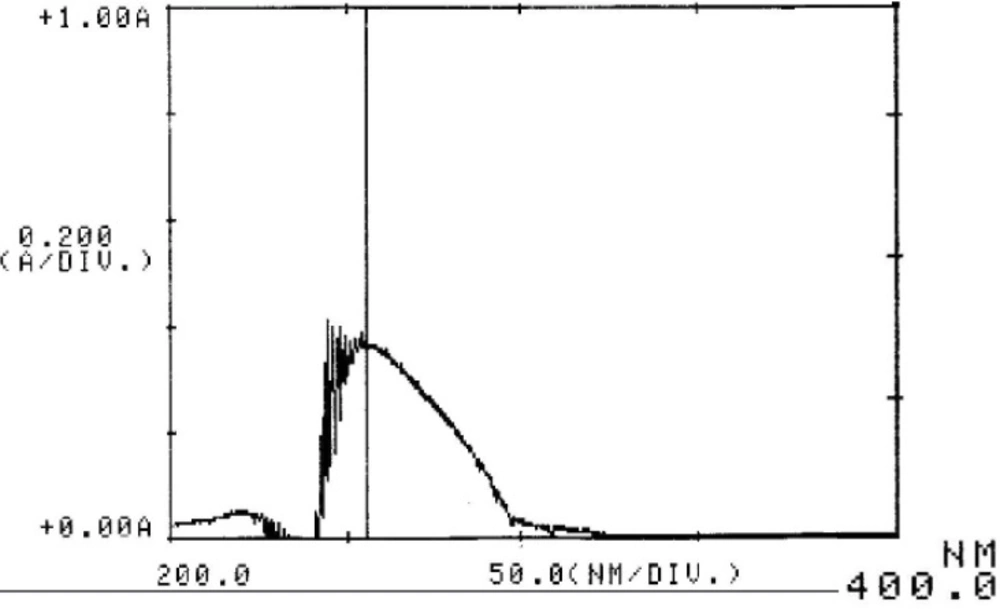
Figure 2). Furthermore the ultraviolet spectra of aqueous solution of cetrorelix showed the maximum absorption wavelength at 275 nm (
Figure 3).
Chromatograms of: (A) blank sample (deionized water) in 230 nm (B) standard solution, 125 μg/mL cetrorelix as acetate in 230 nm (C) blank sample (deionized water) in 265 nm (D) standard solution, 125 μg/mL cetrorelix as acetate in 265 nm (E) blank sample (deionized water) in 275 nm (F) standard solution, 125 μg/mL cetrorelix as acetate in 230 nm
UV spectrum of cetrorelix acetate
Choice of gradient program for mobile phase
Separation of small molecules involves continuous partitioning of the molecules between the mobile phase and the hydrophobic stationary phase. Peptides, however, are too large to partition into the hydrophobic phase; they adsorb to the hydrophobic surface after entering the column and remain adsorbed until the concentration of organic phase reaches the critical concentration necessary to cause desorption (
18-
19). Because peptides diffuse slowly, RP-HPLC results in broader peaks than obtained with small molecules (
16). In addition, Small peptides have a hybrid separation mechanism. They desorb more quickly with changes in organic modifier concentration than small molecules which partition, however they desorb more gradually than proteins. For this reasons, gradient elution is generally preferred for small peptide separations (
16,
19,
20 and
23).
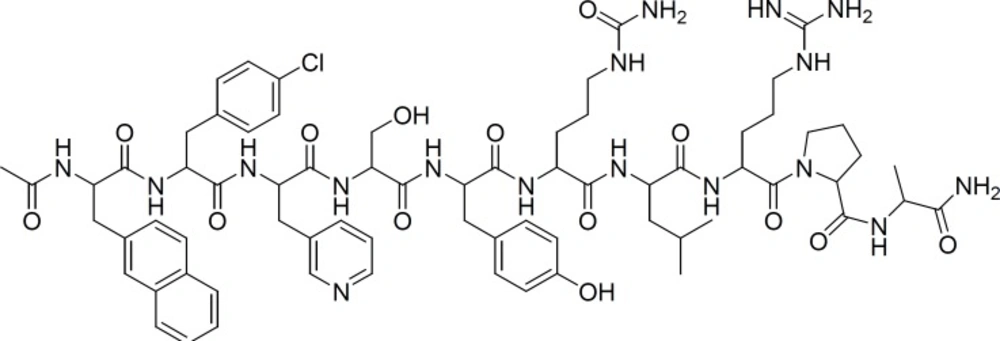
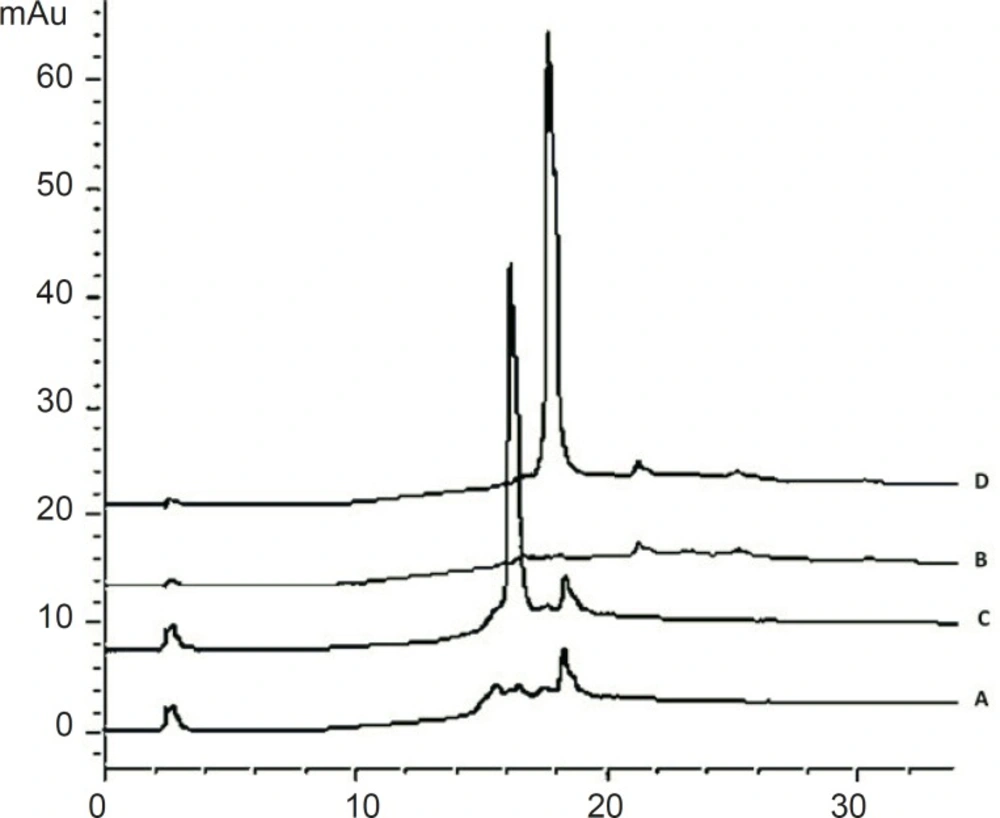
Cetrorelix is a small peptide (MW: 1431) with hybrid separation mechanism. The sensitivity of cetrorelix elution to the change in acetonitrile concentration per unit time is illustrated in
Figure 4. Large changes occur in the retention time of cetrorelix and base line flatness with relatively small changes in the acetonitrile concentration per unit time. The sensitivity of cetrorelix retention to subtle changes in the acetonitrile concentration makes isocratic elution difficult because the organic modifier concentration must be maintained very precisely.
Chromatograms of: (A) blank sample (deionized water) and (B) standard solution, 125 μg/mL cetrorelix as acetate (RT: 15.9 min) with gradient of 90% A for 5min, from 90% A to 70% B in 10 min, 70% B for 10 min – (C) blank sample (deionized water) and (D) standard solution, 125 μg/ mL cetrorelix as acetate (RT: 17.5 min) with gradient of 90% A for 5min, from 90% A to 70% B in 15 min, 70% B for 10 min
TFA sets the eluent pH and interacts with the peptide to enhance the separation. It is normally used at concentrations of about 0.1% (v/v). TFA concentrations up to 0.5% have been useful in solubilizing larger or more hydrophobic proteins and lower concentrations are occasionally used for tryptic digest separations (
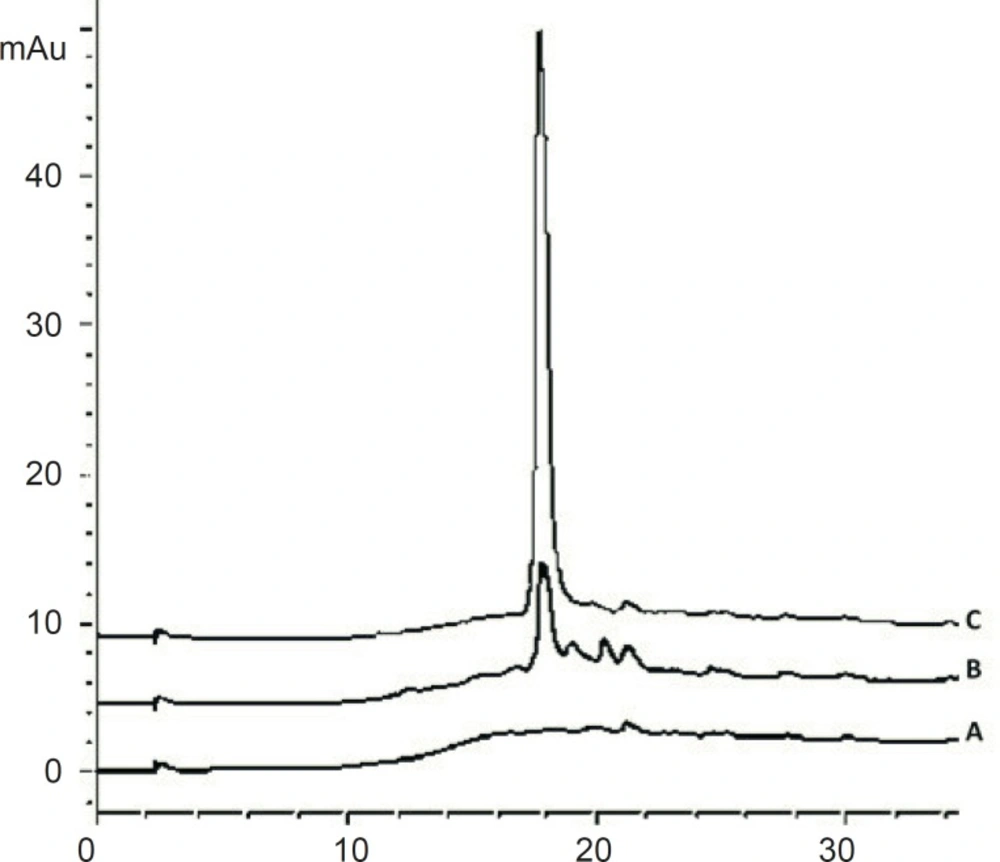
24). Using TFA concentration lower than 0.1 % in mobile phase will disturb the peak shape for cetrorelix (
Figure 5).
Chromatograms of: (A) blank sample (deionized water) (B) standard solution, 125 μg/mL cetrorelix as acetate in mobile phase with 0.05% TFA (C) standard solution, 125 μg/ mL cetrorelix as acetate in mobile phase with 0.1% TFA
In the current study in addition to the percentages of acetonitrile and concentration of the TFA, effects of re-equilibration time, gradient delay time and ramp time on the retention time and symmetry of peak were investigated. One factor at the time was varied while the others retained at a constant value.
Validation of the method
Specificity
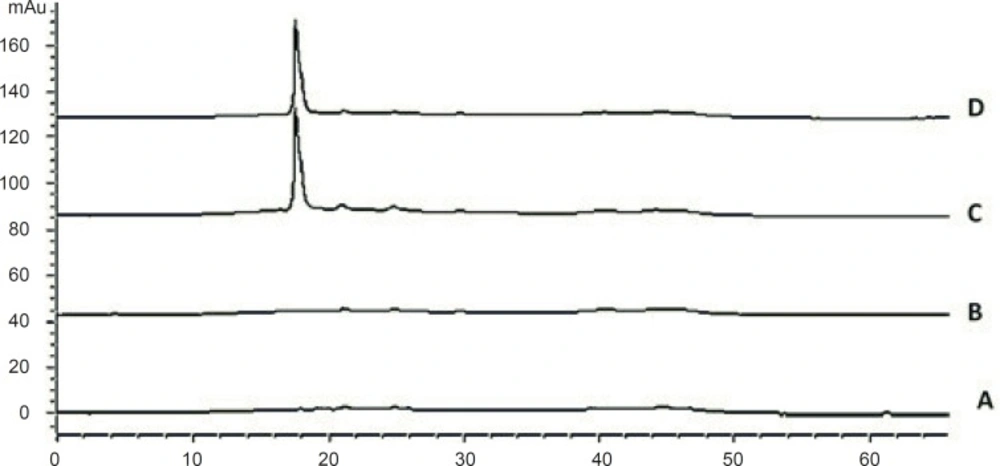
The peak purity was ensured by comparing the chromatogram of the cetrorelix standard samples with that of blank samples. The HPLC chromatograms were recorded for standard samples (aqueous cetrorelix solution) and assay samples (aqueous cetrorelix solution with mannitol) and their comparison revealed no peaks in the vicinity of cetrorelix retention time (around 17.7 minutes). No signs of interference with mannitol were detected in cetrorelix for injection formulation (
Figure 6).
Chromatograms of: (A) blank sample (deionized water) (B) blank sample (queous solution of mannitol, 54.8 mg/mL) (C) standard solution, 250 μg/mL cetrorelix as acetate (D) Assay sample solution (Cetrotide® 0.25 mg in 1 mL deionized water)
Linearity
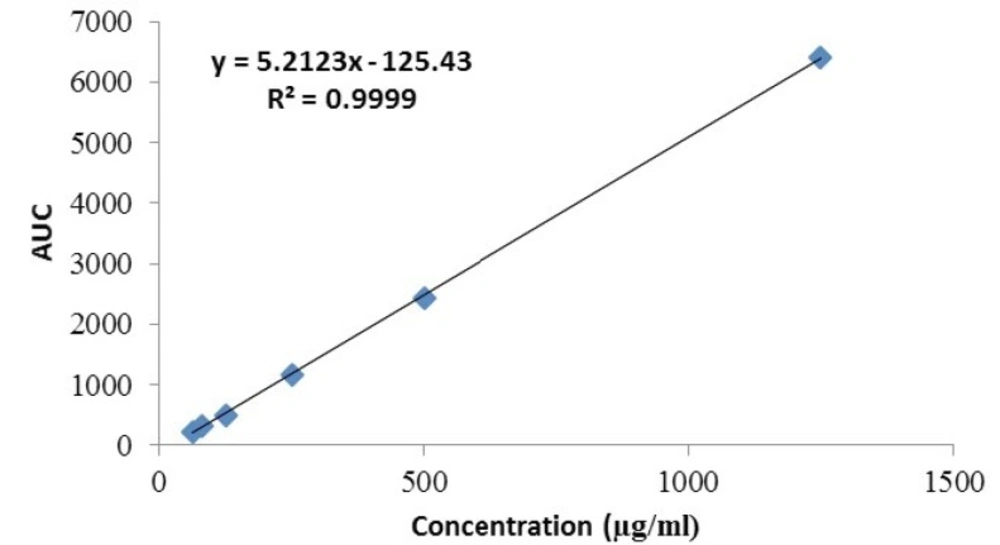
The linearity of the HPLC method used for cetrorelix assay was evaluated by injecting standard concentrations of cetrorelix drug substance. The plot was linear over the concentration range of 62.5 -1250 μg/mL yielding a regression equation Y= 5.2 X – 125.4 with a coefficient of correlation of 0.999 and with confidence intervals at p = 0.05 (
Figure 7).
Linearity plot for cetrorelix drug substance
Limit of quantitation and detection
The LOQ was found to be 62.5 μg/mL with signal to noise ratio of about 10. The recovery of quantitation level was 110% with an RSD less than 1.4 %, which met the validation criteria for recovery and precision.
Precision
The results obtained for inter- and intraday precisions are presented in
Table 1. Method precision has a RSD below 0.27% for Intraday and 1.60 % for interday precision, which comply with the acceptance criteria proposed (RSD < 2%) (
21 and
22).
Accuracy
Accuracy was determined by evaluating the recovery of analyte. The percent recovery between theoretical (Ctheo) and calculated (Ccalc) concentration was derived by the following equation:
Recovery (%) = Ccalc/Ctheo× 100
The accuracy of the QC samples ranged from 97 to 99%, indicating excellent accuracy of the proposed HPLC method (
Table 1).
| Theoretical concentration | Calculated concentration(mean±S.D., n=3) | Precision(R.S.D.) (%) | AccuracyRecovery % |
|---|
| Intraday |
|---|
| 125 | 121.6 ± 0.11 | 0.11 | 96.85 |
| 250 | 242.56 ± 0.40 | 0.17 | 97.03 |
| 500 | 485.13 ± 1.28 | 0.26 | 97.03 |
| Interday |
| 125 | 121.28 ± 1.90 | 1.56 | 97.02 |
| 250 | 243.46 ± 2.97 | 1.21 | 97.38 |
| 500 | 488.56 ± 5.57 | 1.14 | 98.69 |
Stability
Short-term stability: QC samples were kept at room temperature for 24 h and analyzed. The accuracy for samples ranged from 95 to 98 % after short term stability testing.
Long-term stability: QC samples were kept at – 20 oC for one week. These samples were thawed at room temperature and analyzed. The accuracy for samples ranged from 95 to 99 % after long term stability testing.
Freeze and thaw cycles: QC samples were prepared and frozen at −20 ◦C for 24 h. The samples were thawed at room temperature and analyzed. The samples were refrozen for 24 h under the same conditions. The freeze–thaw cycle was repeated two more times, and then analyzed on the third cycle. The accuracy for samples ranged from 94 to 99% after freeze thaw stability testing.
Standard stock solution stability: The standard stock solutions were found to be stable for one week when refrigerated at +4 oC. The concentration on comparison with freshly prepared standard after the storage was 98.70%.
Application of the method for the analysis of cetrorelix for injection formulation (Cetrotide® 0.25 mg)
The method was applied to assay cetrorelix in 10 samples of cetrorelix for injection formulation (Cetrotide® 0.25 mg). Peak areas of cetrorelix were measured and amount of drug was calculated from the respective calibration plots. The average assays (n = 10) was 101.52 ± 2.62.