

Introduction
Histamine is a hydrophilic biological amine which is widely distributed throughout the animal kingdom. Almost all mammalian tissues contain histamine in varying amounts and consistent with its wide tissue distribution, it involves in many important physiological functions such as allergic responses and regulation of gastric acid secretion (1). In the peripheral and central nervous systems, it functions as a neurotransmitter (2). The wide range of physiological effects of histamine resultfrom its recognition through specific cell-surface receptors belonging to the G-protein coupled receptors superfamily. Pharmacological investigations suggest the existence of multiple receptor subtypes for histamine. Up to now, four different receptors were cloned and designated histamine H1 to H4 receptor subtypes (3-6). Histamine H3 receptor identified in 1983, regulates the synthesis and release of histamine through a negative feedback mechanism (7). Histamine H3 receptors also modulate the release of several neurotransmitters such as glutamate, acetylcholine, noradrenaline, dopamine, GABA and serotonin. It has been suggested that the H3 receptor antagonists may play a role in the treatment of several neurological diseases such as epilepsy, obesity, arousal, attention-deficit hyperactivity disorder (ADHD), schizophrenia, Alzheimer’s and Parkinson’s diseases. Thus, finding the potent and efficacious H3 receptor antagonists have been the focus of several recent drug development programs (8-12).
Computer-aided drug discovery techniques have tremendous effect in shortening the process of drug discovery investigations (13, 14). Among different computational techniques, the quantitative structure-activity relationship (QSAR) methods are certainly the major factors in the contemporary drug design. Thus, it is quite clear why the industrial units are the prime users of the QSAR methods (15). Different two- and three-dimensional QSAR techniques, such as methods based on multiple linear regression (MLR), principal component analysis (PCA), artificial neural networks (ANN) (16), and 3D GRID-based methods, like hypothetical active site lattice (HASL) and comparative molecular field analysis (CoMFA), are used to quantitatively predict the desired properties. ANN is a learning system based on a computational technique, which attempts to simulate the neurological processing ability of the brain (17). Recently, evolutionary methods such as genetic algorithm (GA) have received increasing attention for variable selection. The 3D-QSAR methods apply empirical force field calculations on the three-dimensionally aligned ligand structures. The alignments are guided mostly based on the exploration of crystallographically solved ligand-receptor complexes or direct superpositioning of the ligands. CoMFA and HASL techniques are among many different available 3D-QSAR methods. CoMFA uses both interactive graphics and statistical techniques to correlate the shapes and properties of molecules with their biological activity (18, 19). HASL technique creates a QSAR model from a composite lattice generated from a series of regular orthogonal 3D grids established for each molecule (20, 21).
In the present work, different QSAR approaches, i.e., MLR, ANN and HASL were used to model the receptor binding affinities of the 58 arylbenzofuran derived H3 receptor antagonists and then the predictive power of the methods were compared.
Experimental
Biological data
Fifty-eight arylbenzofuran derivatives with histamine H3 antagonistic activities were used in QSAR analyses (Table 1). Their binding affinities to rat and human H3 receptors are shown in Tables 2 and 3 (22).
Molecular descriptors
Molecular descriptors were calculated as previously described (23). Briefly, the Hyperchem software (ver. 7.0) was used to generate 3D molecular structures and energy minimize them using MM+ force field (24). Then, the structures were fully optimized based on the semiemperical method, using AM1 level of theory (25). Hyperchem, Dragon (version 3.0) and ACDlabs suite of programs (ver. 6.00) were employed to calculate the molecular descriptors. HOMO and LUMO energies, molar refractivity, hydration energy, Log P, dipole moment, surface area and total energy were calculated using Hyperchem. From 1481 different 1D, 2D and 3D molecular descriptors calculated by Dragon software those descriptors having less than 0.95 correlation were retained for further analyses (26).
Other descriptors such as Log D at different pH values, pKa, molar volume, parachor, density, surface tension and Hansch substituent hydrophobicity constant (π) were computed using ACDlabs software.
Descriptor selection
In order to select the minimum number of molecular descriptors to be used in the modeling steps, the genetic algorithm coupled partial least square (GA-PLS) method of Riccardo Leardi was used in MATLAB environment (ver.7.0) with the following setup: population size, 30; probability of mutation, 0.01; probability of cross over, 0.5; number of runs, 100. As a result, about 10% of many descriptors (>1000) calculated by DRAGON, Hyperchem and ACDlabs suite of programs were selected (27, 28).
Table 1Chemical structures and molecular parameters of the arylbenzofuran derivatives used in the study.
| Compound | Benzofuran substituent | Phenyl substituent | E_HOMO | LogD (pH=7.4) | Mor19v | Mor30m | Mor18u | MAXDP | PSA |
|---|---|---|---|---|---|---|---|---|---|
| p1 | H | 4'-CN | -8.901 | 2.15 | 1.178 | 0.225 | -1.277 | 3.99 | 40.17 |
| p2 | H | 3'-CN | -8.876 | 2.91 | 1.022 | 0.224 | -1.249 | 5.19 | 52.53 |
| p3 | H | 4'-F | -8.730 | 2.76 | 0.972 | 0.162 | -1.561 | 4.73 | 25.61 |
| p4 | H | 3'-F | -8.798 | 2.85 | 1.001 | 0.217 | -1.153 | 2.55 | 36.61 |
| p5 | H | 4'-Cl | -8.725 | 3.40 | 0.965 | 0.151 | -1.441 | 4.29 | 16.38 |
| p6 | H | 3'-Cl | -8.783 | 3.39 | 0.897 | 0.208 | -1.587 | 2.56 | 16.38 |
| p7 | H | 2'-Cl | -8.711 | 3.31 | 0.871 | 0.223 | -1.485 | 5.82 | 16.38 |
| p8 | H | 4'-CF3 | -8.939 | 3.80 | 1.017 | 0.326 | -1.385 | 4.46 | 16.38 |
| p9 | H | 3'-CF3 | -8.894 | 3.80 | 1.077 | 0.292 | -1.252 | 2.54 | 16.38 |
| p10 | H | 4'-Me | -8.578 | 3.28 | 1.028 | 0.114 | -1.700 | 3.08 | 16.38 |
| p11 | H | 3'-Me | -8.630 | 3.28 | 1.095 | 0.123 | -1.240 | 2.55 | 36.61 |
| p12 | H | 2'-Me | -8.674 | 3.28 | 1.066 | 0.201 | -1.470 | 2.60 | 33.45 |
| p13 | H | 4'-OCF3 | -8.855 | 3.68 | 0.919 | 0.422 | -1.371 | 4.18 | 16.38 |
| p14 | H | 3'-OCF3 | -8.852 | 3.63 | 0.981 | 0.519 | -1.291 | 2.54 | 16.38 |
| p15 | H | 4'-OMe | -8.449 | 2.64 | 0.991 | 0.112 | -1.322 | 2.53 | 25.61 |
| p16 | H | 3'-OMe | -8.631 | 2.59 | 1.089 | 0.159 | -1.791 | 3.07 | 40.17 |
| p17 | H | 2'-OMe | -8.433 | 2.49 | 1.019 | 0.171 | -1.204 | 2.53 | 16.38 |
| p18 | H | 3'-Cl, 4'-Cl | -8.839 | 3.84 | 0.932 | 0.12 | -1.339 | 2.55 | 16.38 |
| p19 | H | 3'-Cl, 5'-Cl | -8.870 | 3.98 | 0.865 | 0.194 | -1.249 | 5.43 | 40.17 |
| p20 | H | 3'-Me, 4'-Me | -8.526 | 3.74 | 1.244 | 0.045 | -1.444 | 2.53 | 25.61 |
| p21 | H | 3'-Me, 5'-Me | -8.600 | 3.74 | 1.260 | 0.081 | -1.326 | 4.58 | 40.17 |
| p22 | H | 4'-COOMe | -8.860 | 2.70 | 1.015 | 0.116 | -1.523 | 4.96 | 16.38 |
| p23 | H | 3'-C(O)Me | -8.751 | 2.27 | 1.197 | 0.041 | -1.205 | 4.63 | 88.64 |
| p24 | H | 4'-CH2OH | -8.595 | 1.64 | 0.978 | 0.114 | -1.344 | 2.92 | 33.45 |
| p25 | H | 3'-CH2OH | -8.652 | 1.64 | 0.958 | 0.206 | -1.337 | 2.95 | 40.17 |
| p26 | H | 4'-Br | -8.789 | 3.73 | 0.954 | 0.286 | -1.344 | 2.55 | 16.38 |
| p27 | H | 4'-CN, 2'-Me | -8.880 | 2.61 | 1.136 | 0.299 | -1.301 | 3.05 | 36.61 |
| p28 | H | 4'-CN, 3'-Me | -8.870 | 2.61 | 1.263 | 0.257 | -1.085 | 3.08 | 40.17 |
| p29 | H | 4'-CN, 3'-F | -8.997 | 1.98 | 0.997 | 0.263 | -1.018 | 2.98 | 33.45 |
| p30 | 7-F | 4'-CN | -9.034 | 2.24 | 1.030 | 0.304 | -1.541 | 5.36 | 48.97 |
| p31 | 7-Me | 4'-CN | -8.857 | 2.61 | 1.131 | 0.241 | -1.362 | 2.97 | 36.61 |
| p32 | 6-Me | 4'-CN | -8.760 | 2.61 | 1.005 | 0.260 | -1.307 | 3.01 | 37.97 |
| p33 | H | 3'-CH(OH)Me | -8.604 | 1.98 | 1.012 | 0.113 | -1.36 | 3.10 | 40.17 |
| p34 | H | 3'-C(OH)Me2 | -8.560 | 2.33 | 1.255 | 0.186 | -1.36 | 5.39 | 85.48 |
| p35 | H | 3'-COOH | -8.832 | 2.77 | 1.037 | 0.253 | -1.34 | 2.57 | 16.38 |
| p36 | H | 3'-C(O)N(Me)OMe | -8.782 | 2.04 | 1.064 | 0.020 | -1.277 | 2.96 | 37.97 |
| p37 | H | 3'-C(O)Et | -8.743 | 2.80 | 1.376 | -0.033 | -1.45 | 5.00 | 68.41 |
| p38 | H | 3'-C(O)CH2CHMe2 | -8.745 | 3.68 | 1.518 | -0.002 | -1.521 | 3.93 | 40.17 |
| p39 | H | 3'-C(O)-(3''-F)C6H4 | -8.802 | 3.64 | 1.113 | 0.267 | -1.25 | 2.52 | 25.61 |
| p40 | H | 3'-CHO | -8.845 | 2.25 | 1.058 | 0.109 | -1.247 | 2.59 | 40.17 |
| p41 | H | 3'-C(=NOH)Me | -8.686 | 2.27 | 1.209 | 0.131 | -1.281 | 2.94 | 40.17 |
| p42 | H | 3'-C(=NOMe)Me | -8.667 | 2.80 | 1.280 | 0.024 | -1.314 | 3.33 | 37.97 |
| p43 | H | 3'-C(=NOEt)Me | -8.656 | 3.33 | 1.256 | 0.116 | -1.313 | 2.62 | 25.61 |
| p44 | H | 3'-C(=NO-Bu)Me | -8.642 | 4.02 | 1.451 | 0.147 | -1.315 | 2.58 | 16.38 |
| p45 | H | 4'-C(O)-c-Pr | -8.810 | 2.73 | 1.314 | 0.035 | -1.454 | 5.44 | 33.45 |
| p46 | H | 3'-C(O)-c-Pr | -8.735 | 2.64 | 1.410 | -0.037 | -1.005 | 4.28 | 53.31 |
| p47 | 3-I | 4'-CN | -9.042 | 3.18 | 1.035 | 0.208 | -1.557 | 4.74 | 33.45 |
| p48 | 3-Cl | 4'-CN | -8.951 | 2.75 | 0.966 | 0.103 | -1.361 | 3.82 | 33.45 |
| p49 | 3-Cl, 6-Cl | 4'-CN | -8.991 | 3.21 | 0.713 | 0.089 | -1.315 | 2.97 | 45.92 |
| p50 | 3-Br | 4'-CN | -9.006 | 2.92 | 1.160 | 0.209 | -1.252 | 6.54 | 40.17 |
| p51 | 3-Br | 4'-CN, 3'-Me | -8.989 | 3.38 | 1.270 | 0.286 | -1.472 | 3.17 | 53.68 |
| p52 | 3-Ph | 4'-CN | -8.682 | 3.91 | 0.831 | 0.386 | -2.101 | 3.09 | 40.17 |
| p53 | 3-(3'',5''-DiMeC6H3) | 4'-CN | -8.614 | 4.83 | 1.104 | 0.328 | -2.218 | 3.13 | 40.17 |
| p54 | 3-(3''-Pyridyl) | 4'-CN | -8.812 | 2.62 | 0.909 | 0.317 | -1.507 | 3.13 | 40.17 |
| p55 | 3-(2''-Furyl) | 4'-CN | -8.450 | 3.22 | 1.319 | 0.243 | -1.131 | 2.52 | 16.38 |
| p56 | 3-(3''-Thienyl) | 4'-CN | -8.497 | 3.59 | 1.043 | -0.001 | -1.195 | 5.08 | 42.68 |
| p57 | 3-(3''(2''CHO)Thienyl) | 4'-CN | -8.787 | 2.41 | 1.048 | 0.055 | -1.231 | 5.89 | 33.45 |
| p58 | 3-(3''(2''CH2OH)-Thienyl) | 4'-CN | -8.785 | 2.40 | 1.129 | 0.152 | -1.558 | 3.05 | 40.17 |
Table 2Observed binding affinitiesa, pKi(obs), of the substituted arylbenzofurans to the cloned human H3 receptors expressed stably in C6 cells. The pKi (pred)LGO values for MLR and ANN methods are the predicted affinities obtained in the leave-group-out cross validation study.
| Compound | pKi (obs)a | pKi (pred)LGO-MLR | pKi (pred)LGO-ANN | pKi (pred) 3D-method (MOE) | Compound | pKi (obs)a | pKi (pred)LGO-MLR | pKi (pred)LGO-ANN | pKi (pred) 3D-method (MOE) |
|---|---|---|---|---|---|---|---|---|---|
| p1 | 9.347 | 9.48 | 9.433 | 8.579 | p30 | 9.367 | 9.408 | 9.372 | 8.303 |
| p2 | 9.569 | 8.823 | 8.856 | 8.617 | p31 | 8.959 | 9.105 | 9.031 | 8.512 |
| p3 | 8.495 | 8.665 | 8.607 | 8.875 | p32 | 9.114 | 8.655 | 8.452 | 8.405 |
| p4 | 8.658 | 8.728 | 8.522 | 8.254 | p33 | 9.357 | 8.997 | 9.23 | 8.947 |
| p5 | 8.201 | 8.442 | 8.235 | 9.472 | p34 | 9.602 | 8.796 | 8.809 | 8.226 |
| p6 | 8.301 | 8.358 | 8.178 | 8.098 | p35 | 7.824 | 8.772 | 8.704 | 8.089 |
| p7 | 8.276 | 8.168 | 8.104 | 8.068 | p36 | 9.208 | 9.558 | 9.585 | 9.731 |
| p8 | 8.244 | 8.344 | 8.141 | 8.933 | p37 | 9.638 | 9.665 | 9.8 | 8.705 |
| p9 | 8.409 | 8.381 | 8.445 | 8.662 | p38 | 9.167 | 9.385 | 9.67 | 10.110 |
| p10 | 8.102 | 8.295 | 8.096 | 7.856 | p39 | 8.585 | 8.421 | 8.174 | 8.149 |
| p11 | 8.569 | 8.466 | 8.315 | 6.955 | p40 | 9.398 | 9.34 | 9.321 | 8.859 |
| p12 | 8.387 | 8.446 | 8.227 | 8.197 | p41 | 9.31 | 9.318 | 9.451 | 8.875 |
| p13 | 8.119 | 7.91 | 7.843 | 9.285 | p42 | 9.377 | 9.233 | 9.346 | 8.629 |
| p14 | 7.959 | 7.837 | 7.995 | 8.374 | p43 | 8.495 | 8.826 | 8.792 | 8.729 |
| p15 | 8.041 | 8.307 | 8.292 | 9.022 | p44 | 8.367 | 8.56 | 8.438 | 11.379 |
| p16 | 8.921 | 8.703 | 8.672 | 7.592 | p45 | 9.585 | 9.544 | 9.556 | 8.501 |
| p17 | 7.824 | 8.456 | 8.438 | 9.369 | p46 | 9.678 | 9.679 | 9.49 | 9.326 |
| p18 | 8.444 | 8.483 | 8.164 | 8.660 | p47 | 9.292 | 9.089 | 8.651 | 9.812 |
| p19 | 8.301 | 8.262 | 8.223 | 8.665 | p48 | 9.409 | 9.152 | 9.238 | 9.324 |
| p20 | 8.229 | 8.516 | 8.551 | 8.834 | p49 | 9.081 | 8.611 | 9.008 | 9.893 |
| p21 | 8.444 | 8.596 | 8.521 | 8.474 | p50 | 9.538 | 9.278 | 9.108 | 9.699 |
| p22 | 8.721 | 9.143 | 8.964 | 8.836 | p51 | 8.886 | 9.071 | 9.186 | 9.510 |
| p23 | 10.076 | 9.467 | 9.456 | 9.098 | p52 | 7.678 | 7.42 | 7.715 | 7.684 |
| p24 | 9.056 | 9.096 | 9.407 | 8.955 | p53 | 7.222 | 7.268 | 7.847 | 7.369 |
| p25 | 9.31 | 8.949 | 8.787 | 9.720 | p54 | 7.886 | 8.568 | 8.453 | 7.848 |
| p26 | 8.114 | 8.111 | 8.114 | 9.184 | p55 | 8.553 | 8.077 | 8.071 | 8.116 |
| p27 | 8.699 | 9.015 | 9.069 | 9.000 | p56 | 8.678 | 8.228 | 8.054 | 9.264 |
| p28 | 9.553 | 9.181 | 9.298 | 7.825 | p57 | 9.137 | 9.312 | 9.356 | 8.284 |
| p29 | 9.194 | 9.398 | 9.392 | 9.395 | p58 | 8.721 | 9.246 | 9.219 | 10.571 |
Table 3Observed binding affinitiesa, pKi(obs), of the substituted arylbenzofurans to the rat cortical H3 receptors. The pKi (pred)LGO values for MLR and ANN methods are the predicted affinities obtained in the leave-group-out cross validation study.
| Compound | pKi (obs)a | pKi (pred)LGO- MLR | pKi (pred)LGO-ANN | pKi (pred) 3D-method (Hyperchem) | Compound | pKi (obs)a | pKi (pred)LGO- MLR | pKi (pred)LGO-ANN | pKi (pred) 3D-method (Hyperchem) |
|---|---|---|---|---|---|---|---|---|---|
| p1 | 8.495 | 8.363 | 8.389 | 7.769 | p30 | 8.244 | 8.313 | 8.15 | 8.056 |
| p2 | 8.602 | 8.392 | 8.534 | 7.489 | p31 | 7.796 | 7.955 | 7.978 | 7.796 |
| p3 | 7.187 | 7.633 | 7.473 | 7.088 | p32 | 8.377 | 7.944 | 7.973 | 7.834 |
| p4 | 7.77 | 7.947 | 8.083 | 7.282 | p33 | 8.553 | 8.329 | 8.345 | 8.198 |
| p5 | 7.086 | 7.173 | 7.071 | 6.805 | p34 | 8.886 | 9.27 | 9.197 | 9.171 |
| p6 | 7.319 | 6.845 | 6.849 | 7.368 | p35 | 7.18 | 7.427 | 7.182 | 8.500 |
| p7 | 7.62 | 7.262 | 7.11 | 7.074 | p36 | 8.31 | 8.216 | 8.329 | 9.165 |
| p8 | 6.824 | 7.065 | 7.059 | 7.400 | p37 | 8.638 | 8.554 | 8.669 | 8.157 |
| p9 | 7.022 | 6.975 | 6.838 | 8.298 | p38 | 7.721 | 7.361 | 7.365 | 7.763 |
| p10 | 6.796 | 6.882 | 7.047 | 8.673 | p39 | 7.276 | 7.222 | 7.108 | 7.525 |
| p11 | 7.523 | 7.663 | 7.756 | 7.645 | p40 | 8.481 | 8.281 | 8.312 | 7.478 |
| p12 | 7.481 | 7.384 | 7.216 | 7.200 | p41 | 8.509 | 8.161 | 8.301 | 7.837 |
| p13 | 6.699 | 7.116 | 7.164 | 7.409 | p42 | 8.347 | 7.918 | 7.996 | 7.976 |
| p14 | 6.886 | 7.034 | 7.035 | 7.469 | p43 | 7.292 | 7.427 | 7.359 | 7.905 |
| p15 | 7.252 | 7.673 | 7.688 | 6.252 | p44 | 7.387 | 6.748 | 6.826 | 10.357 |
| p16 | 7.638 | 7.607 | 7.507 | 7.815 | p45 | 8.194 | 7.82 | 8.013 | 6.397 |
| p17 | 7.119 | 7.684 | 7.284 | 7.942 | p46 | 8.602 | 8.623 | 8.623 | 8.419 |
| p18 | 6.959 | 6.877 | 6.967 | 6.769 | p47 | 8.076 | 7.602 | 7.465 | 8.472 |
| p19 | 7.62 | 7.676 | 8.107 | 6.130 | p48 | 8.432 | 7.785 | 7.899 | 8.057 |
| p20 | 7.187 | 7.016 | 7.03 | 7.926 | p49 | 8.013 | 7.853 | 7.704 | 7.898 |
| p21 | 7.721 | 7.623 | 7.896 | 7.365 | p50 | 8.469 | 8.134 | 8.478 | 7.968 |
| p22 | 7.377 | 7.507 | 7.428 | 7.494 | p51 | 7.796 | 7.832 | 7.946 | 9.552 |
| p23 | 9.357 | 9.467 | 8.911 | 7.915 | p52 | 6.409 | 6.712 | 6.072 | 7.348 |
| p24 | 8.387 | 8.298 | 8.188 | 6.627 | p53 | 6.076 | 6.078 | 6.564 | 6.479 |
| p25 | 8.553 | 8.445 | 8.337 | 6.318 | p54 | 7.745 | 7.885 | 7.919 | 7.454 |
| p26 | 6.523 | 6.958 | 6.945 | 7.179 | p55 | 7.377 | 7.338 | 6.936 | 6.704 |
| p27 | 7.509 | 7.979 | 8.023 | 8.268 | p56 | 7.387 | 8.019 | 8.373 | 7.782 |
| p28 | 8.585 | 8.214 | 8.198 | 7.711 | p57 | 8.237 | 8.361 | 8.42 | 8.123 |
| p29 | 8.032 | 8.488 | 8.528 | 8.781 | p58 | 7.699 | 7.96 | 7.984 | 6.946 |
MLR model
The procedure for MLR method was performed using SPSS (ver 11.5) program as described previously (23). Briefly, the reduced data set was subjected to stepwise regression analysis to further select a limited number of descriptors significantly contributing to the prediction of binding affinities of H3 antagonists.
ANN model
A sigmoidal transfer function and descent gradient with momentum and adaptive learning rate back propagation was designed to predict the biological activities of H3 antagonists used in this study. The back-propagation learning algorithm is the most widely used training algorithm in multi-layered feed forward networks (17). All ANN calculations were carried out using MATLAB software with ANN toolbox for windows running on a Pentium 4 personal computer.
Before training process, the input and output values were normalized between 0.1 and 0.9. After simulation, the values of predicted data were transformed to the true values. The inputs and outputs for the ANN simulation were the values of the molecular descriptors selected by the MLR method and the pKi values, respectively. The number of neurons in hidden layer was varied ranging from 2 to 7, and the layer consisting of 5 neurons gave the optimum results. The training parameters used in this work were as follows: The training function was traingdm; learning rate = 0.1; momentum = 0.9; and the default values were accepted for the other parameters.
Method validation
Predictive power of the QSAR methods was assessed by leave group out cross validation technique and the q2 values were calculated using the following equation:
Here SSD is the sum of squared deviations for each actual activity value yi (pKi(obs)) from the average activity y, over the entire data set. PRESS, the predictive sum of squares, is the sum of the squared differences between the actual activity yi and the predicted activity ỹi (pKi(pred)).
Absolute percentage error (APE) of predictionwas calculated for each data point and averaged using the equations 2 and 3, respectively.
Here, pKi(pred) and pKi(obs) are predicted and observed binding affinities and n denotes the number of compounds. MAPE is the mean of APE values. Moreover, standard deviation of error of prediction (SDEP) was calculated to assess the distribution of error levels for rat and human data using the following equation:
3D-QSAR study
Histamine H3 antagonists were superimposed using following means. (i) Energy minimized molecules were superimposed using three atoms from arylbenzofuran substructure common to all molecules by Overlay option of Hyperchem program. (ii) Using MOE program (2007.09), one of the molecules was opened and then the second molecule was superimposed using all options set to default. In the subsequent stage, the previously opened and superimposed molecules were freezed and the third molecule was loaded and superimposed onto them. The process of freezing superimposed molecules and loading and superimposing a new molecules onto the previously opened molecules was continued until all molecules were superimposed. (iii) In a different strategy to method i and ii, we aimed to guide superpositioning of the ligands by taking into account their relative conformations after docking them into the binding site of the histamine H3 receptor molecular model developed elsewhere (23). Flexible docking of all compounds under the investigation was carried out using GOLD program (version 2.0) running on Windows XP. Then the HASL method (version 3.30) was used for the purpose of generating 3D-QSAR model using the ligands aligned according to the procedures outlined above (20, 21).The ligands randomly divided into the training and test compounds. The training set was used to generate a 3D-QSAR model in order to predict the biological activity of the test set compounds.
Results
Table 1 shows the chemical structures of 58 arylbenzofuran derivatives with H3 receptor antagonist activities used in this study. The table also contains the values for several molecular descriptors calculated for the structures. These descriptors were selected during the different steps of data reduction procedure using GA coupled PLS and MLR methods as outlined in Experimental section. The aim was to use not more than four descriptors in the models. The selected descriptors are the energy of highest occupied molecular orbital (EHOMO), apparent distribution coefficient at pH 7.4 (LogDpH=7.4) and two different 3D-MoRSE descriptors (Mor19V and Mor30M) for human data set and LogDpH=7.4, 3D-MoRSE descriptor (Mor18U), MAXDP topological descriptor and fragment-based polar surface area (PSA) for the rat data set. Equations 5 and 6 describe the ligand binding affinities to human and rat H3 receptors respectively based on the four selected molecular parameters for each correlation.
Here, n (number of data), r2 (squared correlation coefficient), F (f-value) and SE (standard error) are model statistics. The significance of these molecular descriptors in describing the observed binding affinities was discussed elsewhere (23).
To process the nonlinear relationships existed between the activity and the descriptors, the ANN modeling method was employed. It was generated by using the descriptors appearing in the MLR models as inputs. A 4-5-1 neural network was developed with the optimum momentum and learning rate of 0.9 and 0.1, respectively.
A leave-group-out (LGO) cross validation technique was performed to evaluate the predictive power of the MLR- and ANN-based QSAR methods used in this study.
The observed H3 receptor binding affinities of the ligands, pKi(obs), as well as their predicted activities using the leave-group-out cross validation method, pKi(pred), are listed in Tables 2 and 3 for human and rat data respectively. The q2LGO values obtained for MLR method of prediction are 0.70 and 0.79 for human and rat datasets, respectively (Table 4). Using the ANN method for prediction of the binding affinities, the q2LGO values are 0.65 and 0.77 for human and rat datasets, respectively. The MAPE and SDEP values shown in Table 4 were also used to compare the predictive capabilities of the MLR and ANN methods.
Results from different superimposition methods on the studied arylbenzofuran H3 antagonists are depicted in Figure 1. The aligned molecules were divided into training and test sets and then the 3D-QSAR model was developed using HASL method based on the training set compounds. The activity of the test compounds were predicted using the obtained 3D-QSAR models (Tables 2 and 3) and then the absolute percentage errors of predictions were calculated (Table 4). Few rounds of model development were performed and in each round the composition of the compounds in the training and test sets were changed so that all of the compounds were given chance to be used in the test set. The results indicate that the 3D-QSAR approaches used in this study were not successful in significantly predicting the biological activity of test set compounds.
Histamine H3 receptors are autoreceptors that negatively regulate the release of histamine and other neurotransmitters such as norepinephrine, dopamine, and acetylcholine in the CNS and are believed to play a variety of physiological roles, including regulation of feeding, arousal, cognition, pain, and endocrine systems (29-31). Using the histamine H3 receptor antagonist clobenpropit, a neuroprotective role for histamine H3 receptor was also reported due to increased GABA release (32). Since the discovery of histamine H3 receptor in 1983 and cloning of its cDNA in 1999, this histamine receptor has gained the interest of many pharmaceutical companies as a potential drug target for the treatment of various important disorders, including obesity, attention-deficit hyperactivity disorder, Alzheimer’s disease, schizophrenia, as well as for myocardial ischemia, migraine and inflammatory diseases (33). Consequently, many synthetic works were conducted leading to the preclinical development of structurally diverse H3 receptor antagonists as the potential treatment tools for the above mentioned disorders (8, 11, 34-38). However, the status of drug development based on histamine H3 receptor antagonists is far behind relative to that for the H1 and H2 receptors antagonists as successful blockbuster rugs for treating allergic conditions and gastric ulcers, respectively (39).
Table 4Comparison of the mean absolute percentage error (MAPE), standard deviation of error of prediction (SDEP) and q2LGOvalues calculated for the predictions of the binding affinities of arylbenzofuran derivatives to the human and rat H3 receptors by MLR and ANN methods.
| Statistical index | Human dataset | Rat dataset | ||||
|---|---|---|---|---|---|---|
| MLR | ANN | 3D-Method (MOE) | MLR | ANN | 3D-Method (Hyperchem) | |
| MAPE | 2.88 | 3.19 | 7.52 | 3.325 | 3.554 | 9.13 |
| SDEP | 0.331 | 0.359 | 0.86 | 0.311 | 0.92 | 0.92 |
| q2LGO | 0.7 | 0.65 | -0.97 | 0.79 | 0.77 | -0.79 |
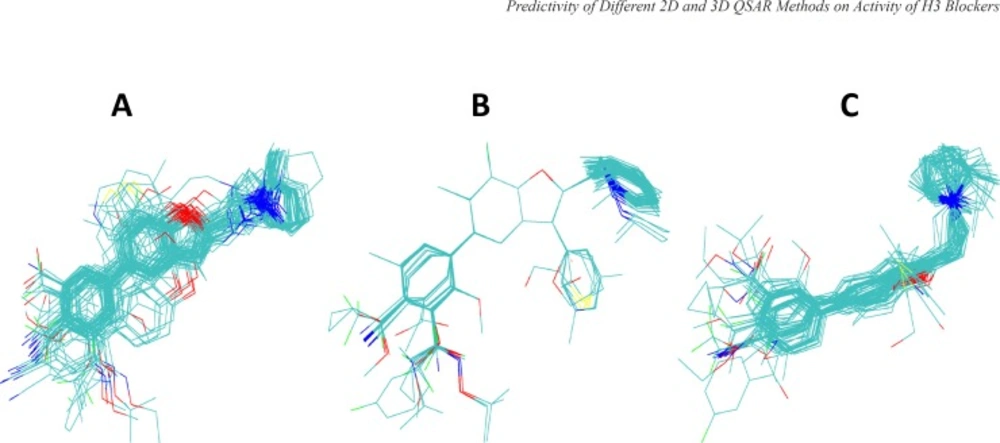
Figure 1
Alignments of arylbenzofuran derivatives generated by three different superpositioning approaches used in this study. Panel A shows the alignments obtained by flexible docking of molecules into the binding site of the structural model of histamine H3 receptor using GOLD program. Panel B and C are the results of superpositioning using HyperChem and MOE programs (see the text for further details).
The prediction of the biological activities of drug candidates is the main focus of many computer-aided drug discovery techniques. The pioneering works of generating quantitative structure-activity relationships were introduced by Hansch and coworkers in the form of MLR models. Since then many different QSAR methods were developed and used successfully in drug design and development. However, the MLR-based methods still remain one of the useful computational techniques in drug development. Here we report the QSAR studies on a set of arylbenzofuran H3 receptor antagonists using both 2D (i.e., MLR and ANN) and 3D (i.e., HASL) QSAR methods.
The purpose of QSAR studies is to select the biologically important structural descriptors and then identify the existing relations. We first used GA-PLS to reduce the number of structural features to a level manageable by MLR method. Then the MLR was used in the final feature selection step. The numbers of descriptors were kept to minimum of four in order to prevent over correlations (less than 1 descriptor per 10 compounds was selected). Equations 5 and 6 represent the MLR models generated using the four most relevant descriptors for human and rat datasets. Taking into account that the experimental procedures of obtaining the receptor affinities (pKi) for human and rat datasets are not the same and the H3 receptors for human and rat are not totally identical, the MLR models presented in equations 5 and 6 are reasonably similar. In our previous study we demonstrated the validity of the selected descriptors in modeling the H3 antagonist activities of the used compounds and the results were in agreement with the results of molecular modeling/ligand docking studies (23). The EHOMO in equation 5 may indicate presence of charge transfer interaction between the benzofuran attached phenyl group of the ligands and an aromatic residues from the receptor. In equation 6, the positive model constant for MAXDP is indicative of a positive relationship between electrophilicity of the polar moieties of the molecule and the binding affinities to the receptor, which could be related to the charge transfer capability of the molecule and be considered as a descriptor equivalent to EHOMO in equation 5. In both equations 5 and 6 the relative hydrophobicity of the compounds (Log DpH=7.4) is inversely related to the binding affinity. Different 3D-MoRSE descriptors, namely Mor19V , Mor30M and Mor18U, were included in MLR equations 5 and 6. These descriptors are related to the 3D structures of the molecules and based on the weighting used in their calculations they are related to the volume or mass of molecules. It seems that the bigger the substituents of the molecule the higher the affinity to the H3 receptors. ANN analyses were also performed using the same set of descriptors as in the MLR method. The predictivities of MLR and ANN methods were compared using leave-group-out cross validation technique. The calculated cross-validation q2LGOcoefficients as well as the MAPE and SDEP values for both MLR and ANN analyses are comparable as shown in Table 4. The statistical treatment of the results shows that there is no significant difference between the MAPE values obtained for human dataset using MLR and ANN methods (p-value of 0.22 for the paired two-tailed t-test for the means). The same is also true for the rat dataset (p-value 0.43). There are also no statistically significant differences between the variances of the errors of the predictions obtained by MLR and ANN methods for either human or rat datasets. From the numerically small values of SDEP it can be inferred that the errors are small and their distribution is not scattered.
In order to perform 3D-QSAR analysis using HASL algorithm, first the ligands were aligned using three different approaches, as mentioned in Materials and Methods. Briefly, in the first approach, Hyperchem were applied to align energy minimized molecules by superimposing three atoms selected from arylbenzofuran moiety common to all compounds. In this method molecules were kept rigid. In the second approach, MOE program was used for flexible alignment of ligands based on all available similarity terms, such as, hydrogen bond donor and acceptor, aromaticity, hydrophobicity, and partial charges. Thirdly, we used docking approach to deduce relative conformational and geometrical position of different ligands while bound to their binding site on the model built for H3 receptor in the previous study (23). The aligned ligands and their corresponding activity values were fed into HASL program to generate QSAR model. The predictive power of the 3D-QSAR model developed using the test set compounds was very poor. The calculated MAPE and SDEP values for the test compounds of human data set were 9.39 and 1.00, respectively and for rat data set these values calculated to be 10.50 and 0.96, respectively. Low level of predictive power of 3D-QSAR analyses can be related to the shortcomings of the 3D-QSAR based on the theoretical structure that we have used for the docking-guided alignment procedure in the current study in the absence of experimentally derived structure for hH3 receptor. However, other alignment protocols explained above also did not lead to the satisfactory results. Thus, one might relate the lack of predictivity seen in the current 3D-QSAR study to the method which has been used for the construction of 3D models (i.e., HASL). Reinvestigation of the 3D analyses using other methodologies such as CoMFA, may reveal more useful information.
In summary, the results of the current study demonstrate that the both MLR and ANN methods perform equally well in predicting the receptor binding affinities of the arylbenzofuran derived histamine H3 receptor antagonists. Although by just considering the numerical values of q2LGO , MAPE and SDEP it seems that MLR performs marginally well, however, this is not statistically appreciable. Both of these 2D-QSAR methods were superior to HASL, a 3D-QSAR method, in predicting the activity of the arylbenzofuran H3 antagonists. The results presented in the current comparative study indicate that the application of more sophisticated and advance methods in QSAR studies does not guarantee the best predictive outcome. In many cases, like the one presented in this work, much simpler and vastly available techniques such as MLR, can predict the property of interest (e.g., biological activity) equally well or even better than advance methods, such as ANN and 3D based approaches.
