Introduction
Deferiprone or 1,2-dimethyl-3-hydroxypyrid-4-one (Figure 1) is an active iron chelator and superoxide radical scavenger which belongs to the new class of chelating agents, i.e. alpha-ketohydroxypyridines. Iron overload which can occur as a consequence of chronic transfusion therapy in patients with β-thalassemia and sickle cell diseases or due to excessive dietary iron uptake in patients with chronic anemia and hereditary hemochromatosis, causes organ damages and its chelators such as deferiprone (DFP) should be used to remove excess iron from various parts of body (1-5). Intestinal absorption of DFP and one of its analogs was investigated by Taher et al. (6). DFP and other chelators could be used to complex cations other than iron which are used for different purposes in biomedical sciences. Zinc complexes of DFP and some related compounds were synthesized and further investigated to improve the bioavailability of zinc after oral administration (7).
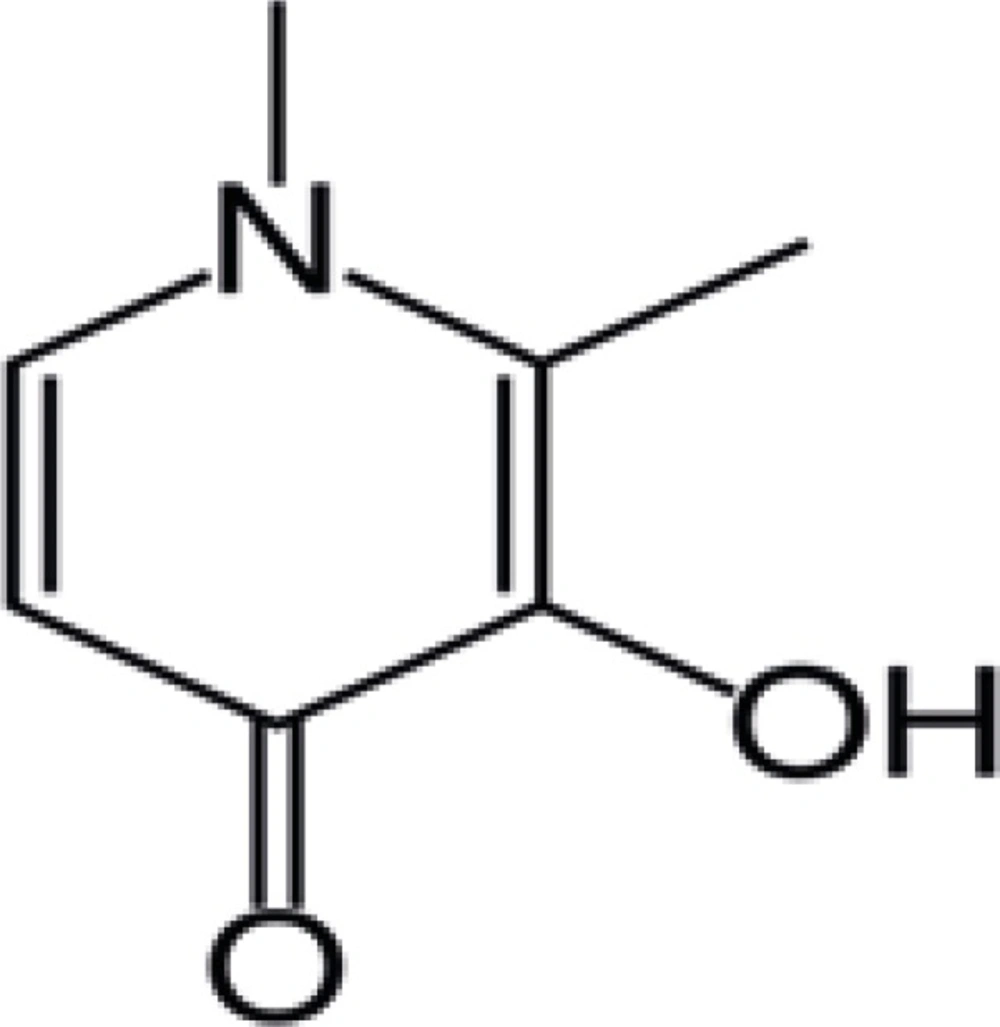
Figure 1
Chemical structure of deferiprone
Complexes of trivalent lanthanide ions-especially terbium ions (Tb3+)- with appropriate ligands have attracted more attention in recent years. Tb3+ ions have specific physicochemical properties because of their electronic structure, which is made these ions useful probes and sensors in chemical and biomedical analyses. The electron transition in the 4f shells is responsible for the narrow emission bands in NIR to UV range with long emission lifetimes, large Stock’s shifts (> 200 nm) and μs-luminescence decay times (8-14).
The lanthanide sensitized luminescence is a highly selective method because when lanthanide ions form chelate with certain organic ligands, characteristic emission spectra are obtained. These ions, as analytical reagents, are stable and can form stable luminescent complexes with ligands and have poor absorption in the gastrointestinal tract and cannot penetrate living cells when injected (11). Due to these characteristics, Tb3+ ions are widely employed in some applications, such as the investigation of the function of nucleic acids, immunoassays, direct determination of organic compounds and detection of analytes in chromatographic and electrophoretic methods (11-17).
Few methods such as HPLC (4), and voltammetry (3, 18, 19), have been developed for determination of DFP in biological fluids and tablets. In this study, a terbium sensitized luminescence method based on the formation of Tb3+-DFP complex in aqueous solution is developed and successfully applied to analyze DFP tablet contents.
Experimental
Reagents and solutions
All chemicals and solvents were of analytical reagent grade. Double distilled water was used throughout. A 10−2 M of Tb3+ solution was prepared by dissolving the appropriate amount of Tb3+ chloride hexahydrate (TbCl3.6H2O) (Acros Organics, New Jersey, United States) in double distilled water and stored in polyethylene containers to avoid memory effects of terbium adsorbed on glass vessels.
A stock solution (1000 μg/mL) of DFP (Arasto Pharmaceutical Company, Tehran, Iran) was prepared via dissolving in absolute ethanol and stored at room temperature. A 0.01 M Tris-(hydroxymethyl)aminomethan–hydrochloric acid (Tris–HCl) buffer solution was prepared by dissolving a desired amount of Tris–HCl (Merck, Darmstadt, Germany) in water, making up the volume to 100 mL with water. Working standard solutions were prepared daily through dilution of the stock standard solutions with water. DFP (500 mg) tablets were purchased from a local pharmacy store with the trademark of Avicenna Laboratories (Tehran, Iran).
Apparatus
Luminescence spectra and intensity measurements were performed by means of a JASCO FP-750 Spectrofluorometer (Tokyo, Japan) equipped with a 150 W xenon lamp and 1.0 cm quarts cells. The excitation and emission monochromator bandwidths were 10 nm. The excitation wavelength was set at 295 nm and the luminescence was measured using the peak height at 545 nm. All measurements were performed at 0 ± 0.1°C using a Peltier thermostated cell holder (Tokyo, Japan). The pH of the solutions was measured with Metrohm model 744 pH meter (Herisau, Switzerland).
Experimental procedure
To 10 mL tubes, solutions were added in the following order: 3 mL from 1 × 10⁻³ M Tb3+ solution, 0.5 mL from 0.1M buffer solution and suitable aliquots of DFP solution. The mixture was diluted to the mark with double distilled water. The luminescence intensities (F) were measured at λex/λem= 295/545 nm. All measurements were the average of three replicates.
Method validation
The method validation included accuracy, precision, linearity, limit of detection, limit of quantification and stability.
Linearity was evaluated by analyzing standard solutions of DFP in the range of 7.2 × 10⁻⁹ to 1.4 × 10⁻⁵ M. The luminescence intensities were plotted versus DFP concentrations in samples and the calibration equation was obtained by linear regression analysis.
The detection and quantification limits calculated as 3Sb/m and 10 Sb/m respectively, where Sb is standard deviation of 10 blank samples luminescence intensities and m is slope of calibration graph.
The precision of the method was assessed through intra-day and inter-day precisions. For intra-day precision, 6 repeated analyses of standard solutions, at the concentrations of 0.072 × 10⁻⁶, 7.2 × 10⁻⁶ and 13.0 × 10⁻⁶ M performed. Inter-day precision was evaluated by repeated analyses performed on 3 days using the same samples, then relative standard deviations (RSDs) were calculated.
Accuracy was expressed as percent of deviation between the true and measured values and recovery was expressed as a percent of the obtained value to real value of the sample. To assess the accuracy and recovery, replicate analyses of standard solutions, at the concentrations of 0.072 × 10⁻⁶, 7.2 × 10⁻⁶ and 13.0 × 10⁻⁶ M were performed.
For the determination of short term room temperature stability, three samples at the concentrations of 0.072 × 10⁻⁶, 7.2 × 10⁻⁶ and 13.0 × 10⁻⁶ M were prepared and kept at room temperature (23 ± 2 °C) for 12 hours, after this period samples were analyzed, then the samples luminescence intensities were compared with those of the fresh stock solutions. For evaluation of stock solution stability, stock samples were prepared and kept at room temperature for 6 hours, then samples prepared and refrigerated for 7 days, then samples were analyzed and the luminescence intensities were compared with the fresh stock solutions.
Sample preparation
Ten DFP tablets were ground into homogenized powder. Then 0.8160 g powder, corresponding to one tablet, was dissolved in about 10 mL of absolute ethanol in a small beaker. The solution was filtered, the residue was washed with ethanol several times, and then diluted with ethanol to 100 mL. Working solution was prepared by appropriate dilution of this sample solution, so that the final concentration was within the linear range.
Results and Discussion
Spectral analysis
Luminescence spectra
Luminescence emission and excitation spectra of Tb3+–DFP are shown in Figure 2.
![Luminescence excitation (A) and emission (B) spectra of: Tb<sup>3+</sup>-DFP complex. Experimental conditions: [Tb<sup>3+</sup>] = 10<sup>5-</sup> M; [DFP] = 7.2 × 10 <sup>-6</sup> M; pH = 7.5; λ<sub>ex</sub> /λ<sub>em</sub>=295 nm/545 nm](https://brieflands.com/journals/ijpr/articles/125818/figures/ijpr-11-771-g002-preview.webp)
Figure 2
Luminescence excitation (A) and emission (B) spectra of: Tb3+-DFP complex. Experimental conditions: [Tb3+] = 105- M; [DFP] = 7.2 × 10 -6 M; pH = 7.5; λex /λem=295 nm/545 nm
Solutions containing only Tb3+ or DFP did not show any measurable luminescence with excitation at 295 nm. Under the same conditions, the characteristic luminescence spectrum of Tb3+-DFP was observed, with two emission peaks at 545 nm and 490 nm. These peaks are the characteristic luminescence peaks of Tb3+ and correspond to 5D4→7F6 and 5D4→7F5 transitions, respectively, of which the emission at 545 nm is much stronger. The luminescence intensity was proportional to the concentration of DFP.
Absorption spectra
Absorption spectra of Tb3+ (spectrum 5, [Tb3+]= 10-4 M), DFP (spectra 1 and 2, [DFP]=2.85 × 10⁻⁵ M and [DFP]=2.85 × 10⁻⁵ M) and Tb3+-DFP (spectra 3 and 4, [Tb3+]= 10-4 M + [DFP]=2.85 × 10⁻⁵ M and [Tb3+]= 10-4 M + [DFP]=1.44 × 10⁻⁵ M) are shown in Figure 3. It can be seen that after addition of Tb3+ into the DFP solution, a small red shift occurred in the maximal absorption peak, which is due to the formation of Tb3+-DFP complex.
![Absorption spectra of DFP in different systems (background correction was done by using a reference solution): DFP (1, 2);.)Tb<sup>3+</sup>-DFP (3, 4) and Tb<sup>3+</sup>(5). Conditions: [Tb<sup>3+</sup>] = 1.0 × 10 <sup>-4</sup> M, [DFP] =2.87 × 10 <sup>-5</sup> M (1, 3), 1.44 × 10 <sup>-5</sup> M (2, 4).](https://brieflands.com/journals/ijpr/articles/125818/figures/ijpr-11-771-g003-preview.webp)
Figure 3
Absorption spectra of DFP in different systems (background correction was done by using a reference solution): DFP (1, 2);.)Tb3+-DFP (3, 4) and Tb3+(5). Conditions: [Tb3+] = 1.0 × 10 -4 M, [DFP] =2.87 × 10 -5 M (1, 3), 1.44 × 10 -5 M (2, 4).
Factors affecting the luminescence intensity of the system
Effect of pH
A series of Tris buffer solutions with different pH values but the same concentrations of other reagents together with corresponding blank solutions were prepared and their luminescence signals were measured at λex/λem= 295 nm/545 nm. As shown in Figure 4, the luminescence intensity of Tb3+–DFP complex strongly depended on pH and reached a maximum value at 7.5. Thus, pH 7.5 was selected for the following experiments.
![Effect of pH, conditions: [Tb<sup>3+</sup>] =10<sup>-5</sup> M, [DFP] = 7.2 × 10 <sup>-6</sup> M, λ<sub>ex</sub> /λ<sub>em</sub>=295 nm/545 nm](https://brieflands.com/journals/ijpr/articles/125818/figures/ijpr-11-771-g004-preview.webp)
Figure 4
Effect of pH, conditions: [Tb3+] =10-5 M, [DFP] = 7.2 × 10 -6 M, λex /λem=295 nm/545 nm
Effect of buffer concentration
The effect of different concentrations of buffer on the luminescence intensity of the system is shown in Figure 5. At lower concentrations of Tris, the OH groups of water molecules surrounded the terbium ions and actrd as effective luminescence quenchers due to OH oscillation, thus leading to a decrease in the luminescence intensity. As the concentration of buffer is increased, Tris ligands might prevent Tb3+ ion from coordinating water around and so the luminescence intensity is increased. The results indicated that 0.5 mL of 0.1 M Tris–HCl buffer solution in 10 mL mixture was the optimum buffer volume.
![Effect of buffer concentration, conditions: [Tb<sup>3+</sup>] =10<sup>-5</sup> M, [DFP] = 7.2 × 10 <sup>-6</sup> M, pH=7.5.](https://brieflands.com/journals/ijpr/articles/125818/figures/ijpr-11-771-g005-preview.webp)
Figure 5
Effect of buffer concentration, conditions: [Tb3+] =10-5 M, [DFP] = 7.2 × 10 -6 M, pH=7.5.
Effect of terbium (III) concentration
The effect of Tb3+ concentration on the luminescence intensity of Tb3+–DFP system was studied when the pH and concentration of buffer got fixed at 7.5 and 0.005 M . The results are shown in Figure 6.
![Effect of terbium (III) concentration, conditions: [DFP] = 7.2 × 10 <sup>-6 </sup>M, pH = 7.5](https://brieflands.com/journals/ijpr/articles/125818/figures/ijpr-11-771-g006-preview.webp)
Figure 6
Effect of terbium (III) concentration, conditions: [DFP] = 7.2 × 10 -6 M, pH = 7.5
It can be seen that luminescence intensity was the highest when the concentration of Tb3+ in the mixture was 3.0 × 10⁻⁴ M. Therefore, the concentration of Tb3+ in the mixture was chosen at 3.0 × 10⁻⁴ M for further investigations. The stoichiometry of the complex was studied using Job’s method, i.e. equal concentration of Tb3+ and DFP were used. The ratio of molar fraction Tb3+: DFP was varied and luminescence intensity of the complex was recorded. The maximum intensity was obtained at a mole fraction of 0.25 (Figure 7), thus a stoichiometry of Tb3+: DFP achieved as 1:3. The complex formation constant was calculated using a method described elsewhere (20) and was 1.6 × 10¹⁶.
![Determination of the stoichiometry of the terbium (III), conditions: DFP complex using Job’s method; [DFP] and [Tb<sup>3+</sup>] = 3.0 × 10<sup>-4</sup> M, pH=7.5](https://brieflands.com/journals/ijpr/articles/125818/figures/ijpr-11-771-g007-preview.webp)
Figure 7
Determination of the stoichiometry of the terbium (III), conditions: DFP complex using Job’s method; [DFP] and [Tb3+] = 3.0 × 10⁻⁴ M, pH=7.5
Effect of temperature
Temperature had great influence on the luminescence intensities of this system. The luminescence intensity sharply decreased with temperature from 0°C to 60°C. Therefore, 0°C was selected for further study (Figure 8).
![Effect of temperature, conditions: [Tb<sup>3+</sup>] =3 × 10<sup>-4</sup> M, [DFP] = 7.2 × 10 <sup>-6</sup> M, pH = 7.5](https://brieflands.com/journals/ijpr/articles/125818/figures/ijpr-11-771-g008-preview.webp)
Figure 8
Effect of temperature, conditions: [Tb3+] =3 × 10⁻⁴ M, [DFP] = 7.2 × 10 -6 M, pH = 7.5
Effect of time
Under the optimum conditions, the effect of time on the luminescence intensity was studied at 0°C. The results showed that the luminescence intensity is stable at the first 25 min after addition of all reagents. In this study, 3 min was set as the optimum value for all luminescence intensity measurements (Figure 9).
![Effect of time, conditions: [Tb<sup>3+</sup>] = 3 × 10<sup>-4</sup>M, [DFP] = 7.2 × 10 <sup>-6</sup> M, pH = 7.5](https://brieflands.com/journals/ijpr/articles/125818/figures/ijpr-11-771-g009-preview.webp)
Figure 9
Effect of time, conditions: [Tb3+] = 3 × 10⁻⁴M, [DFP] = 7.2 × 10 -6 M, pH = 7.5
Effect of the order of addition
Finally, the effect of the order of addition was tested. For this purpose, series of solutions with different addition orders of reagents were measured at λex/λem = 295 nm/545 nm. Based on the results, we selected Tb3+, Tris_HCl, and DFP as the best order for this assay.
Analytical figures of merit
Under the optimal conditions, calibration graph for the determination of DFP was constructed. The linearity parameters for DFP are shown in Table 1. Results of linearity evaluation indicated that, this method was linear in the range of 7.2 × 10⁻⁹ to 1.4 × 10⁻⁵ M for determination of DFP in aqueous solutions with a correlation coefficient of 0.999. The detection and quantification limits calculated from calibration graphs, are also given in Table 1.
Table 1
Linearity parameters of the method in standard solution
| Data pointa | Slope | Y-intercept | rb | Range | LODc | LOQc |
|---|---|---|---|---|---|---|
| 13 | 2.56 × 10⁷ | 2.413 | 0.999 | 7.2 × 10⁻⁹ to 1.4 × 10⁻⁵ | 6.3 × 10⁻⁹ | 2.1 × 10⁻⁸ |
Details of the analytical performances of the previously reported methods and the proposed method for the determination of DFP are summarized in Table 2. Compared with the previous methods, the proposed method is simple and has relatively lower detection limit and lower linearity range.
Table 2
Comparison of the proposed method with other methods used for determination of deferiprone.
| Method | Linear range | Detection limit | Reference |
|---|---|---|---|
| HPLC | 3.5 × 10⁻⁶-1.4 × 10⁻⁵ | 3.5 × 10⁻⁷ | 4 |
| Voltammetry | 9.9 × 10⁻⁵-5.3 × 10⁻⁴ | 1.9 × 10⁻⁵ | 19 |
| Cyclic voltammetry | 3.0 × 10⁻⁵-1.0 × 10⁻³ | 1.4 × 10⁻⁵ | 3 |
| Cyclic voltammetry | 5.0 × 10⁻⁵-1.0 × 10⁻³ | 5.3 × 10⁻⁷ | 18 |
| Terbium sensitized luminescence | 7.1 10-9-1.4 × 10⁻⁵ | 6.3 × 10⁻⁹ | This work |
The results for precision, accuracy and recovery of the method respectively were given in Tables 3 and 4; these results illustrated that the proposed method is accurate and precise for determination of DFP.
Table 3
Precision (RSD %) of the method obtained for standard solutions
| Concentration (×10-6) | |||||
|---|---|---|---|---|---|
| 0.072 | 7.20 | 13.0 | |||
| Intra-day | Inter-day | Intra-day | Inter-day | Intra-day | Inter-day |
| 2.9 | 4.8 | 2.1 | 1.3 | 1.2 | 1.3 |
Table 4
Accuracy and recovery of the developed method in standard solutions
| Accuracy | Recovery | ||||
|---|---|---|---|---|---|
| Concentration (×10 -6 M) | |||||
| 0.072 | 7.20 | 13.0 | 0.072 | 7.20 | 13.0 |
| 4.80 | 1.25 | 1.31 | 100.3 | 100.1 | 102.3 |
The stability data for the proposed method was shown in Table 5 and the results indicated that, it is stable in short term room temperature and in stock solutions.
Table 5
Details of the stability of the proposed method for three concentrations investigated
| Short term room temperature stability | Stock solution stability | ||||||
|---|---|---|---|---|---|---|---|
| Concentration (×10 -6 M) | 0.072 | 7.20 | 13.0 | 0.072 | 7.20 | 13.0 | |
| Recovery % | 98.9 | 100.6 | 103.1 | 93.0 | 98.6 | 101.0 | |
| RSD % | 3.5 | 2.3 | 1.2 | 4.4 | 1.7 | 1.2 | |
Analytical application
Determination of DFP in tablets
The developed method was applied to the determination of DFP in tablets prepared according to the sample preparation procedure. For the assay of DFP, the samples must be diluted properly within the linear range of the determination of DFP and the sample solution was analyzed , using the standard calibration method. Label claim of each DFP tablet is 500 mg, and the measured amount of DFP in tablet was 503.3 ± 2.7 mg. The relative standard deviation for determination of DFP in tablets was 2.2% and the obtained recovery was 97.3-102.7%.
Conclusion
In this study, a new spectrofluorimetric method was developed for the determination of trace amounts of DFP. DFP which can form a complex with Tb3+ and remarkably enhance its luminescence intensity at 545 nm. The enhanced luminescence intensity is proportional to the concentration of DFP. The results illustrated that, the proposed method was linear, accurate, precise and stable for determination of DFP in aqueous solutions. This method has been successfully applied to the determination of DFP in tablet samples. In addition to lower LOD of the proposed method in comparison with the HPLC and voltammetric methods, its simplicity could be considered as its main advantage. It requires just simple dilution of the sample and no further pre-treatment is required using the proposed method which is an important parameter especially in the routine application of the method where huge number of samples should be analyzed every day. This is not the case for the previously reported analytical methods.