Preparation of samples
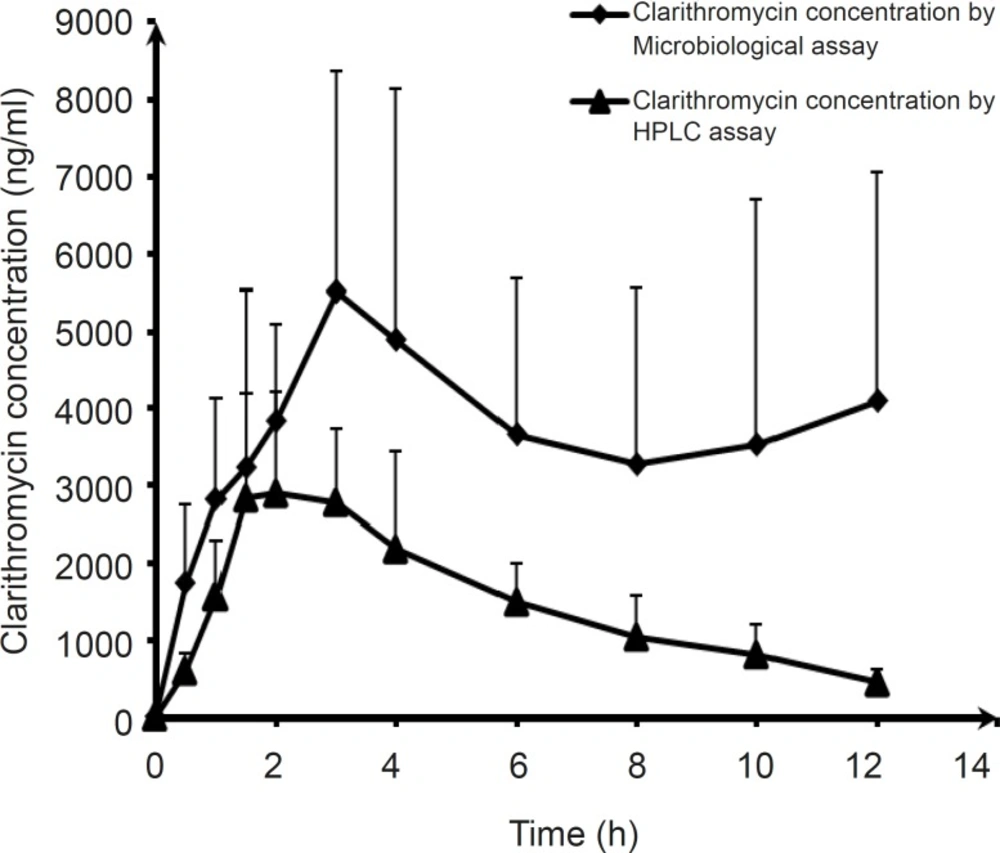
Plasma samples used were from six healthy male volunteers aged between 21 and 37 years and weighing from 56 to 90 Kg. None of them had a history of hypersensitivity to medications. This study was carried out in accordance with the guidelines of the Declaration of Helsinki (World Medical Assembly 1964) as revised in Edinburgh. The study protocol was approved by the ethics committee of Tabriz University of Medical Sciences. An equivalent 500-mg dose of clarithromycin (Klacid® suspension, containing 125 mg of clarithromycin per 5 mL, Abbott Laboratories LTD, Italy. Batch number: 38398TF01) was given orally to each subject as a single dose with 200 mL of water. The subjects were allowed to have breakfast (a snack) after two hours. Five milliliters of blood were drawnat 0, 0.5, 1, 1.5, 2, 3, 4, 6, 8, 10, 12 and 24 h after each administration. The blood samples were taken from subject’s forearm veins. All samples were centrifuged in heparinated tube. The plasma samples were separated and kept frozen at a temperature below -20 °C for subsequent analysis.
I) Bioassay
Preparation of references substance
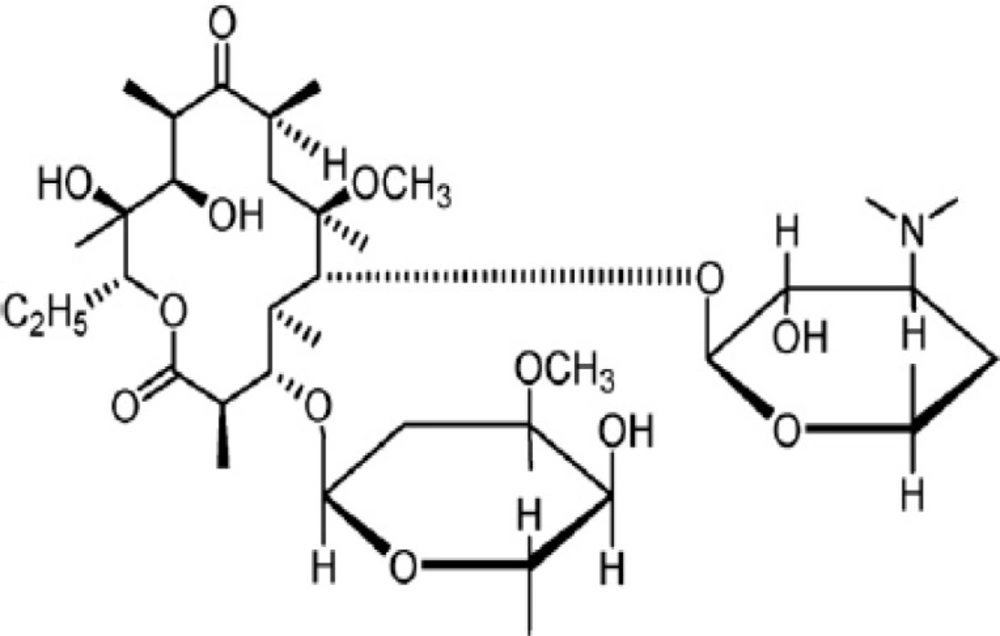
A quantity of clarithromicin reference substance (Elder Pharmaceuticals LTD, India) equivalent to 50 mg of clarithromicin was accurately weighed and transferred to a 50 mL volumetric flask. Methanol was added to make up volume in order to give a final concentration of 1 mg/mL. From this solution, the stock concentration of 3000 ng/mL in blank plasma was prepared and aliquots of this stock were diluted with the blank plasma to obtain various concentrations of 3000, 2000, 1000, 500 and 250 ng/mL, which were used in the assay.
II) Microorganism and inoculums standardization
Micrococcus luteus ATCC 9341 was purchased in lyophilized form (Pasteur Institute, Iran) and activated in Tripticase Soy broth medium. Fifty microliters of the growth medium was transferred into antibiotic agar medium I (24 h before assay) and incubated at 35 °C for one day. The bacterial growth culture was diluted with a 0.9% w/v saline solution, in order to reach 30% turbidity at 580 nm, and the resultant bacterial suspension was then used as culturing inoculums.
III) Well diffusion assay
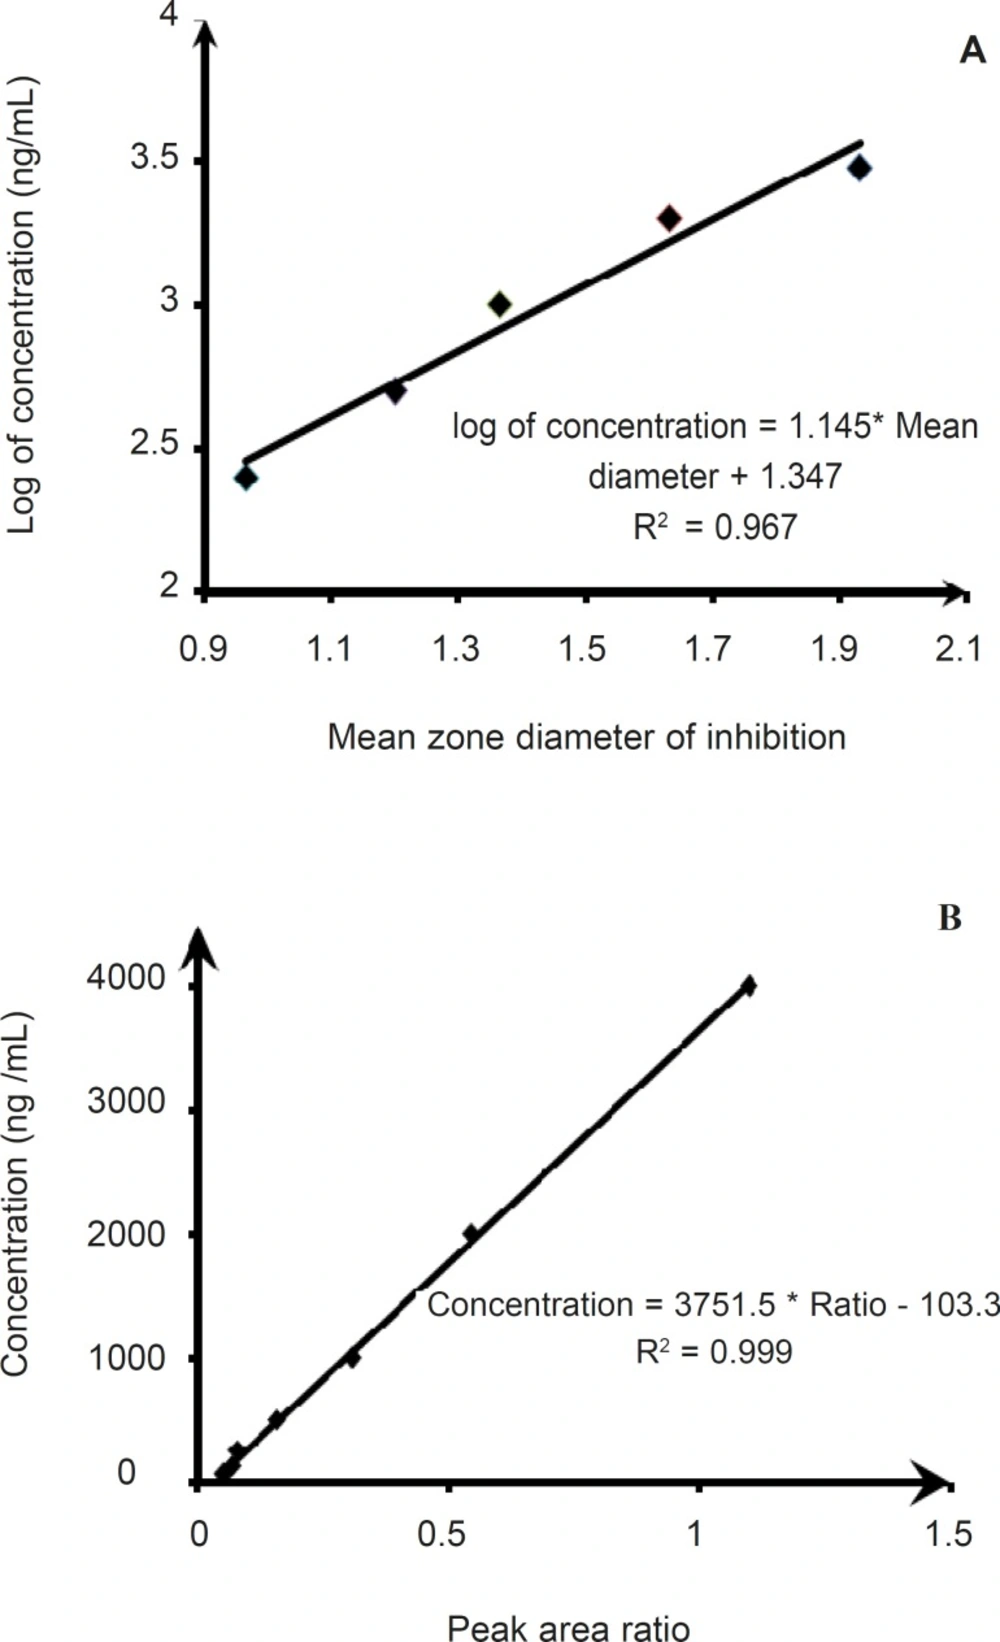
Microbiological assay of clarithromycin was performed, using an agar well diffusion procedure. Briefly, the assay plate contained 25 mL of antibiotic agar I inoculated with the bacterial inoculums. Wells of 6mm diameter were punched and filled with 100 μl of calibration samples or test samples. After 24 h of incubation at 35°C, the diameter of the inhibition zone was measured. The method was validated by determination of the following operational characteristics: linearity, precision and accuracy. The linearity was evaluated using the linear regression analysis, which was calculated by the least squares regression method. One-hundred microliter samples of clarithromycin reference solution were added as concentrations of 3000, 2000, 1000, 500 and 250 ng/mL into the spiked plasma samples. Each level was made in triplicate and employed on the well diffusion assay method described above. The precision of the assay method was determined by evaluating repeatability (intra-assay) and intermediate precision (inter-assay), and expressed as the relative standard deviation (RSD) of four quality control samples. The accuracy was determined by adding known amounts of clarithromycin reference substance (quality control samples) at the beginning of the process, followed by calculation of the value: measured value/nominal value × 100.
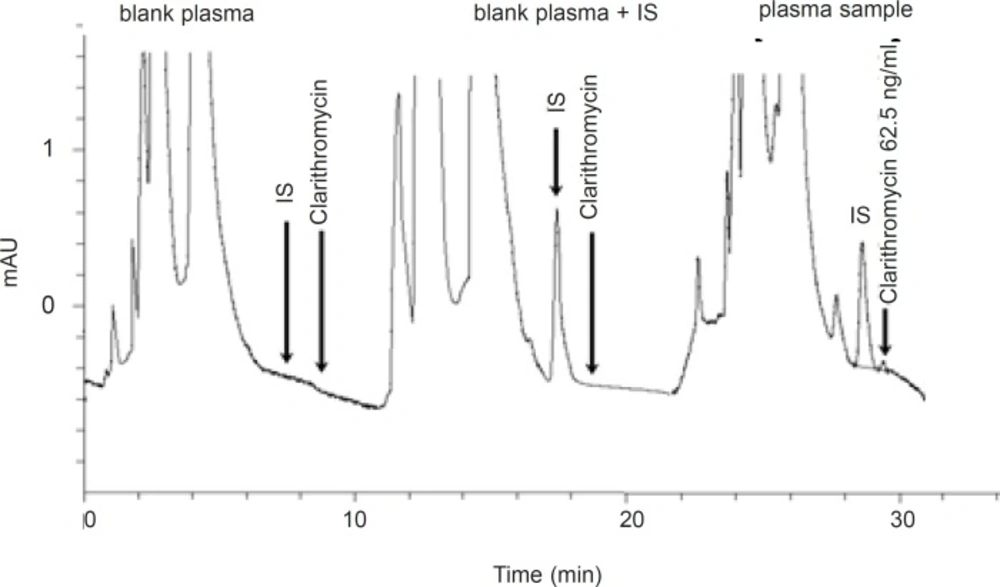
Representative chromatogram of a typical blank plasma sample and different clarithromycin standard concentrations in plasma samples
HPLC method
The analytical procedure for determination of clarithromycin in plasma was adopted from the method presented by Amini and Ahmadiani (
6). The method used was validated for specificity, accuracy, precision and sensitivity. Fifty microliters of the internal standard (1 μg/m1 of diltiazem HCl) and 20 microliters of 1 N NaOH were added to 1 mL of plasma. The mixtures were extracted with 2.5 mL hexane:isopropyl alcohol (98:2 %v/v), by vortexing for 5 min. After centrifugation for 5 min at 1000 g, the upper organic phase was transferred to a 5 mL glass tube and 50 microliters of 0.2% acetic acid was added. The mixture was vortex-mixed for 2 min and then part of the upper organic phase was discarded and the remaining mixture (about 1 mL) transferred into a 1.5 mL microcentrifuge tube. After centrifugation for 2 min, the upper organic phase was discarded completely. Finally, 50 microliters of the aqueous phase was injected onto the HPLC column. The mobile phase consisted of acetonitrile and 50 mM aqueous sodium dihydrogen phosphate (32:68 %v/v), with pH=4.5 (adjusted with concentrated phosphoric acid and 4M sodium hydroxide).The analytical column used for chromatographic separations was Shimpack CLC-CN 5 μm (250 × 4.6 mm), with a Shimpack CLC-CN 5 μm 4.6 × 20 mm guard column. The flow rate was 1 mL/min at 40°C and the detector wavelength was set at 205 nm. Under these conditions, the retention times for clarithromycin and the internal standard (diltiazem) were 8.6 and 7.5 min, respectively. The liquid chromatographic system (Knauer, Germany) consisted of a Knauer K1000 solvent delivery module equipped with a Rheodyne (Cotati, CA) injector and a variable wavelength ultraviolet spectrophotometric detector (Knauer smartline 2500). Eurochrom 2000 version 2.05 was used for data acquisition, data reporting and analysis. All plasma samples taken from each volunteer during the two treatment periods, were analyzed in the same chromatographic run (analytical own control). Each run had a separate daily calibration. Quality control samples (QC) at two different concentration levels were used in each run. Calibration curves were obtained by plotting the clarithromycin to diltiazem peak area ratio, against the concentrations of the standard solutions.
Statistical methods
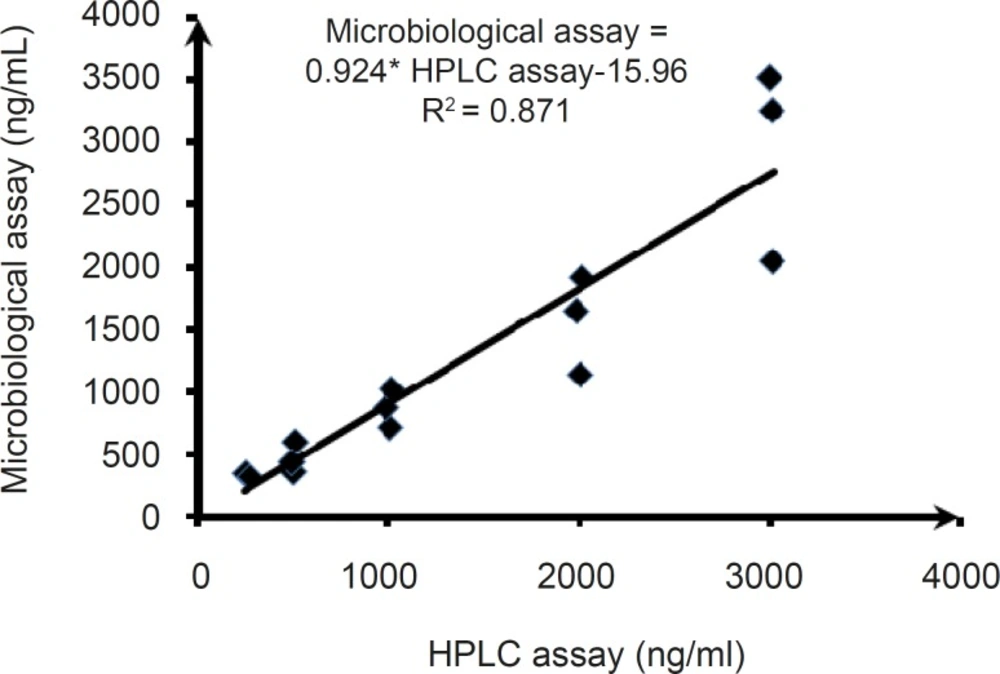
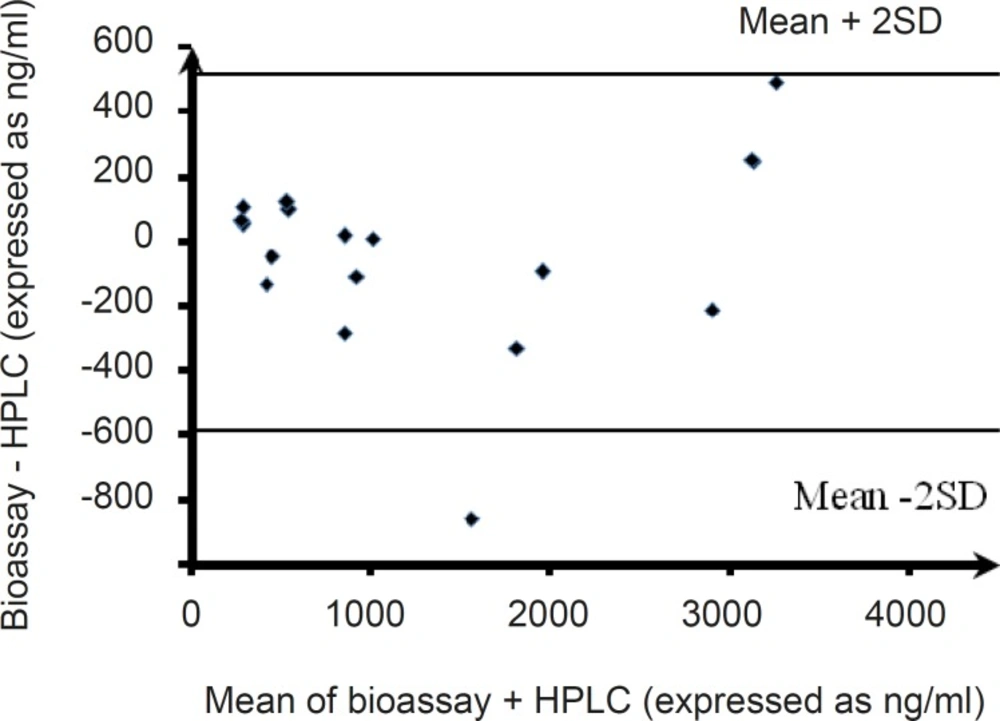
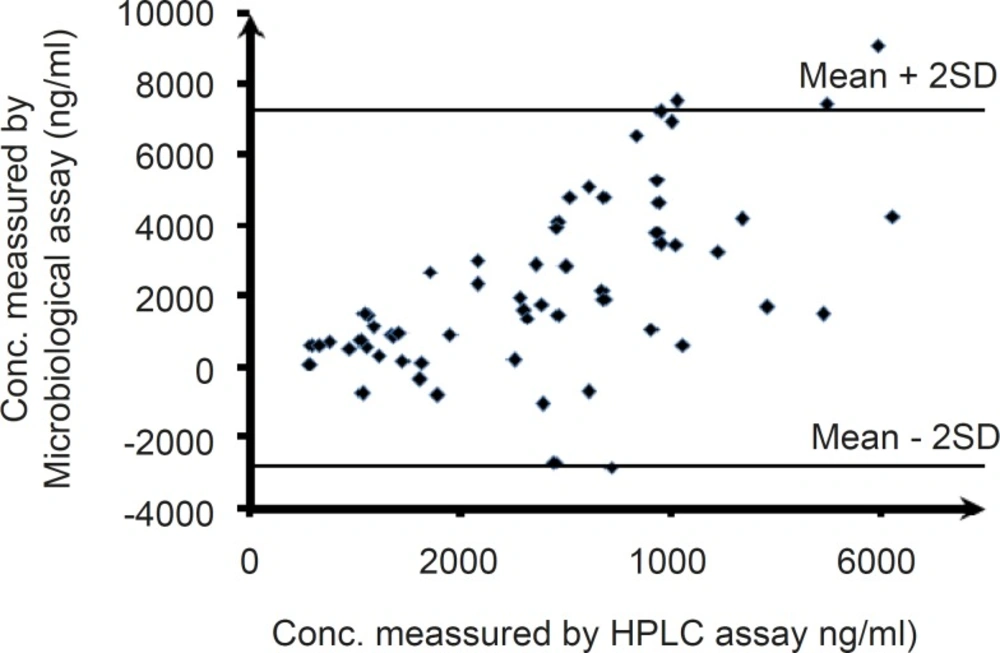
The least-squares linear regression was performed, using the standard techniques. Both procedures were repeated over 4 days, and each control was run four times. The within- and between-run precisions of the assays were estimated by computing the Relative Standard Deviation (RSD). The agreement between both analytical methods was evaluated by computing the mean square error and the Bland-Altman method (
16).