Extraction of RF
Rhododendron dauricum (300 g) was extracted twice at 80-100°C, using 3000 mL water for 2 h each time. The extracts were then combined and filtered through filter paper. The filtrate was concentrated at 50-60°C by rotary evaporator to 1800 mL. This crude extract was then dissolved in three volumes 95% ethanol, under constant stirring. The ethanol suspension was laid overnight and then concentrated. Polyamide column chromatography (volume of 400 mL, and a speed of 400 mL/h) was used to enrich the flavonoid components. Non-flavonoid components were first eluted with 1200 mL distilled water and then 1500 mL 95 % ethanol was used to elute the flavonoid components, until reaching a negative reaction of hydrochloric acid-magnesium. The elution speed was about 400 mL/h. The flavonoids suspension was concentrated and then vacuum dried. The flavonoids powder was about 6 g and included hyperoside, quercetin, azaleatin and isorhamnetin.
Assay of flavonoids
The experiments consisted of 3 parts.
(І) Assay of hyperoside
The condition of chromatography as below:
stationary phase: ODS volume (4.6 mm I.D. × 150 mm, 5 μm); mobile phase: methanol: 0.5% phosphoric acid (45: 55) aqueous solution (pH was adjusted with triethylamine to 3); speed was 0.8 mL/min; wave length of detection was 355 nm; and sample size was 10-20 μL. The content of hyperoside was 16.6%.
(ІІ) Assay of azaleatin
The condition of chromatography as below:
stationary phase: ODS volume (4.6 mm I.D. × 150 mm, 5 μm); mobile phase: methanol: water (60: 40); speed was 1 mL/min; wave length of detection was 296 nm; and sample size was 10-20 μL. The content of azaleatin was 1.1%.
(ІІІ) Assay of quercetin
The condition of chromatography as below:
stationary phase: ODS volume (4.6 mm I.D. × 150 mm, 5 μm); mobile phase: methanol: water: glacial acetic acid (50: 50: 2); speed was 1 mL/min; wave length of detection was 370 nm; and sample size was 10-20 μL. The content of quercetin was 3.8%.
Preparation of thoracic arterial rings
Male Wistar rats were purchased from Harbin Medical University animal center. The rats (each weighing 250 - 300 g) were sacrificed by decapitation. The thoracic aortas were rapidly and carefully dissected and placed into ice-cold and oxygen-saturated K-H buffer solution (pH=7.4) containing 118 mmol/l NaCl, 4.7 mmol/l KCl, 1.1 mmol/L MgSO4, 1.2 mmol/L KH2PO4, 1.5 mmol/L CaCl2, 25 mmol/L NaHCO3, and 10 mmol/L glucose. The thoracic aortas were cleaned of connective tissue, and cut into approximately 3-4 mm-wide strips. For endothelium-intact strips, extreme care was taken to avoid endothelium injury. For endothelium-denuded strips, the endothelium was removed by rubbing the vessel interior with wet filter paper. Each vascular strip was mounted in a 5-mL organ bath containing K-H buffer solution. One end of the aortic strip was attached to a metal hook and the other end was connected to an isometric force transducer (JH-2, metrical range: 0-10.0 g) in a bath containing K-H buffer solution, maintained at 37°C and bubbled with 95% O2 and 5% CO2. Rings were equilibrated for 45 min at 1.5 g resting tension, and then challenged with PE (1.0×10⁻⁵ M) until a maximal contractile response was obtained. The integrity of the endothelium was assessed in all preparations by determining the ability of carbachol (1.0×10⁻⁵ M), to induce more than 80% relaxation of rings. The endothelium was considered to be removed when there was less than 10% relaxation response to carbachol. The isometric tension was recorded with MedLab BL-420E+ recording system (Chengdu TME Technology Co., China).
Effects of RF on vascular tone
The experimental set up were consisted of 4 groups, with each group including six test animal.
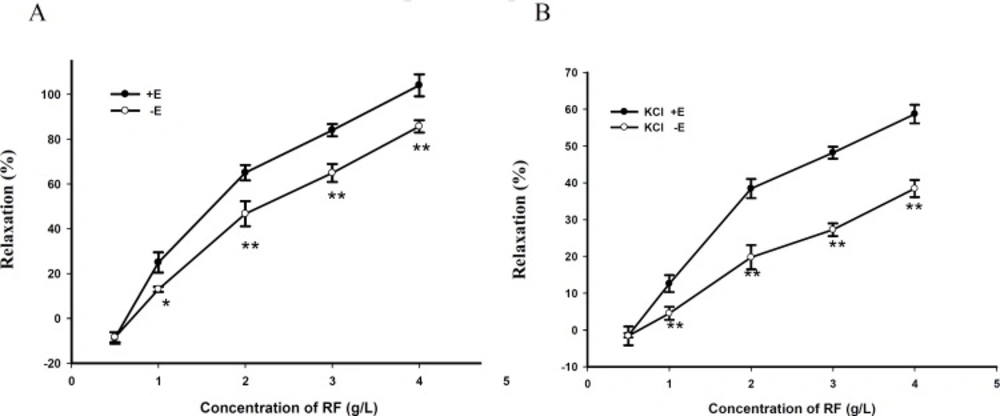
(I) Endothelium-dependent or independent effects of RF on isolated aortic rings
When the tension was at resting state or reached a plateau induced by PE (1.0×10⁻⁵ M) or KCl (60 mM), RF (0.5, 1, 2, 3, 4 g/L) was cumulatively added into the organ bath at 4 min intervals. The rings with intact or denuded endothelium were always tested in parallel.
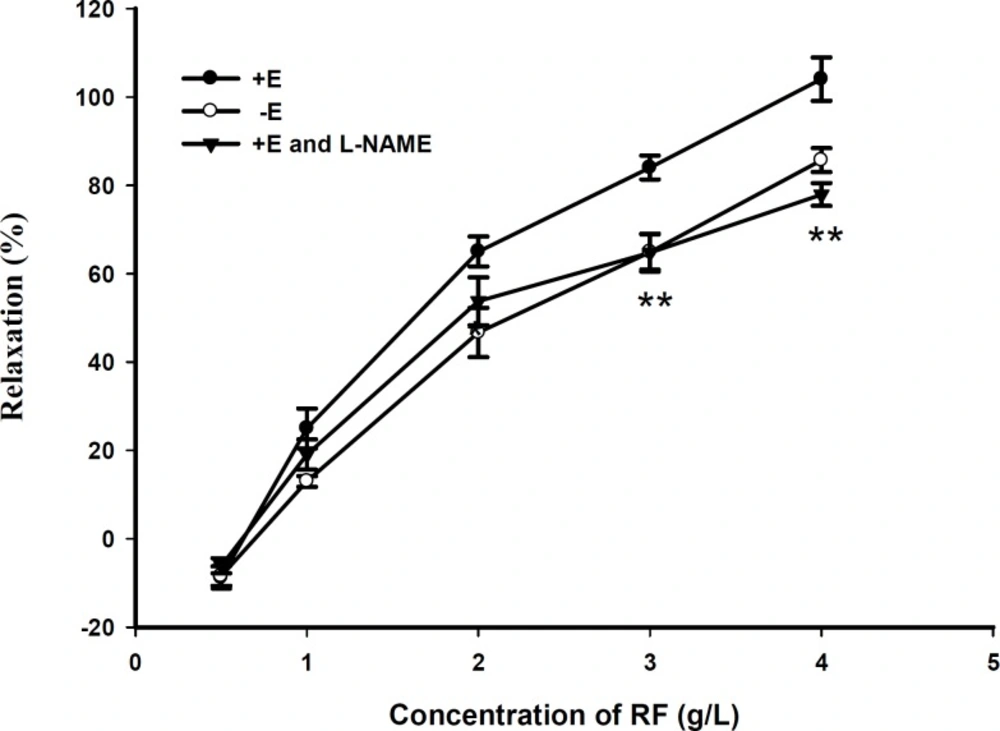
(II) Effect of L-NAME (10-5 M) pretreatment on RF induced vasorelaxation in rat aortic rings with endothelium
Aortic rings were pretreated with NOS inhibitor L-NAME (10-5 M) 30 min before contraction with PE. Then RF (0.5, 1, 2, 3, 4 g/L ) was cumulatively added into the organ bath at 4 min intervals to examine a role of L-NAME.
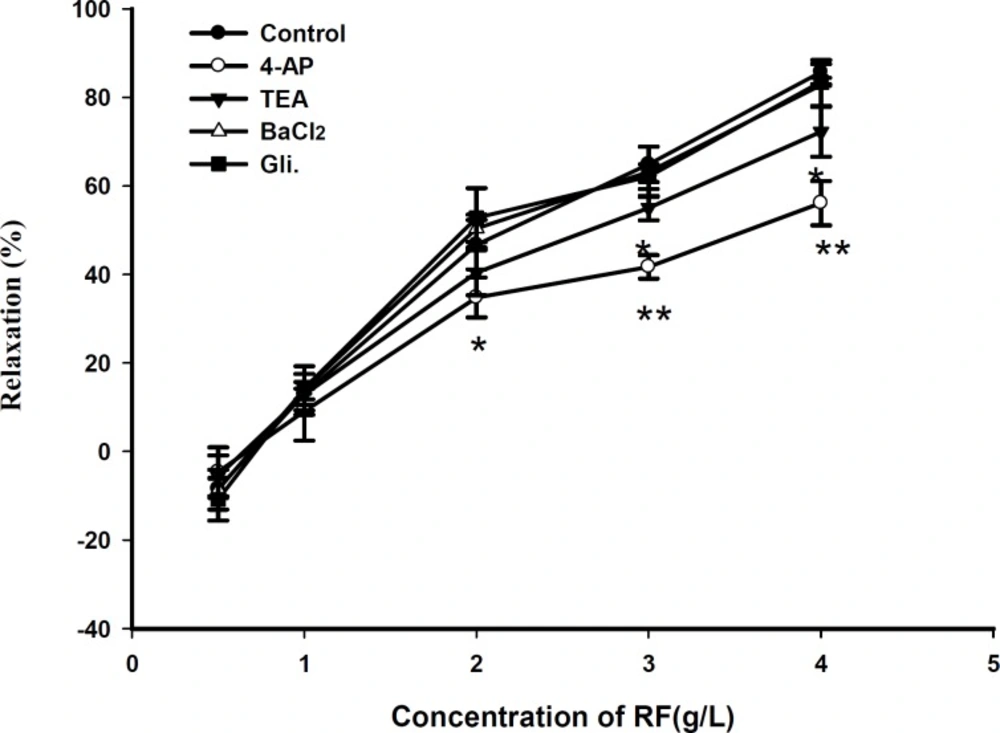
(III) Effect of potassium channels blocking agents pretreatment on RF induced vasorelaxation in rat aortic rings without endothelium
Aortic rings were pretreated respectively with potassium channels blocking agents, including 4-AP (1 mM), TEA (1 mM), Gli (10 μM) and BaCl2 (10 μM) 30 min before contraction with PE. Then RF (0.5, 1, 2, 3, 4 g/L) was cumulatively added into the organ bath at 4 min intervals to examine the role of potassium channel blocking agents.
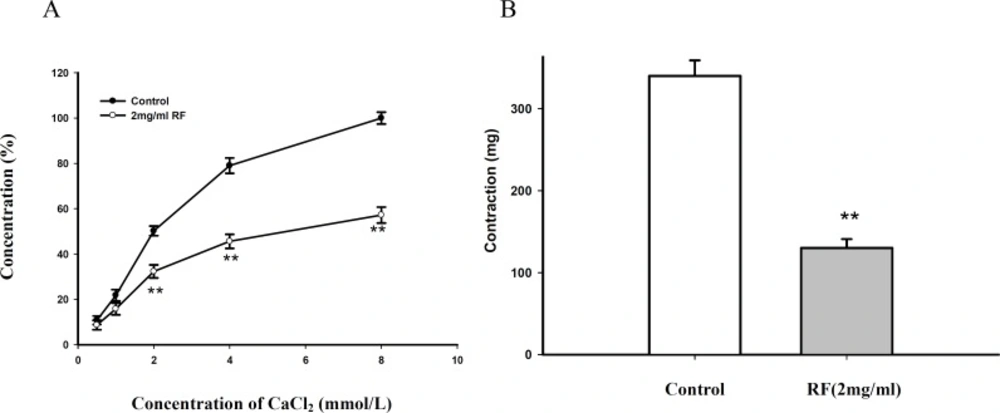
(IV) Effect of RF and KCl pretreatment in K-H buffer solution without Ca2+ on Ca2+-induced contraction in isolated aortic rings
Aortic rings were pretreated with RF (2 mg/mL) and KCl (60 mM) in K-H buffer solution without Ca
2+ 30 min before contraction with Ca
2+ (
4). Then Ca
2+ (0.5, 1, 2, 4, 8 mM) was cumulatively added into the organ bath at 4 min intervals to examine the role of RF on Ca
2+- induced contraction.
(V) Effect of RF pretreatment in K-H buffer solution without Ca2+ on PE-induced contraction in isolated aortic rings
Aortic rings were pretreated with RF (2 mg/mL) in K-H buffer solution without Ca2+ 30 min before contraction with PE. Then PE (1.0×10⁻⁵ M) was added into the organ bath at 4 min intervals to examine the role of RF on PE- induced contraction.
Preparation of rat cardiomyocytes
Myocytes were isolated according to the method established by Yang
et al. (
5). Briefly, each rat was killed, then the heart was quickly removed and cannulated on a Langendorff apparatus and retrogradely perfused through the aorta with the standard Tyrode’s solution (126 mM NaCl, 5.4 mN KCl, 10 mN HEPES 0.33 mN, NaH
2PO
4·2H
2O 1.0 mN, MgCl
2·6H
2O, 1.8 mN CaCl
2 and 10 mN glucose; pH=7.4) for 5 min, and calcium-free Tyrode’s solution until it stopped beating. The heart was then enzymatically digested with the calcium-free Tyrode’s solution, containing collagenase type II and BSA. The ventricular tissue was minced after being softened and placed in the KB medium (70 mM glutamic acid, 15 mN taurine, 30 mN KCl, 10mN KH
2PO
4, 10 mN HEPES, 5.4 mN MgCl
2·6H
2O, 10 mN glucose and 0.5 mN EGTA; pH=7.4). Single cells were obtained by gentle pipetting. It was stored at 4°C for 1–2 h, and then gassed with 95% oxygen and 5% carbon dioxide and warmed to 37 ± 0.5°C. Only rod-shaped myocytes with clear cross-striations were studied.
[Ca2+]i measurement
After the isolation of single ventricular myocytes, they were adhered to the cover-slips of the chamber. Cells were then rinsed once with the normal Tyrode’s solution and subsequently incubated with a working solution containing Fluo-3/AM (20 mM) and Pluronic F-127 (0.03%) at 37°C for 45 min. After loading, the cells were washed once with the standard Tyrode’s solution to remove the extracellular Fluo- 3/AM. Fluorescent changes of the Fluo-3/AM-loaded cells were detected by a laser scanning confocal microscope at 488 nm for excitation from an argon ion laser and 530 nm for emission and inverted microscope with 20 × objective. Drugs were added between scans 3 and 4, and the images stored on disks. The fluorescent intensities, both before (F0) and after (Fi) the drug administration, were recorded. The change in [Ca2+] i was represented by the ratio of F i /F0.
Effect of RF on cardiomyocytes
The experiments were carried out on 3 groups, each consisting of twenty test animal.
(І) Effect of KCl on [Ca2+]i
F i was measured after adding KCl (60 mM) to the normal Tyrode’s solution containing 1.0 mmol/ L Ca2+.
(ІІ) Effect of RF on [Ca2+]i elevation induced by KCl (60 mM)
The preparation was pretreated with RF (1~2 mg/mL) for 10 min. F i was then measured after adding 60mN KCl.
(ІІІ) Effect of verapamil on [Ca2+]i elevation induced by KCl (60 mM)
The preparation was pretreated with calcium channel inhibitor verapamil (10 μM) for 10 min. F i was then measured after adding 60 mM KCl.
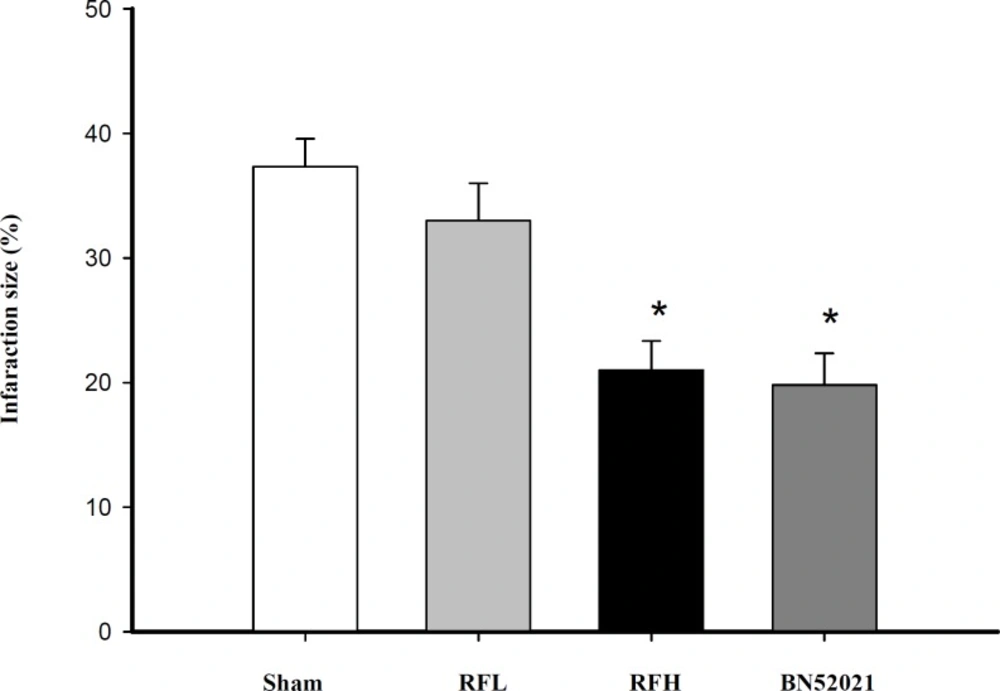
Effect of RF on hypoxia mice
Fourty male mice (average weight of 20±2 g) were divided into 4 groups: 180 mg/kg RFH group, 90 mg/kg RFL group, control group (normal saline) and 10 mg/kg BN52021 group. Each group received intraperitoneal injection with isoprenaline (0.05 mg/10 g) 15 min after injecting drugs through vena caudalis and then each animal moved into a wide-mouthed bottle (180 mL) containing 10 g nitrica calx to examine the survival time, through the observation of asphyxia.
Rat model of myocardial infarction
Male Wistar rats weighing 230–250 g were randomly divided into five groups: control, ischemia (MI), ischemia-low RF (RFL, 7.5 mg/kg), ischemia-high RF (RFH, 30 mg/kg) and BN52021 (10 mg/kg), respectively. The rats were heparinized (300 U) and anesthetized with IP sodium pentobarbital (40 mg/kg), and were then ventilated using a small animal ventilator at a frequency of 70/min and a tidal volume of 3 mL. The chest was surgically opened and the body temperature was maintained at 37°C by placing the animal on a heating pad. The standard limb lead ECG, together with the arterial pressure, was continuously recorded on a recorder (Nihon Kohden RM 6200; Tokyo). A left thoracotomy was performed via the fourth rib intercostal space and a segment of saline-soaked 5-0 suture was looped around the left anterior descending (LAD) coronary artery, near its origin from the left coronary artery and then the chest was closed quickly.
Measurements of infarction size
The heart was removed from the animal after 60 min of infarction, and then the ventricular tissue was dissected and kept at −4°C overnight. The frozen ventricles were sliced into 2 mm thick sections, and then incubated in 1% triphenyltetrazolium chloride at 37°C in 0.2 M Tris buffer (pH=7.4) for 30 min. While normal myocardium was stained brick red, the infarcted areas remained unstained. The size of the infarcted area was estimated by its volume and weight, as a percentage
e of the left ventricle (
6).
Statistical analysis
Data were presented as mean ± SD. Statistical comparison was performed by the Student’s t - test and with an analysis of variance (ANOVA), with a value of p < 0.05 considered as significant.

![Dose-effect responses of verapamil and RF on increasing [Ca<sup>2+</sup>]<sub>i</sub> induced by KCl. Verapamil 10 μm, RF 1 mg/mL and RF 2 mg/mL inhibited [Ca<sup>2+</sup>]<sub>i </sub>evoked by KCl, respectively. Verapamil or RF was applied 10 min before KCl (* p <i>< </i>0.05, versus KCl group, n=20 for each group).](https://brieflands.com/journals/ijpr/articles/126049/figures/ijpr-09-303-g005-preview.webp)