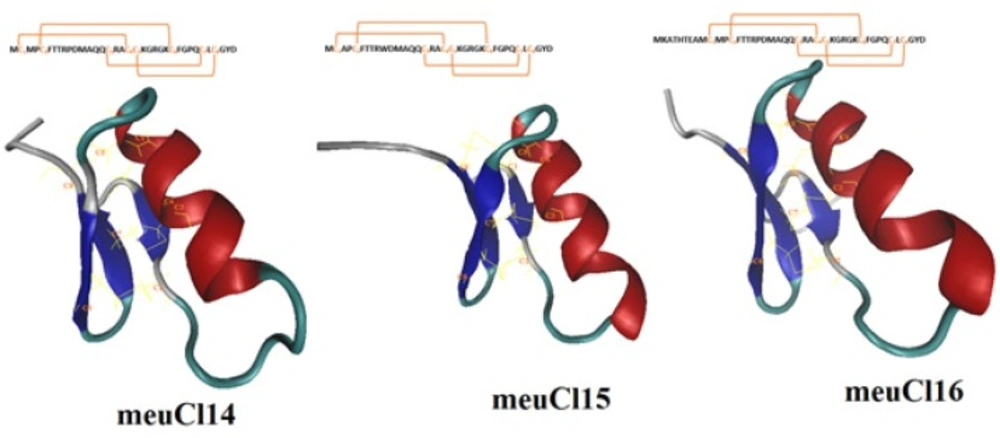
The full length cDNA of meuCl14, meuCl15, and meuCl16, identified from the venom gland of Iranian M. eupeus, are related to the ClTxs. ClTxs are small peptides that block conductive chloride channels (22, 39). Mature peptide of meuCl14 and meuCl15 composed of 36 amino acids, while mature peptide of meucl16 contains 44 amino acids. Figure 1S (supplementary materials) shows the amino acid alignment of meuCl14, meuCl15, and meuCl16 with the Chlorotoxin and Chlorotoxin-like peptides family identified in other scorpions. Here identified ClTxs demonstrate 71.4% sequence identity with Chlorotoxin extracted from Leiurus quinquestriatus venom, known as a small 36-amino-acids peptide (4).
Homology modeling predicted the 3-D structure of meuCl14, meuCl15, and meuCl16 based on the primary alignment to the known structure of InsectotoxinI5A (PDB code: 1SIS) (amino acid alignments are shown in Figure 1S). The MDFF method has successfully been applied for optimizing the models obtained from the MODELLER.
Figure 1 illustrates the predicted models for the ClTxs at the end of the simulation. meuCl14, meuCl15 and meuCl16 contain eight cysteines forming four disulfide bridges, and present two structural domains: one alpha-helix and a triple stranded beta-sheet, indicating that they adopt a typical CSαβ folding. CSαβ structure is composed of a single α-helix connecting to a double or triple stranded β-sheet through four disulfide bonds, identified as a conserved motif in many scorpion toxins (40). Disulfide bonds of meuCl14, meuCl15, and meuCl16 were stable during the simulation (Figure 2S). Other analysis of trajectories including RMSD, RMSF, radius of gyration and SASA, calculated for meuCl14, meuCl15, and meuCl16, are shown in Figure 3S-6S, respectively.
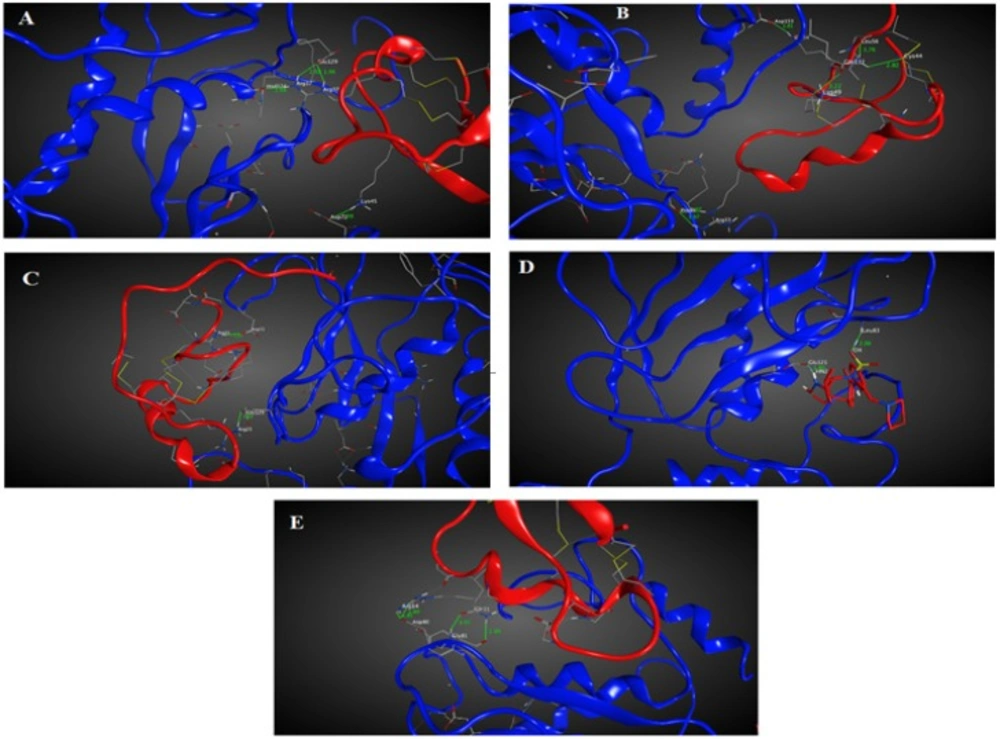
Chlorotoxin inhibits the hMMP-2 indicating the importance of this toxin in cancers associated with hMMP-2 activity (19). Hence, the here obtained homology model structures of ClTxs also with Chlorotoxin and SC-74020 (as control) were docked to hMMP-2.
Figure 1A-E shows the docking results after energy minimization. As shown in the model, Arg
14 and Gln
11 of Chlorotoxin interact with hMMP-2 through hydrogen bonds (
Figure 2A and Table 1). MeuCl14 forms four H-bonds through two residues including Lys
45 and Arg
37 with several residues of hMMP-2 catalytic domain (
Figure 2B and Table 1). MeuCl15 interacts with hMMP-2 catalytic domain residues via six H-bonds. Glu
54, Leu
56, Lys
49, Cys
44, and Arg
33 of meuCl15 seem to be the key contacts between the meuCl15 and hMMP-2 (
Figure 2C and Table 1). MeuCl16 bonds to hMMP-2 by two Key residues, Arg
31 and Arg
25 (
Figure 2D, and Table 1). A comparison between the amino acids involved in the interaction in different ClTxs indicates that Arginine residue has a pivotal role in the interaction with hMMP-2 (
Figure 2, and Table 1).
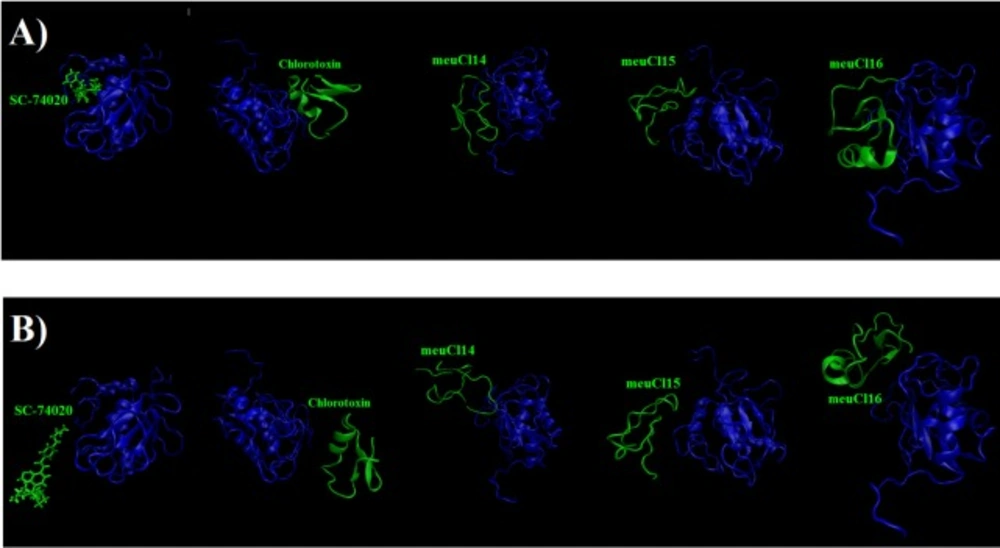
To evaluate the affinity of the ClTxs for hMMP-2, the SMD simulation was done successfully on all five complexes with Constant Force Pulling method. Before performing the SMD simulations, to pull ligands (ClTxs and SC-74020) out of hMMP-2 catalytic domain (receptor), energy minimization and equilibration of the whole system (at the designated temperature, pressure and ion contents) were first carried out. Similarly, all complexes were run up to 10 ns to understand how ligands (ClTxs and SC-74020) behave in the equilibration state when hMMP-2 (receptor) remained fixed; in this process, the ligands were pulled during simulation.
Figure 3 shows the position of ligands through the hMMP-2 in 0 ns and 10 ns.
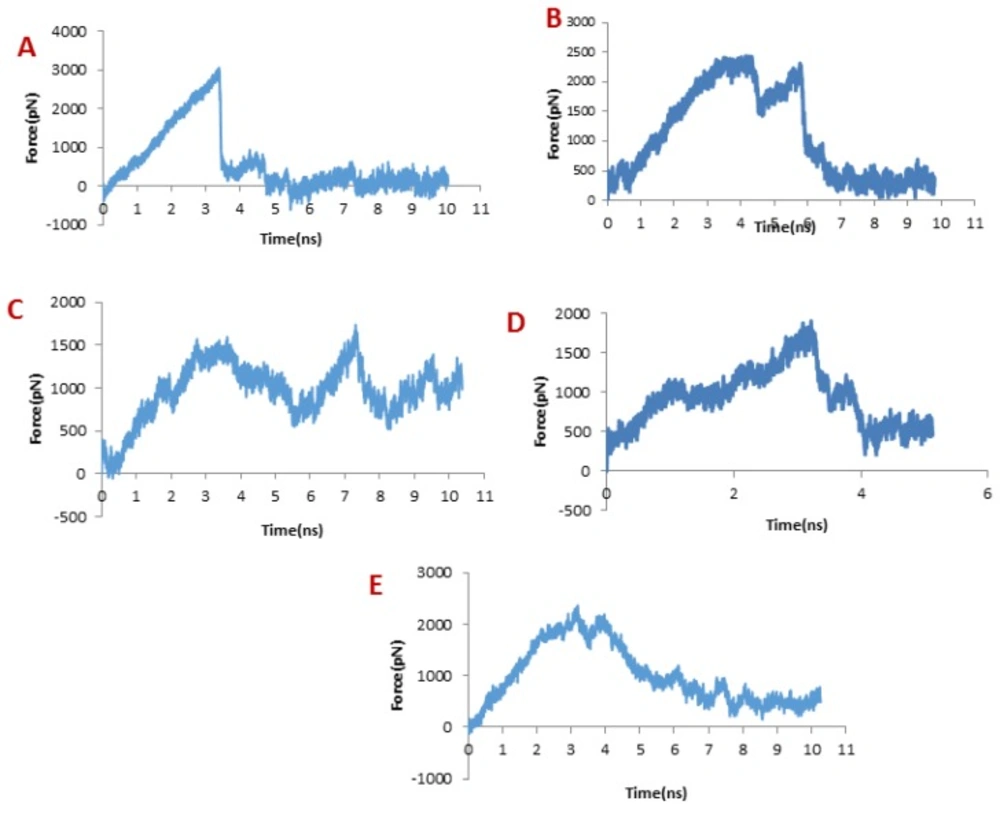
Obviously, increased force appears when the ligands begin to move out of the binding site, regardless of the initial structure and the direction of pulling force, which implies that the ligand encounters energy barriers. When one bond dissociates, the force somehow decreases and then increases for dissociate another bond. So force fluctuations are shown in the force plot, in which the peaks appear when a significant number of bonds dissociate (41).
In dissociation of SC-74020 from the hMMP-2 catalytic domain, the main peak occurred at about 3 ns (see
Figure 4A). Eventually, the pulling force became zero at around 4 ns, indicating that the SC-74020 has completely dissociated from the receptor.
The pulling force plots for dissociation of ClTxs from the hMMP-2 are shown in
Figure 4B to 4E. Very similar to the SC-74020, the forces increase in the beginning of ClTxs unbinding, but unlike the SC-74020, more than one peak emerged in the pulling force plots of ClTxs. The main peaks for Chlorotoxin appeared at about 4 and 6 ns, for the meuCl15 between 1ns and 4ns, and for the meuCl16 between 3ns and 4ns. Finally, the fluctuations of pulling force for the meuCl15 and meuCl16 decrease after around 4 ns and for the Chlorotoxin after 6ns close to zero, demonstrating their complete dissociation from the hMMP-2 (
Figure 4B, 4D, 4E). The main peaks for meuCl14 emerged after 3 ns to 8 ns. But, some peaks still appeared until the ending time of SMD simulation. It means that meuCl14 still resists some forces and needs a little more time for a complete dissociation from the hMMP-2 (
Figure 4B). These results visibly indicate that the SC-74020 as compared to ClTxs dissociates easier from the hMMP-2. Moreover, dissociation of meuCl14 from hMMP-2 is more difficult than the dissociation of Chlorotoxin, meuCl15 and meuCl16.
In order to identify the contributory factors leading to the easy dissociation of SC-74020 and, on the other hand, the difficult dissociation of ClTxs through the hMMP-2 catalytic domain, the key components of interaction energies between each ligand and hMMP-2 catalytic domain during the SMD simulation were examined, including electrostatic, vdW, and H-bonding interactions.
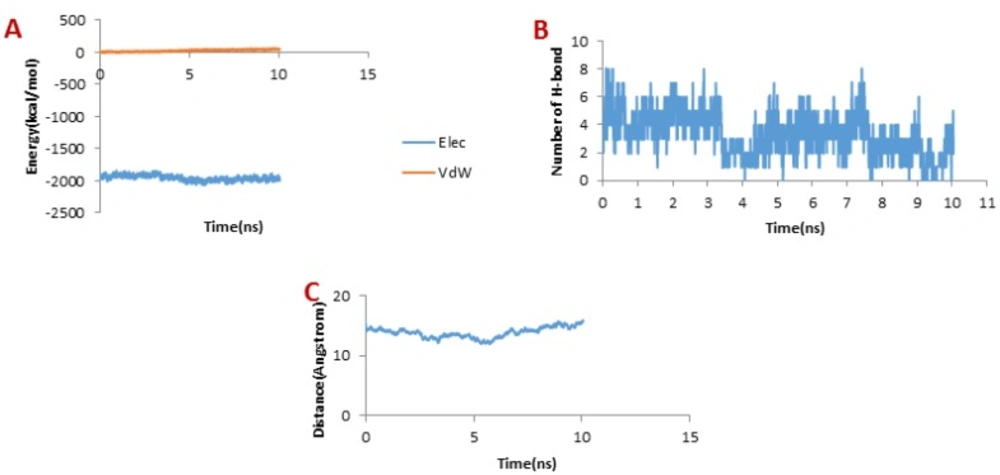
Figure 5A illustrates the changes of the vdW interaction and electrostatic energy during the dissociation of SC-74020 through the hMMP-2 catalytic domain. No changes in the vdW and the electrostatic interaction energies of SC-74020/hMMP-2 complex were observed during the SMD simulations. In the H-bond diagram (
Figure 5B), however, apparent fluctuations could be found during the dissociation of SC-74020 through the hMMP-2 catalytic domain. The most of H-bonds dissociated at about 3 ns, which was consistent with the moment when the main peak appeared on the pulling force plot in
Figure 2A, implying that the pulling force helped unbind the H-bonds. Ultimately, the H-bonds reached zero, referring to the complete dissociation of SC-74020 through the hMMP-2 catalytic domain. Decreasing the distance of SC-74020 from the hMMP-2 catalytic domain with time can clearly be observed in distance plot until 5 ns, and after that, the distance begins to increase (
Figure 5C). So, unbinding process in SC-74020/hMMP-2 complex was performed in two phases: (a) ejecting form catalytic region (0-5 ns), and (b) complete release form the receptor (5-10ns).
Figure 3B also plainly shows that the SC-74020 dissociates completely from the hMMP-2 at the end of the SMD simulation (10 ns).
Considering
Figure 6B, the trend for Chlorotoxin was such that the number of H-bonds significantly decreased at about 4 ns; and almost all of H-bonds were dissociated in 6 ns. Therefore, the emergence of the peaks in the force plot at 4 and 6 ns can be attributed to an increase in the force resulting in the breakage of the H-bonds.
Figure 6A shows vdW and electrostatic interaction energy during the dissociation of Chlorotoxin through the hMMP-2 catalytic domain. The vdW energy went up continuously from the beginning of the simulation up to 6 ns. It means that the vdW energy had an influential role in this interaction. After this time point, the vdW energy drew nearer zero. The electrostatic interaction energy increased over the first 4 ns interval of the simulation, then declined and again grew at around 6 ns. In other words, at 4 and 6 ns, the most electrostatic interaction energy formed between the Chlorotoxin and hMMP-2; regarding the pull plot, the forces increased in these time points so as to counteract the electrostatic interaction.
Figure 6C, the distance graph, demonstrates that before 4 ns the distance between the Chlorotoxin and the hMMP-2 catalytic domain was fixed. From 4 ns to 6 ns, the distance increased slightly. After 6 ns onward, the distance increased significantly that means the dissociation of Chlorotoxin from hMMP-2. As just said, the interaction of Chlorotoxin with the hMMP-2 catalytic domain involves all H-bonds, vdW, and electrostatic interactions, but the contribution of H-bonds and vdW interactions are more substantial.
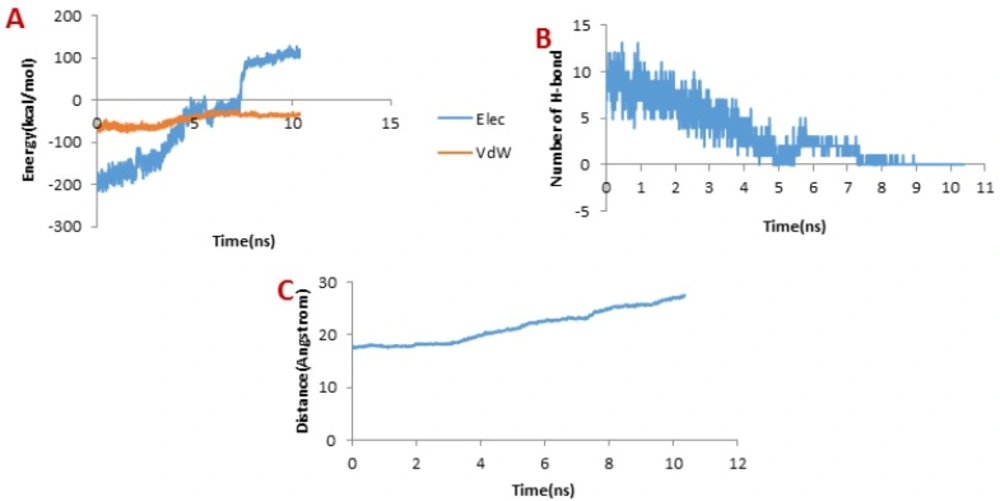
When it comes to meuCl14, as depicted in
Figure 7B, the H-bond plot presents obvious fluctuation during the dissociation of meuCl14 from the hMMP-2 catalytic domain. Clearly, after 3 ns, the number of H-bonds is mainly reduced. Hence, the main peak emerges on the pulling force plot at the same moment (see
Figure 4C). The second main drop in H-bonds diagram took place at the time point near 7.3 ns, which is in agreement with the time of appearing the second peak on the pulling force plot. After 8 ns, the number of H-bonds returned to zero, implying that after this time there was no H-bond between the meuCl14 and the hMMP-2 catalytic domain. The vdW and electrostatic interaction energies during the dissociation of meuCl14 through the hMMP-2 catalytic domain are presented in
Figure 7A. Again, fluctuations are observed for both of the vdW and electrostatic interaction energy curves during the SMD simulations. The highest peaks of vdW and electrostatics interaction energy occurred just after 8 ns. These are in harmony with the emergence time of the final peaks on the pulling force plot displaying the dissociation meuCl14 through the hMMP-2 catalytic domain (see
Figure 4C). Apparently, after 8 ns the pulling force was used for the destruction of vdW and electrostatics interactions between the meuCl14 and the hMMP-2 catalytic domain, and the meucl14 would dissociate in a short time. Increasing the distance between the meuCl14 and the hMMP-2 catalytic domain with the passage time (
Figure 7C) confirmed the preceding analysis. As shown in this figure, in the beginning, the distance curve was Horizontal, but shortly after 3 ns many of H-bonds were destroyed (see
Figure 7B) and the first peak appeared on the pulling force plot (see
Figure 4C). Simultaneously, the distance between the meuCl14 and the hMMP-2 catalytic domain increased, indicating that the dissociation of the main part of the ligand from the receptor has taken place. Furthermore,
Figure 3C illustrates that the meuCl14 mostly dissociated from the hMMP-2 over 10 ns, yet a small part of it was still in interaction with hMMP-2; there would have been a total separation, if the simulation had continued.
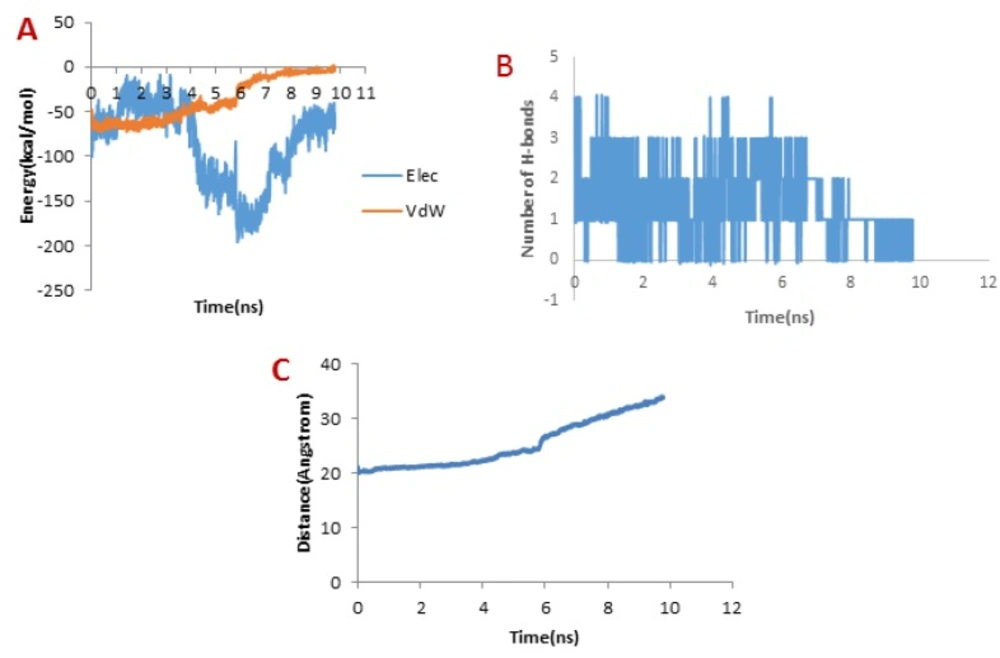
Figure 8A depicts the changes of the vdW interaction and electrostatic energy during the dissociation of meuCl15 from the hMMP-2 catalytic domain. The curve in
Figure 8B reveals that the numbers of H-bonds dwindled between 1 ns and 4 ns. As a result, after around 4ns, there was almost no H-bond left between the meuCl15 and the hMMP-2 catalytic domain. These time points are in agreement with the moments of the main peaks emergence in the pulling force plot of the meuCl15/hMMP-2 catalytic domain (
Figure 4D). VdW and electrostatics interactions between the meuCl15 and the hMMP-2 catalytic domain also diminished with the decreasing number of H-bonds and, at last, return to zero at around 4 ns (
Figure 8B), denoting that the meuCl15 completely dissociate from the hMMP-2. It can be also inferred from
Figure 8C that the distance between the meuCl15 and the hMMP-2 catalytic domain became larger after around 4 ns. The total dissociation of meuCl15 at the end of simulation (10 ns) is further clear in
Figure 3B.
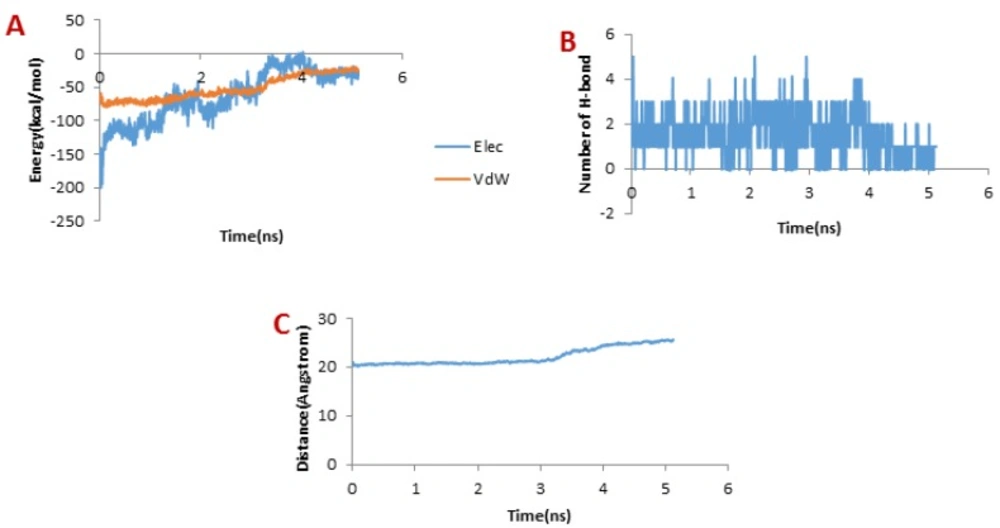
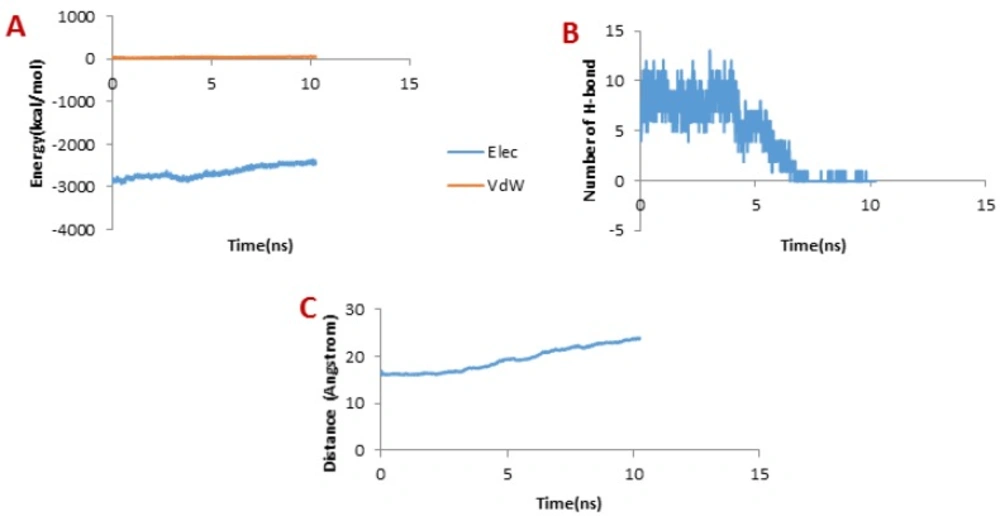
Figure 9A presents the changes of the vdW interaction and electrostatic energy during the dissociation of meuCl16 from the hMMP-2 catalytic domain. No significant changes in the vdW and electrostatics interaction energy curves happened during the whole simulation time (
Figure 9A). Noticeably, some fluctuations appeared in the number of H-bonds until around 4 ns (
Figure 9B). After this time point, the number of H-bonds suddenly fell and finally sank to zero. It can be deducted that the main factor is H-bond when it comes to meuCl16/hMMP-2 catalytic domain binding. The pulling force returned to zero, as well, after 4ns (see
Figure 4D) and the distance between the meuCl16 and the hMMP-2 catalytic domain increased after this time point (see
Figure 8C), indicating a complete detachment of meuCl16 from hMMP-2.
Figure 3B, clearly showed a complete dissociation of meuCl16 in hh10 ns.