Materials
All chemicals and reagents were purchased from Sigma-Aldrich (Taufkrichen, Germany) at best commercial grade available. We used for ROS and mitochondrial membrane potential (MMP) of Sigma Chemical Co. (St. Louis, MO, USA) and we used Quantikines Rat/Mouse Cytochrome c Immunoassay Kit (Minneapolis, MN) for cytochrome c release.
Instrument
Incubator 37 ºC, Sensor CO2 Sanyo IR, japan MCO 17A1; vapor bath Stark eliwellewpc 800T, UKA; refrigerated centrifugation, model of Sanyo, Harrier 18/80, Japan; Spectrophotometric UV/Visible, Shimadzu 160 ABB, Japan; Floremetry, Shimadzu RF-5000, Japan; digital scale Japan, Shimadzu 20 E8 330H, Japan; Shaker, REAX2000, Iran; ELISA reader (In finite 200 M, TECAN).
Animals
Male Wistar rats (250–300 g) were fed with a normal standard chow diet and tap waterad libitum. we used 6 number of animals each of groups in our study. All experiments were conducted according to the ethical standards and protocols approved by the Committee of Animal Experimentation of Shahid Beheshti University of Medical Sciences, Tehran, Iran. We type the study in-vivo plain. After the animals were decapitated, the liver, kidney, heart, and brain were quickly excised, pooled, and rinsed using isotonic saline buffer. These samples were used for the isolation of mitochondria as described below.
Experimental design
The animals were classified into two groups as follows: group 1: control group the normal saline injection, group 2: treatment group (give nanoparticle) and 0.003 g nanoparticle are weighted and suspended in normal saline. finally, once IP injection.
Preparation of mitochondria
The mitochondria isolation used Mitochondria Isolation Kit Catalog Number MITOISO1. This kit enables the fast and easy isolation of an enriched mitochondrial fraction from animal tissues such as liver, kidney, heart, and brain.
| Groups | ROS formation
|
|---|
Control
| Test
|
|---|
| 15 (min) | 60 (min) | 15 (min) | 60 (min) |
|---|
| Brain | 905.3 ± 0.91 | 907.2 ± 0.49 | 1001.3 ± 1.8** | 1001.6 ± 2.3** |
| Heart | 1003 ± 32 | 1010 ± 22 | 1004.3 ± 33* | 1009 ± 34* |
| Liver | 1016.6 ± 35 | 1016.6 ± 36 | 1023.6 ± 32 | 4584 ± 29*** |
| kidney | 1245 ± 38 | 1274.6 ± 35 | 1288 ± 38 | 1306 ± 25* |
| Groups | Mitochondrial membrane potential
|
|---|
Control
| Test
|
|---|
| 15 (min) | 60 (min) | 15 (min) | 60 (min) |
|---|
| Brain | 1048 ± 2.4 | 1054.3 ± 2 | 1089 ± 1.6* | 2003 ± 3.5* |
| Heart | 1016.3 ± 34 | 1025.3 ± 34 | 2514 ± 97** | 2205.6 ± 70** |
| Liver | 1324 ± 24 | 1351.3 ± 57 | 2415 ± 52** | 2710.3 ± 13** |
| Kidney | 1612.3 ± 48 | 1623 ± 49 | 2926 ± 12** | 3861.3 ± 11** |
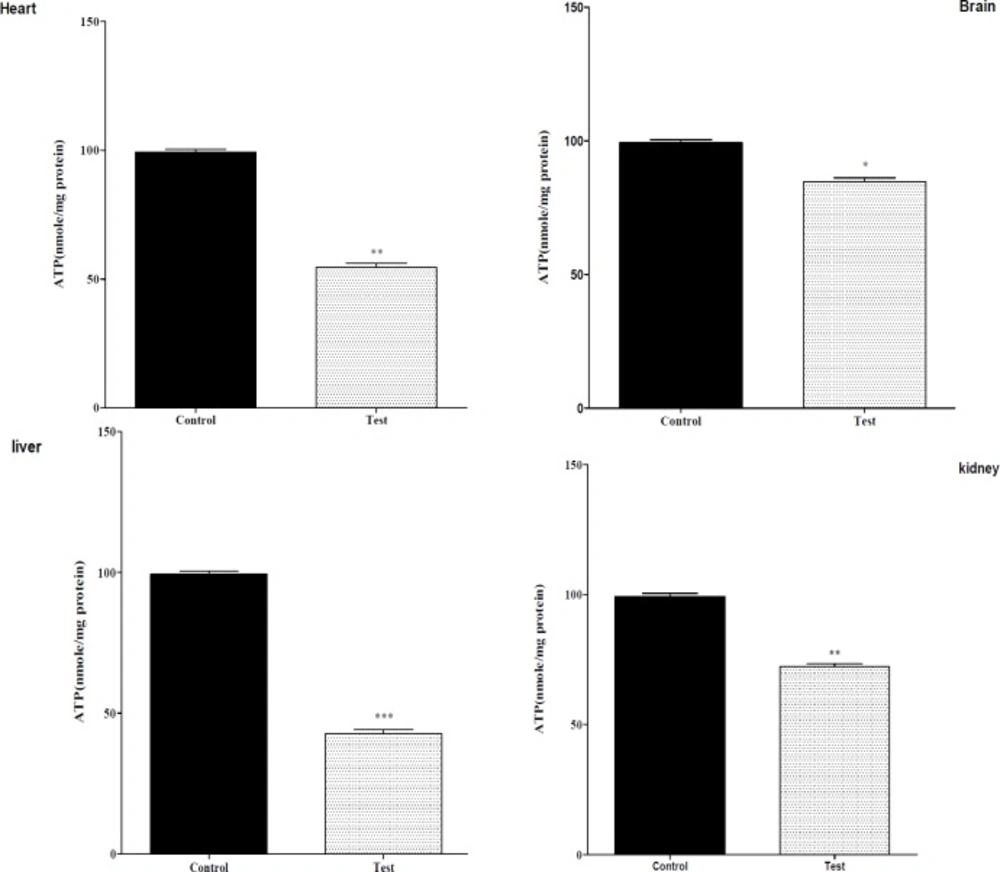
Effect of nanoparticle on mitochondrial ATP level on isolated liver, kidney, heart and brain mitochondria (0.5 mg/mL). Isolated mitochondria (0.5 mg/mL) were incubated with silk fibroin and ATP level were determined using Luciferin/Luciferase Enzyme System as described in Experimental. Values represented as mean ± SEM (n = 6). *P < 0.05; **P < 0.01 and ***P < 0.001 compared with control mitochondria
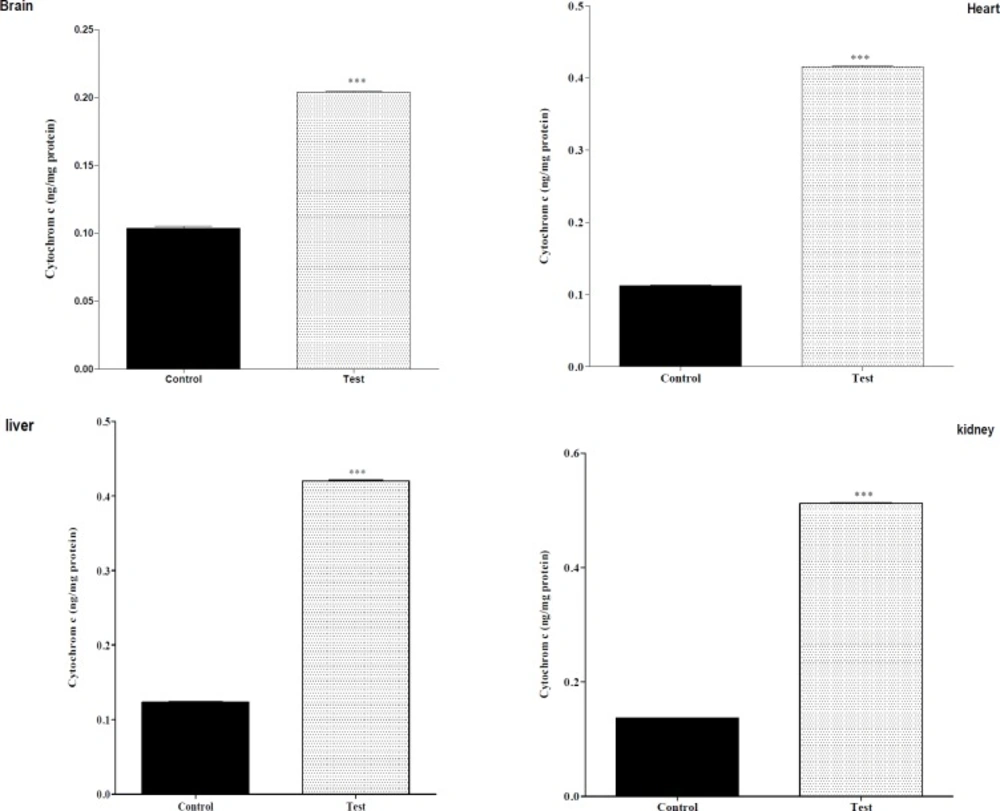
Effect of nanoparticle on cytochrome c release mitochondrial on liver, kidney, heart and brain mitochondria (0.5 mg/mL). the mitochondria were incubated for 1 h with various concentrations of silk fibroin. The amount of released cytochrome c from mitochondria was determined after 1 h of incubation using Cytochrome c ELISA kit as described in Materials. Values represented as mean ± SEM (n = 6). *P < 0.05; **P < 0.01 and ***P < 0.001 compared with control mitochondria
Protein concentration
Protein concentration of Mitochondrial was determined by the Coomassie blue protein-binding method using bovine serum albumin (BSA) as the standard (
10).
Quantification of mitochondrial ROS level
The Fluorometric Intracellular ROS Assay Kit provides a sensitive, one-step fluorometric assay to detect intracellular ROS (especially superoxide and hydroxyl radicals) in live cells with 1 h incubation. ROS react with a fluorogenic sensor was localized to the cytoplasm, resulting in a fluorometric product (ex = 490/em = 520 nm) proportional to the amount of ROS present.
Mitochondrial membrane potential assay
The Fluorometric Mitochondrial membrane potential Assay Kit provides a sensitive, one-step fluorometric assay to detect Mitochondrial membrane potential in live cells with a 1 h incubation. The mitochondrial uptake of the cationic fluorescent dye, rhodamine 123, was used for determination of MMP by fluorometric (ex = 490/em = 525 nm). we used Rhodamine 123 (rh123) Instead jc.
Assay of ATP level
The ATP levels were measured using Luciferin/Luciferase Enzyme system (Tafreshi et al. 2007). Bioluminescence intensity was measured using Sirius tube luminometer (Berthold Detection System, Germany).
The amount of cytochrome c released to the medium
From isolated mitochondria was determined at 450 nm according to the instructions provided by the manufacturer of the Quantikines Rat/Mouse Cytochrome c Immunoassay Kit (Minneapolis, MN). All analysis stages were carried out using an ELISA reader (InfiniteM 200, TECAN) at desired concentrations in all groups.
Statistical analysis
The results are presented as means SEM. All statistical analyses were performed using the Prism version 6 software in our study. Also the assays were performed in triplicate and means used for statistical analysis. The normality test was Kolmogorov-Smirnov (K-S) test and statistical significance was determined using the one-way ANOVA test, followed by the post-hoc Tukey test. Statistical significance was set at P < 0.05.