Literature Search results
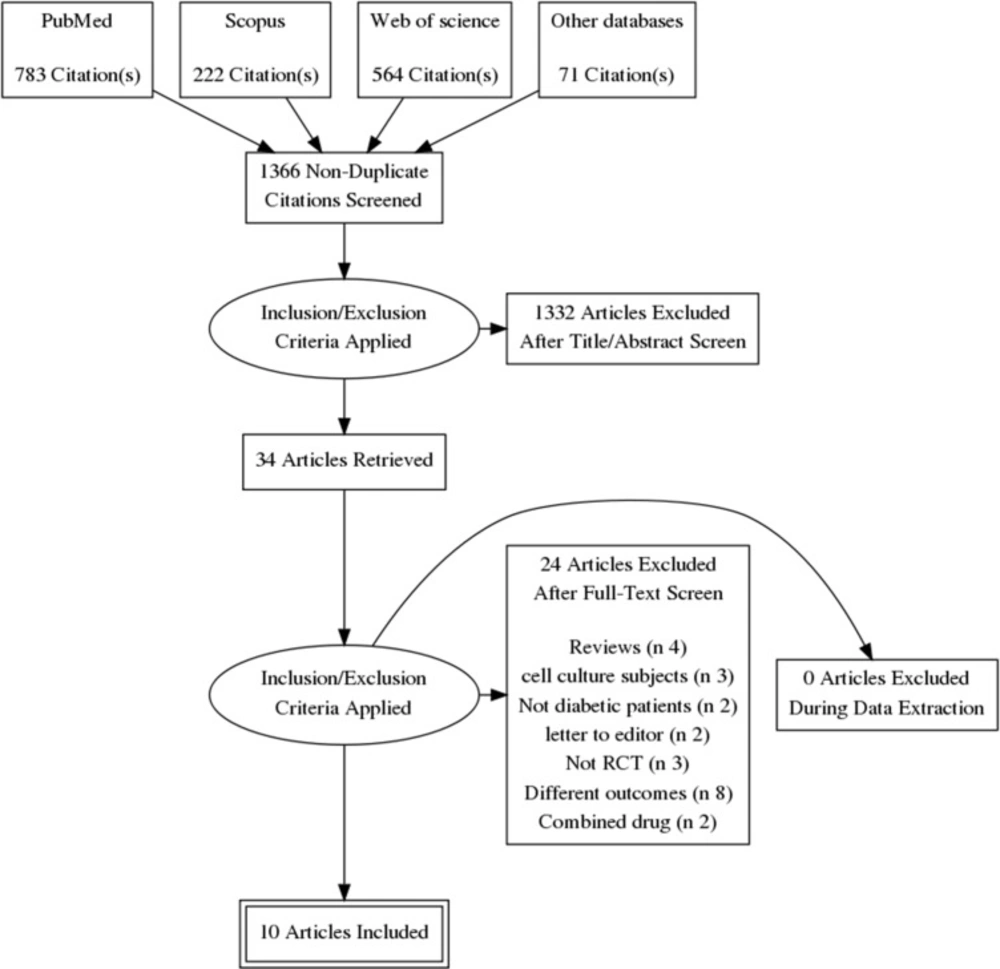
Our electronic literature search produced 1540 citations, which were abstracted to 1366 after duplicates′ removal using Endnote X8.0.1. An additional 1332 records were excluded during abstract screening, and the full-texts of 34 articles were examined in detail. Finally, we included 10 RCTs (
1,
2,
4,
12,
13,
22 and
25–
28) in quantitative synthesis (meta-analysis). The flow diagram of the literature search and study selection is shown in
Figure 1.
Demographics and Characteristics of the included studies′ population
The included patients were T1DM in Hegazy et al., both types in Ziegler et al. and uncomplicated T2DM in the remaining studies (Zhao et al. recruited DM patients who were suffering from acute cerebral infarction as well). The follow-up duration ranged from three weeks to six months.
The daily doses of ALA were 300 and 600 mg orally or intravenously. A summary of the baseline characteristics of the study patients is shown in
Table 1.
Risk of bias
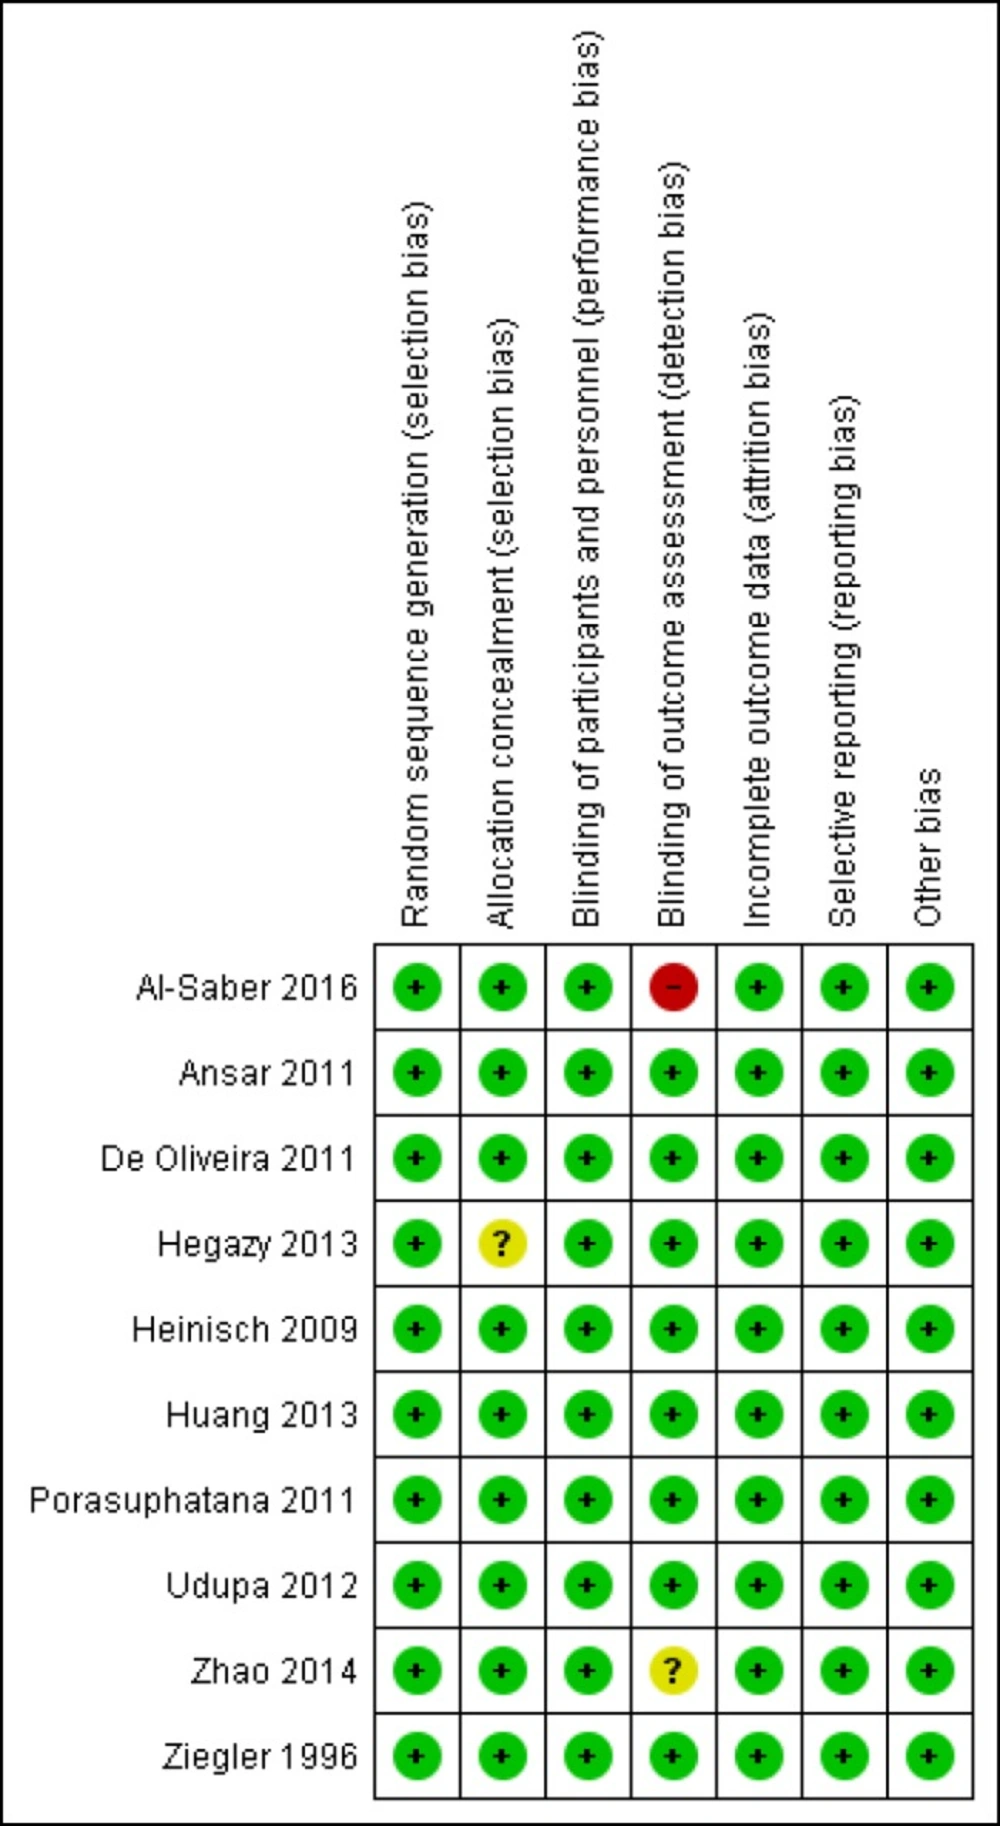
All included studies were at low risk of bias in terms of random sequence generation, blinding of the participants, incomplete outcome data, and selective reporting. Nine out of 10 were at low risk of bias in terms of allocation concealment, and eight out of 10 were at low risk of blinding of the outcome assessment. The results were summarized with Review Manager version 5.3, and the graphical display is shown in
Figure 2. Our evaluation showed that our systematic review and meta-analysis included high-quality studies.
Efficacy outcomes of LEV
Glycated hemoglobin
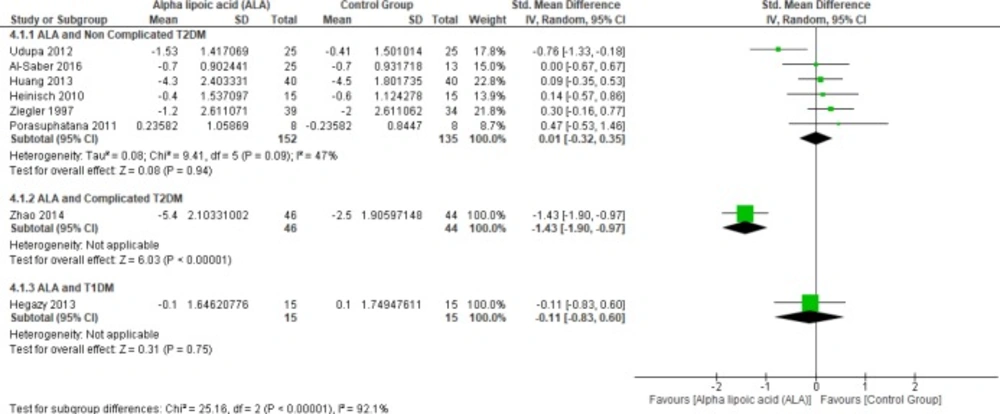
Six studies (
1,
4,
22 and
25–
27) reported HbA1c in uncomplicated T2DM patients (n = 287 Participants), the overall SMD did not favor either of the two groups (SMD = 0.01, 95% CI [-0.32, 0.35];
p = 0.94) as shown in
Figure 3.
In terms of T1DM, Hegazy
et al. demonstrated that there was no significant difference between the two groups (SMD = -0.11, 95% CI [-0.83, 0.60];
p = 0.75) (
13).
On the other hand, one study by Zhao
et al. reported HbA1c in complicated T2DM and ALA was superior to placebo (SMD = -1.43, 95% CI [-1.90, -0.97];
p < 0.00001) (
12).
Fasting blood glucose
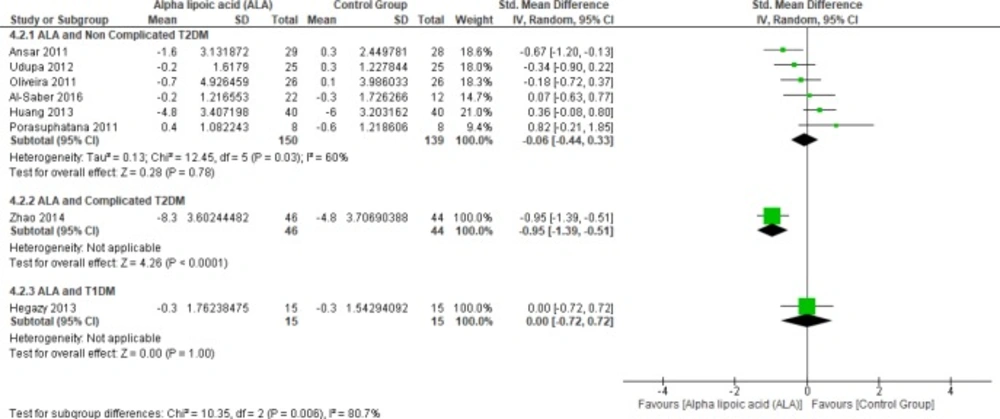
In terms of T1DM, Hegazy
et al. showed no significant difference between the two groups (SMD = 0.00, 95% CI [-0.72, 0.72];
p = 1.00) (
13). Moreover, one study investigated the effect of ALA on FBG in complicated T2DM (12). In this study, ALA was superior to placebo (SMD = -0.95, 95% CI [-1.39, -0.51];
p < 0.0001).
Six studies (
1,
2,
4,
22 and
27-
28) reported the effect of ALA on FBG in uncomplicated T2DM patients (n = 289 Participants). The overall SMD did not favor either of the two groups (SMD = -0.06, 95% CI [-0.44, 0.33];
p = 0.78) as shown in
Figure 4. The pooled studies were heterogeneous (
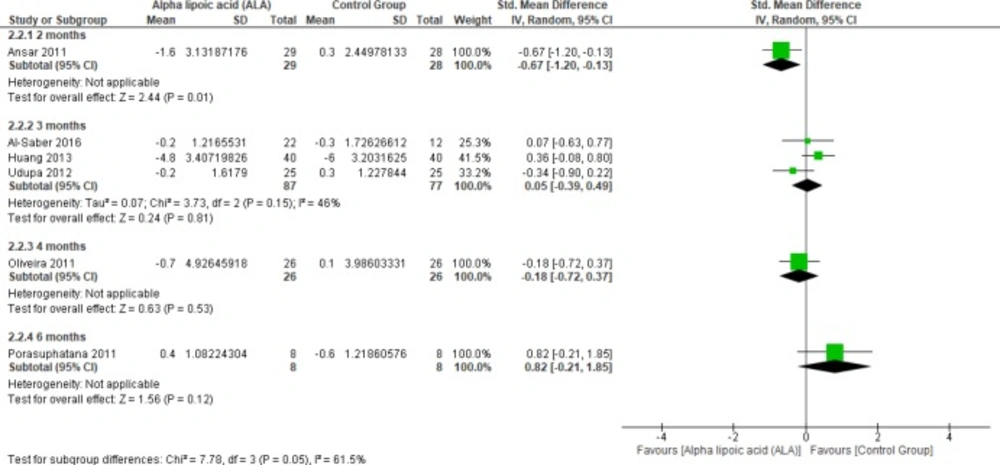
p = 0.03; I² = 60%). Heterogeneity was resolved by subgroup analysis according to follow up periods (two, three, five, and six months) as shown in
Figure 5. One study reported FBG in two months, ALA was superior to placebo (SMD = -0.67, 95% CI [-1.20, -0.13];
p = 0.01) (
2). While three studies reported FBG in three months with no significant difference between the two groups (SMD = 0.05, 95% CI [-0.39, 0.49];
p = 0.81) (1, 22 and 27). The pooled studies were homogeneous (
p = 0.15); I² = 46%).
One study reported FBG in four-months follow-up period with no significant difference between the two groups (SMD = -0.18, 95% CI [-0.72, 0.37]; p = 0.53) (28). Only one study by Porasuphatana et al. reported FBG in six months with no significant difference between the two groups (SMD = 0.82, 95% CI [-0.21, 1.85]; p = 0.12).
Post-prandial blood glucose
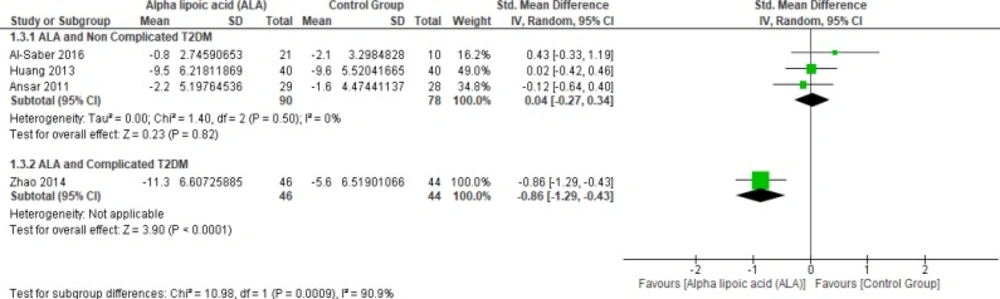
In terms of uncomplicated T2DM, three studies reported PPBG (n = 168 Participants) (
2,
22 and
27). The overall SMD did not favor either of the two groups (SMD = 0.04, 95% CI [-0.27, 0.34];
p = 0.82) as shown in
Figure 6. The pooled studies were homogeneous (
p = 0.50; I² = 0%).
While one study reported PPBG in complicated T2DM and ALA was superior to placebo (SMD = -0.86, 95% CI [-1.29, -0.43];
p < 0.0001) (
12).
Triglycerides
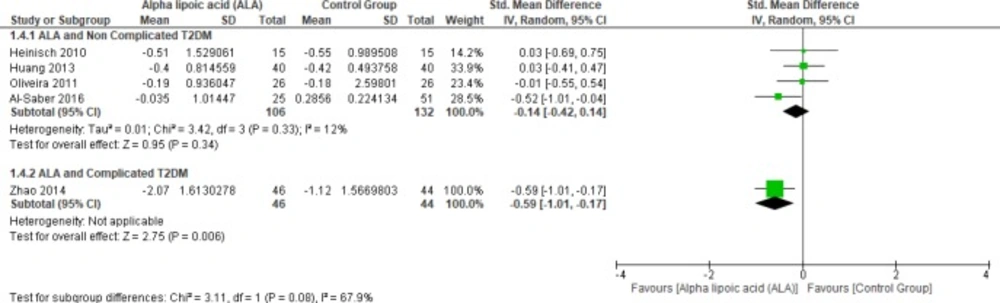
In terms of uncomplicated T2DM, four studies reported TG (n = 238 Participants) (
22,
25 and
27–
28). The overall SMD did not favor either of the two groups (SMD = -0.14, 95% CI [-0.42, 0.14];
p = 0.34) as shown in
Figure 7. The pooled studies were homogenous (
p = 0.33); I² = 12%). On the other hand, only one study reported triglycerides in the patients with complicated T2DM; the ALA group was superior to the placebo group (SMD = -0.59, 95% CI [-1.01, -0.17];
p = 0.006) (
12).
Total Cholesterol
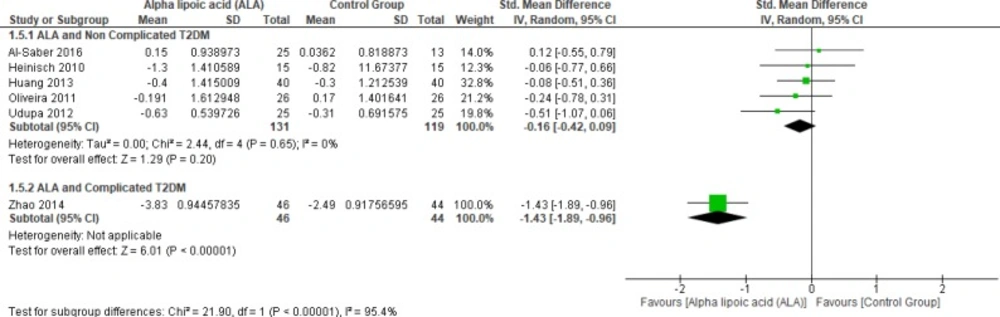
In terms of complicated T2DM one study by Zhao et al. (2014) reported blood TC and ALA was superior to placebo (SMD = -1.43, 95% CI [-1.89, -0.96]; p < 0.00001) (12).
On the other hand, five studies (1, 22, 25 and 27–28) reported in TC uncomplicated T2DM (n = 250 Participants). The overall SMD did not favor either of the two groups (SMD = -0.16, 95% CI [-0.42, 0.09];
p = 0.20) as shown in
Figure 8. The pooled studies were homogenous (
p = 0.65); I² = 0%).
Low-density lipoprotein
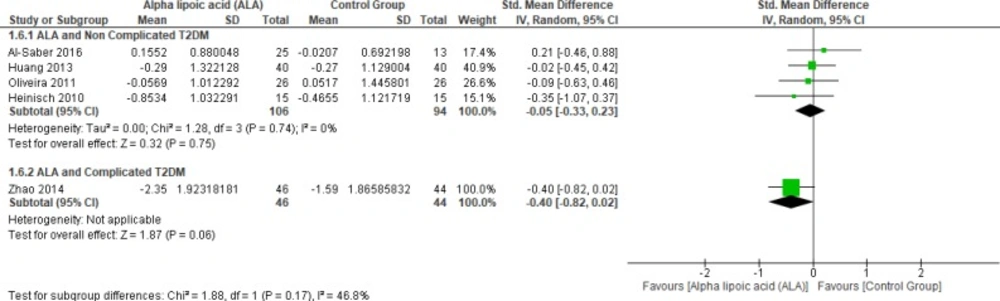
Four studies (22, 25 and 27–28) reported LDL in uncomplicated T2DM (n = 200 Participants). The overall SMD did not favor either of the two groups (SMD = -0.05, 95% CI [-0.33, 0.23];
p = 0.75) as shown in
Figure 9. The pooled studies were homogenous (
p = 0.74; I² = 0%), while one study by Zhao
et al. (2014) reported LDL in complicated T2DM with no significant difference between the two groups (SMD = -0.40, 95% CI [-0.82, 0.02];
p = 0.06) (12).
High-density lipoprotein
Four studies (22, 25 and 27–28) reported HDL in uncomplicated T2DM (n = 200 Participants). The overall SMD did not favor either of the two groups (SMD = -0.05, 95% CI [-0.35, 0.25];
p = 0.75) as shown in
Figure 10. The pooled studies were homogenous (
p = 0.33; I² = 12%).
Waist circumference
Two studies reported waist circumference (n = 130 Participants) (1, 22). The overall SMD did not favor either of the two groups (SMD = -0.03, 95% CI [-0.37, 0.32];
p = 0.87) as shown in
Figure 11. The pooled studies were homogenous (
p = 0.54); I² = 0%).
Glutathione peroxidase
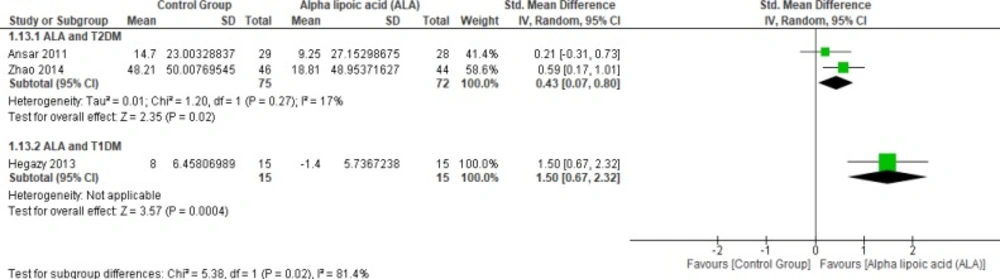
Two studies (2, 12) reported Gpx (n = 147 Participants). The overall SMD favored ALA-treated group over placebo group in T2DM (SMD = 0.43, 95% CI [0.07, 0.8];
p = 0.02) as shown in
Figure 12. The pooled studies were homogenous (
p = 0.27); I² = 17%), in T1DM (SMD = 1.50, 95% CI [0.67, 2.32];
p = 0.0004).
Homeostatic model assessment insulin resistance
Four studies reported HOMA-IR in T2DM (n = 279 Participants). The overall SMD did not favor either of the two groups in this outcome (SMD = -0.15, 95% CI [-0.39, 0.09];
p = 0.21) as shown in
Figure 13. The pooled studies were homogenous (
p = 0.01; I² = 51%).