Cell lines and reagents
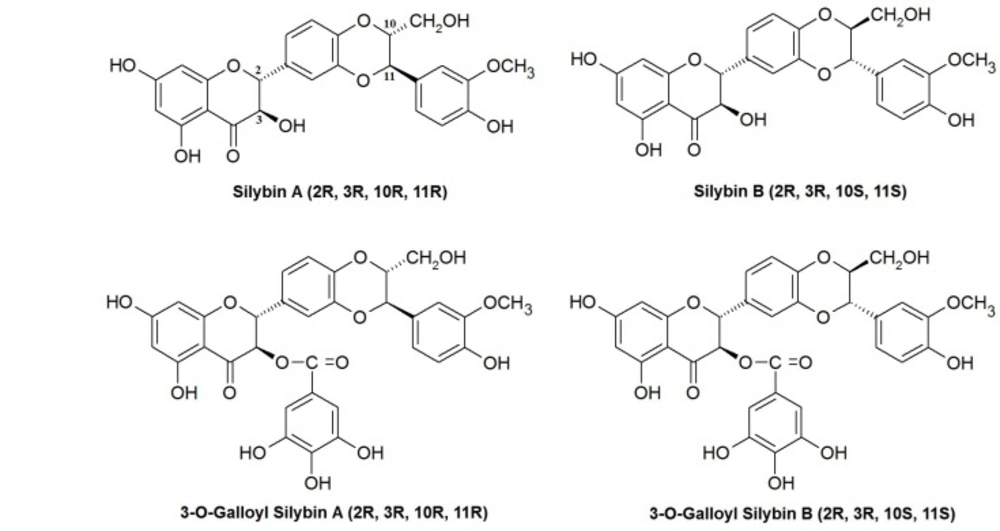
The human hepatocarcinoma cell line Hep G2 was obtained from Institute Pasteur Center for Medical Research. The Hep G2 cells were maintained in Dulbecco’s modified Eagle’s medium (DMEM, Promega) supplemented with 10% of FBS (Promega) and 1% penicillin-streptomycin antibiotics (Promega) and were grown at 37 °C in a humidified atmosphere with 5% CO2. Silibinin isomers, their 3-O-galloyl derivatives, ceramide and other used reagents were bought from Sigma Chemical Co., St. Louis, MO, USA.
Cell cultures and preparation of lysates
The cell line was grown in RPMI-1640 medium supplemented with L-glutamine 2 mM, HEPESNa 25 mM, penicillin 100 U/mL, streptomycin 100 μg/mL and 10% phosphate-buffered saline (FBS) at 37 °C in a humidified atmosphere containing 5% CO2. Hep G2 cells were seeded at 1 × 10⁶ cells/mL and sub cultured every 2–3 days after 60–80% confluence was reached. To prepare the lysates cells attached to the culture plate were scraped off with a cell scraper and collected in a 1.5 mL tube by centrifugation. The cell pellets were rinsed with PBS, suspended in sterile water, and then lysed by sonication. For each experiment, the cells were treated separately with increasing concentrations of silibinin derivatives (0, 25, 50, 75, 100, 125, 150, 175 and 200 μM) and incubated for 48 h.
Cell viability
To measure cell viability, the 3-(4,5-dimethylthiazol-2-yl)-2,5-diphenyl tetrazolium bromide (MTT) colorimetric assay was performed as published (
32,
33). Briefly, Hep G
2 cells were seeded onto 96 flat bottom well plates (50 × 10
3 cells/well) and grown overnight. After the incubation period with silibinin isomers, cells were washed twice with phosphate-buffered saline solution and incubated with MTT solution at a final concentration of 0.5 mg/mL for 3 h and then lysed in dimethyl sulfoxide. Optical density was measured at 540 nm and the background absorbance measured at 660 nm was subtracted. Each experiment was replicated separately for three times. The results of cell viability are expressed as percentage of control, which was considered to be 100%.
Caspases activities
The activities of caspase-3 and 9 were measured using colorimetric substrates. Cells were added to a lysis buffer (100 mM HEPES [pH 7.5], 0.1% CHAPS, 1 mM PMSF, 10 mM MDTT, 1 mM EDTA) and placed on ice for 30 min. After the cells were centrifuged at 10,000 × g for 10 min at 4
°C, 50 μg of protein from the supernatants was added to each of the caspase substrates. The colorimetric substrates for caspase-3 and 9 were Ac-DEVD-pNA (Asp-Glu-Val-Asp-pNA) and Ac-LEHD-pNA (N-acetyl-Leu-Glu-His-Asp-pNA), respectively. After a 2 h incubation, to measure p-nitroanilide absorbance was determined at 405 nm (
34).
Quantifying of total ceramide
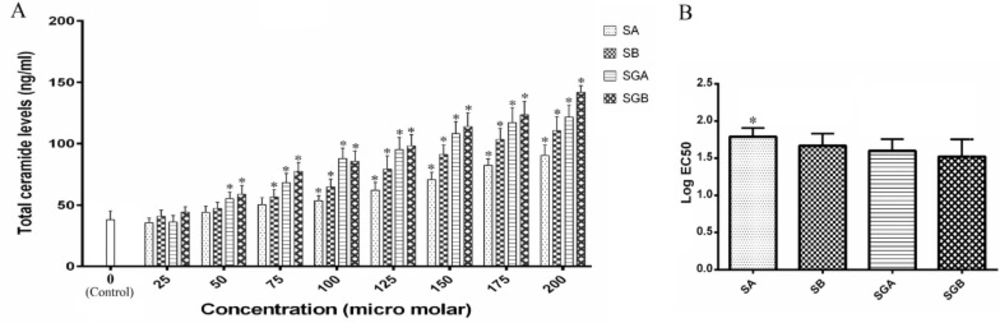
Sample (3 µL of cell extract cell lysate) was mixed with 3 µL of an ACDase assay solution (0.2 M citrate–phosphate buffer, pH 4.5, 0.3 M NaCl, 0.2% Igepal CA-630, 10% FBS, 50 ng/µL ACDase) and incubated at 37
°C for 1 h. The reaction was stopped by adding ethanol (1:5) and centrifuged for 5 min at 13,000 × g. 10 µL of the supernatant was transferred into 20 µL of 25 mM sodium borate buffer (pH 9.0) containing 1.25 mM sodium cyanide and 1.25 mM NDA. The reaction mixture was incubated at 50
°C for 10min, diluted with ethanol (1:4), and centrifuged for 5 min at 13,000 × g. 5 µL of the supernatant was applied to high-performance liquid chromatography (HPLC) for analysis. The HPLC system consisted of Waters 600 S controller, 616 pump, 474 scanning fluorescence detector, 717 auto sampler (Waters, Milford, MA) and BetaBasic-C18 (20 cm × 4.6 mm) column with 3 µM particle size (Thermo Electron, Bellefonte, PA) which was not temperature regulated. All chromatographic procedures were carried out at room temperature using a mobile phase of 90% methanol at a flow rate of 1.0 mL/min. The fluorescent derivatives were monitored at the excitation wavelength of 252 nm and the emission wavelength of 483 nm (
35). To calculate the final ceramide contents of the samples, the levels of the endogenous sphingosine (reaction mixture lacking ACDase) were subtracted from the signal obtained in the presence of ACDase. Analysis was based on the principle that one molecule of hydrolyzed ceramide yields one molecule of sphingosine. Standard calibration curves were generated as described above.
ACDase activity assays
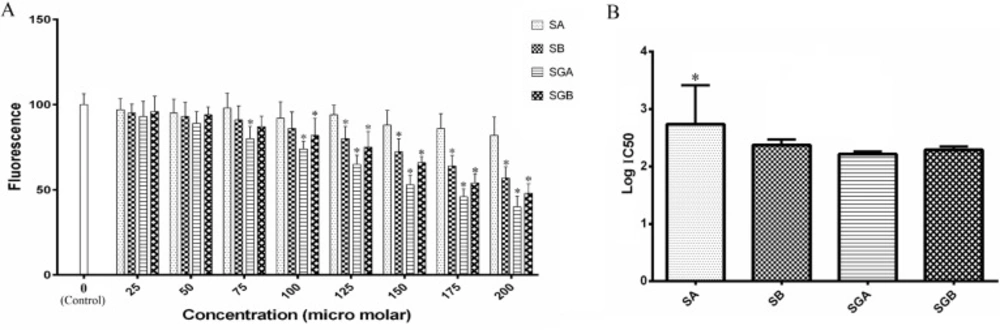
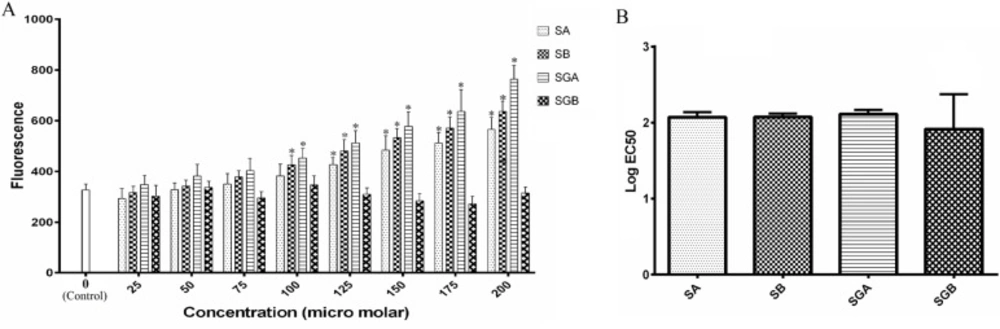
ACDase activity was measured in intact cells and in cell lysates by fluorogenic assays. For intact cell assays, cells (10,000/well) were seeded into 96-well plates in 10% FBS medium. After 24 h, medium was removed and replaced with 5% FBS medium containing indicated concentrations of silibinin derivatives (controls contained ethanol vehicle). Plates were placed in a tissue culture incubator at 37 °C, 5% CO2 for 24 h and cell viability assays were conducted in parallel. Fluorogenic substrate (ethanol vehicle) was then added to a final concentration of 16μM (125 μL final well volume), and the plates were incubated for 3 h at 37 °C, 5% CO2. To complete the assays, 50 μL methanol and 100 μL NaIO4 (2.5 mg/mL) in 0.1 M glycine buffer with a pH of 10.6 were added and the plates were incubated in a dark place for 2 h at 37 °C. Fluorescence was measured in the UV range (365 nm excitation/410–460 nm emission) using a GloMax® multi-detection system (Promega, Madison, WI).
To measure ACDase activity in cell lysates, cells were harvested using trypsin/EDTA, washed three times in ice-cold PBS and re-suspended at a concentration of 1 × 10⁶ cells/mL in 0.2 M sucrose. After sonication on ice (microtip, 5–10 s), lysates were centrifuged at 20,000 × g at 4
°C for 15 min to remove debris. Protein in the supernatant was measured using the BCA assay (Pierce Products, Thermo Scientific, Rockford, IL) and bovine serum albumin standard curves. Supernatant protein (60 μg) was added to 96-well plates containing the indicated compounds and sodium acetate–acetic acid buffer, pH 4.5 (25 mM), and incubated for 1 h at 37
°C, in final well volume of 100 μL. Fluorescent substrate was added to a final concentration of 40 μM (125 μL total well volume), and the assay was incubated in the dark at 37
°C for 3 h. Fluorescence was then measured as described above (
23).
NSMase activity assays
Amplex™ Red NSMase Assay Kit (AAT Bioquest®, Inc. product no: 13620) was used to determine NSMases activity. The kit uses Amplite™ Red as a colorimetric probe to indirectly quantify the phosphocholine produced from the hydrolysis of sphingomyelin by NSMase.
Cells were washed with ice cold PBS and homogenized in neutral lysis buffer (20 mM Tris–HCl pH 7.4, 2 mM EDTA, 5 mM EGTA, 1 mM PMSF, 1% protein cocktail inhibitor and 1 mM sodium orthovanadate) for NSMase assays. Samples were kept on ice 15 min and centrifuged at 14,000 × g for 20 min at 4
°C. 100 µL of each supernatant fraction were incubated at 37
°C for 1hour with working solution. The fluorescence count of produced resorophine in the previous step was measured with a fluorescence micro plate reader by using excitation at 540 nm and emission at 590 nm (
36).
GCS activity assays
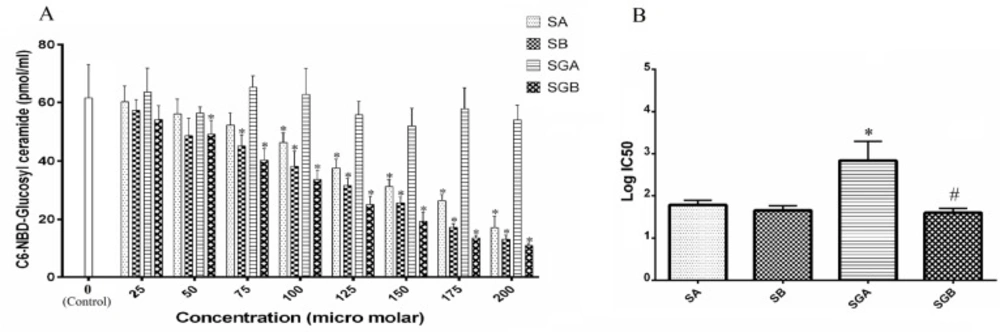
To determine GCS activities, the fluorescent acceptor substrate C6-4-nitrobenzo-2-oxa-1,3-diazole (NBD)-ceramide and a normal-phase HPLC were used. Acceptor substrate, 50 pM of C6-NBD-Cer and 6.5 nM of lecithin were mixed in 100 µL of ethanol and then the solvent was evaporated. Next, 10 µL of water was added and the mixture was sonicated to form liposomes. For the GCS assay, 50 µL of reaction mixture contains 500 µM UDP-Glc, 1mM EDTA, 10 µL of C6-NBD-Cer liposome and 20 µL of an appropriate amount of enzyme in lysis buffer. Addition of conduritol B epoxide (CBE) at 2.5 mM is effective at inhibiting the glycosidase activity. Standard assays were carried out at 37
°C for 1 h. The reaction was stopped by adding 200 µL of chloroform/methanol (2:1, v/v). After a few seconds of vortexing, 5 µL of 500 µM KCl was added and then centrifuged. After the organic phase had dried up, lipids were dissolved in 200 µL of isopropyl alcohol/n-hexane/H
2O (55:44:1) and then transferred to a glass vial in auto sampler. A 100 µL aliquot of sample was automatically loaded onto a normal-phase column (Intersil SIL 150A-5, 4.6 x 250 mm, GL Sciences, Japan) and eluted with isopropyl alcohol/n-hexane/H
2O (55:44:1) at a flow rate of 2.0 mL/min. Fluorescence was determined using a fluorescent detector (Hitachi L-7480) set to excitation and emission wavelengths of 470 and 530 nm, respectively. The fluorescent peaks were identified by comparing their retention times with those of standards (
37).
Statistical analysis
Each experiment was replicated separately for three times. The collected values were analyzed independently, presented as mean ± SD and submitted to statistical evaluation.
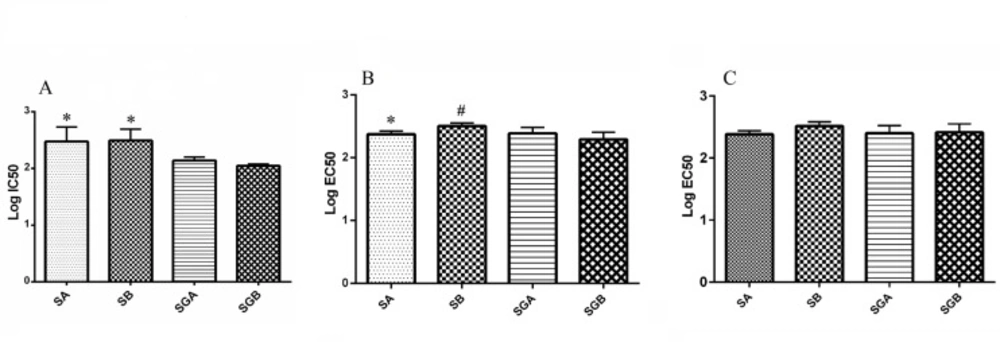
The one-way analysis of variance (ANOVA) followed by Tukey’s post-hoc test multiple comparisons was used to indicate the statistical significance of differences between the experimental means. P value< 0.05 was considered significant for all analyses. The data were analyzed using SPSS software (version 19.0). IC50 and EC50 values for each compound were determined by GraphPad Prism software (version 6.07).