Dibudipine and mebudipine were purchased from Pars Biopharmacy Research Co. (Tehran, Iran). Medium chain triglyceride (MCT), soybean phosphatidylcholine (Lipoid S75) kindly provided by Lipoid GmbH (Ludwigshafen, Germany). HPLC grade acetonitrile, methanol and dichloromethane were obtained from Merck (Darmstadt, Germany). Double distilled water was obtained through a Milli-Q system (Millipore, USA). The vegetable oils were provided by Barij Essence Co. (Kashan, Iran).
Solubility study
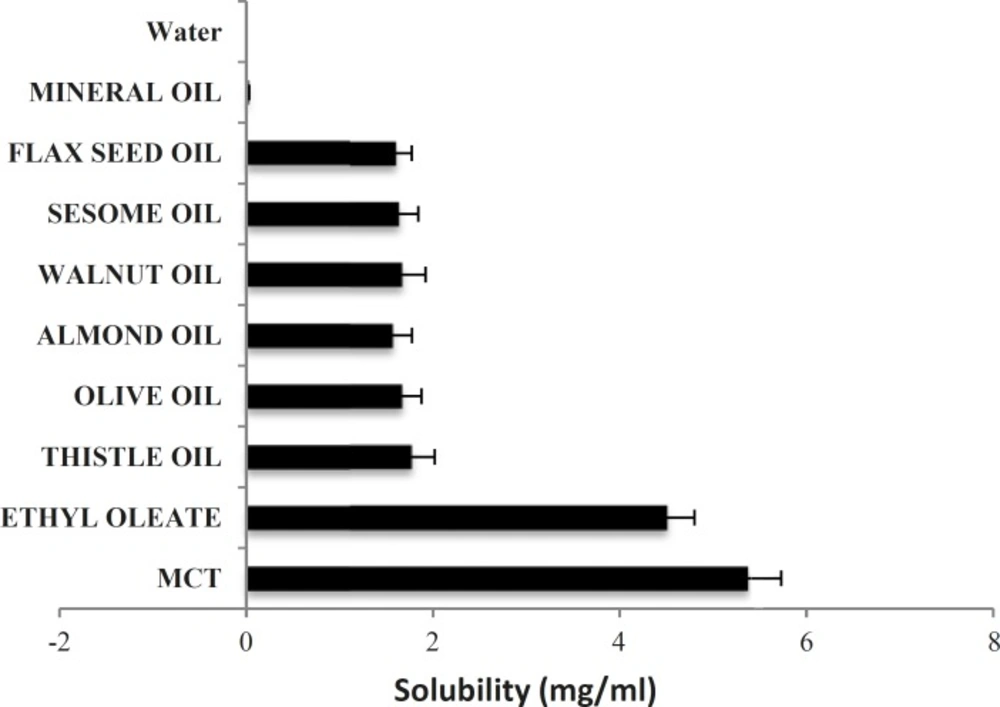
The solubility of dibudipine in different oils including MCT, Ethyl oleate, Thistle oil, Olive oil, Almond oil, Walnut oil, Flax seed oil and Mineral oil was determined by saturation solubility technique (
11). An excess amount of the dibudipine added to small volume (1 mL) of the solvent and vortexed for 10 min. After equilibration by shaking at room temperature for 48 h, the mixture was centrifuged at 3000rpm for 20 min. The supernatant was withdrawn and filtered through a 0.2 μm syringe filter then analyzed by high performance liquid chromatography (HPLC).
Preparation of dibudipine phytosolve
For preparation of Phytosolve formulation, 20 mg of dibudipine was dissolved in 2 g of MCT oil. 0.5 g of phospholipid (Lipoid S75) was dispersed in the 7.5 g of polyol phase at room temperature and homogenized using an Ultra-Turax homogenizer (IKA T10B, Germany). The oily phase (MCT plus dibudipine) was added slowly to the phospholipid-polyol phase and mixed well. Final mixture was sonicated with a probe sonicator (Hielscher, Germany) with a 70% amplitude and cycle 0.6 for 10 min to decrease particle size in emulsion. Different Phytosolve formulations were prepared with various polyol phases such as glycerol, a 70% fructose solution or a 70% sucrose solution to achieve an optimum formulation.
Characterization of formulation
Measurement of size and zeta potential
The mean particle size, poly dispersity index and zeta potential of the Phytosolve formulation were measured using photon correlation spectroscopy instrument, zetasizer Nano (Malvern, UK) at 25 °C. The formulation was diluted with distilled water (1:100) to avoid particle interaction during measurement.
Physical robustness to dilution
The formulations were diluted 50, 100, 500 and 1000 times with double distilled water. The diluted emulsion were evaluated for any physical changes such as precipitation or phase separation after 24 h, one week and one month storage in 4 °C.
Percentage transmittance
Phytosolve formulations were diluted 200 times with distilled water and %Transmittance was measured using UV-Visible spectrophotometer (Pharmacia Biotech, UK) at 650 nm against distilled water as blank. The stability of different Phytosolve formulations (DPF, DPG, DPS) were assessed through transmittance measurement 30 minute after preparation and 7 days later.
Transmission electron microscopy
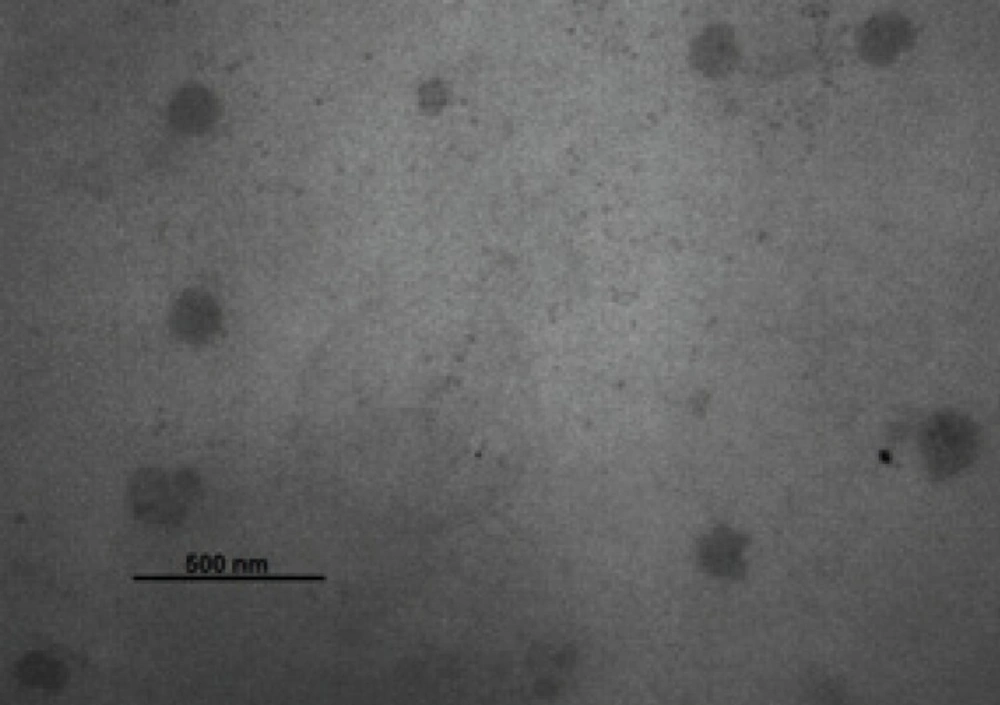
A drop of diluted formulation were deposited on a 200 mesh holey film grid and stained with uranyl acetate after drying. The samples were observed with LEO 906 transmission electron microscope (ZEISS, Germany).
Pharmacokinetic study
Male Wistar rate weighing 250-300 mg were obtained from the Razi institute (Karaj-Iran). The protocol of animal experimental study was approved by ethics committee of the Tehran University of Medical Sciences. The animals were kept in standard condition (25 ± 2
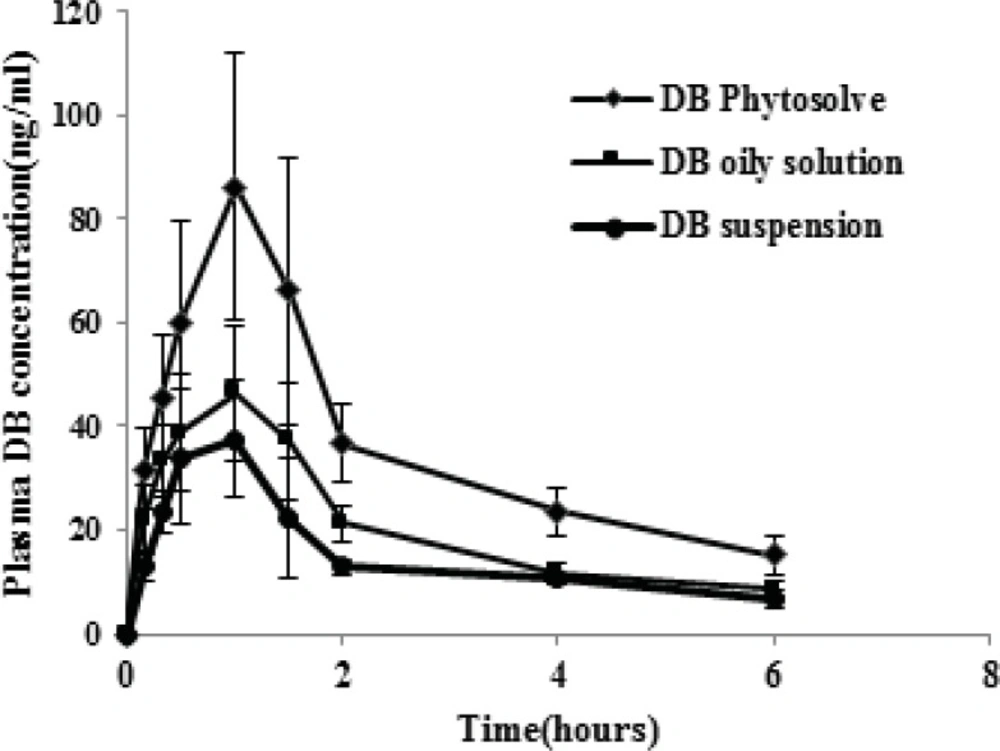
° C and 55 ± 5% humidity). They fasted overnight with free access to water before drug administration. The Phytosolve and control formulations (oily solution, suspension) were administered orally (10 mg/Kg) with a gavage needle. The dibudipine suspension was prepared with hydroxymethylcellulose as suspending agent in water. The blood samples (500 μL) were collected via a catheter which implanted 2 days before the experiment in the jugular vein according to Thrivikraman reported protocol (
12) in heparinized tube at 0, 10, 20, 30, 60, 90, 120, 240 and 360 min after orally administration. The plasma was separated by centrifugation at 5000 rpm for 20 min and stored at -20
ͦ C until analysis with HPLC.
Analysis of dibudipine concentration
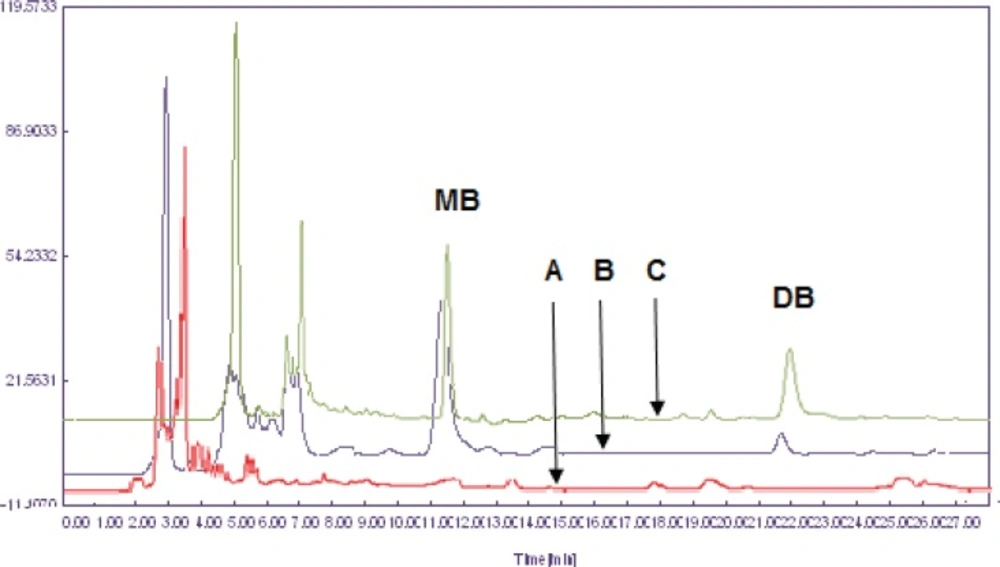
A reverse phase HPLC system containing a 600 pump, a UV-vis detector and manual injector (Youngling, Korea), software (Autochro-2000) and a tracer excel ODS-A analytical column (4.6*250 mm, 5 um) was used to assay the plasma concentration of dibudipine. The mobile phase was methanol:acetonitrile:water (75:5:25) with flow rate 1 mL/min. The UV detector was adjusted on 238 nm for analysis.
Plasma sample preparation
Mebudipine was used as internal standard and 10 μL (4 μg/mL) of it was added to 200 μL of the plasma sample. There were mixed using a vortex mixer and 200 μL of NaOH (1 N) was added to them. After mixing for 1 min, 2 mL of dichloromethane was added and vortexed vigorously for 5 min and centrifuged at 5000 rpm for 25 min. The organic layer was transferred to a clean tube and evaporated at 40 °C under nitrogen flow. The residue was reconstituted in 100 μL of the mobile phase and the solution (20 μL) was injected on to the HPLC for analysis.
The calibration curve for linearity was plotted using five concentrations (10, 50, 100, 500 and 1000 ng/mL) of dibudipine in blank plasma. The recovery percentage of dibudipine was determined by comparing the peak area of the extracted dibudipine from the plasma with the peak area of obtained by the direct injection of a pure standard dibudipine in mobile phase at three different concentrations (100, 500 and 1000 ng/mL).
The accuracy and precision of method and interday, intraday analysis variability were determined over the four concentrations (10, 100, 500 and 1000 ng/mL) in the blank plasma.
Various pharmacokinetic parameters (Cmax, Tmax, AUC and T½) were calculated for dibudipine Phytosolve, oily solution and suspension. The percent relative bioavailability (%F) of Phytosolve to reference formulations (suspension and oily solution) was calculated as bellow:
%F = (AUC0-∞ product/AUC0-∞ reference) ×100
The maximum concentration (Cmax) and the time needed to reach the maximum concentration (Tmax) values were obtained directly from the concentration versus time curve.
The area under the plasma drug concentration-time curve from 0 to 6 h (AUC
0-6) was calculated through the trapezoidal method. The area under the plasma drug concentration-time curve from 0 to infinity (AUC
0-∞) was calculated via the sum of the areas obtained by the trapezoidal method (AUC
0-6) and residual area (AUC
6-∞). The residual area and T
½ were obtained according to following equations (
13).
AUCt-∞ = Ct/ke
T½ = ln2/ke
Statistical analysis
All data are reported as mean ± S.D. Statistical comparisons were made using one way analysis of variance (ANOVA) followed by Tukey post hoc test at a level of significance of P < 0.05 using SPSS software (version 14).