
1. Background
Effective sedation in mechanically ventilated children in the pediatric intensive care unit (PICU) is essential to optimize therapeutic interventions, relieve pain associated with invasive procedures, and reduce sedation-related complications (1). In current PICU practice, benzodiazepines such as midazolam and opioids such as fentanyl remain the primary sedative and analgesic agents (2). However, these drugs are frequently associated with hemodynamic instability, respiratory depression, and delayed recovery (3). Because these adverse effects are dose-dependent, current sedation strategies aim to achieve adequate sedation with the lowest possible exposure to conventional agents. Concurrently, these strategies seek to maintain ventilator synchrony, prevent unplanned extubation and device dislodgement, and preserve patient comfort and safety (1, 4). One such strategy is the use of adjunctive agents with different mechanisms of action.
Dexmedetomidine has attracted interest because of its pharmacologic profile (5). It exerts sedative, analgesic, and anxiolytic effects primarily through α_2A receptors in the locus coeruleus and the dorsal horn of the spinal cord (6). Unlike many conventional sedatives, dexmedetomidine can produce “cooperative” sedation; patients remain calm, easily arousable, and interactive, and then return to sleep without external stimulation (3). Notably, dexmedetomidine does not cause significant respiratory depression and has demonstrated potential neuroprotective effects (7). These attributes make it potentially advantageous for specific patient groups, such as those with cerebral ischemia or Down syndrome (8).
2. Objectives
Although dexmedetomidine is widely used in the PICU, current pediatric guidance emphasizes lighter, protocolized, benzodiazepine-sparing sedation and provides limited dose-specific direction for children, which may contribute to practice variation. Therefore, we designed an early-phase, process-focused, triple-blind, randomized trial to test whether adding a fixed, low-dose dexmedetomidine infusion without a bolus to standard midazolam-fentanyl sedation reduces opioid and benzodiazepine exposure per ventilator-day (primary outcome) and whether it affects the time to successful extubation and hemodynamic safety (secondary outcomes). We also prespecified exploratory longitudinal analyses of repeated physiologic and clinical measures and early competing-risk analyses for extubation in this high-mortality setting (4, 9).
3. Methods
3.1. Study Design, Setting, Ethics, and Registration
This triple-blind, parallel-group randomized controlled trial (RCT) was conducted in the Pediatric Intensive Care Unit of Mofid Children’s Hospital, affiliated with Shahid Beheshti University of Medical Sciences, Tehran, Iran, from August 2024 to August 2025, and was reported in accordance with the Consolidated Standards of Reporting Trials (CONSORT) 2010 statement. Written informed consent was obtained from legal guardians before enrollment. The protocol was approved by the Ethics Committee of Shahid Beheshti University of Medical Sciences (IR.SBMU.PHARMACY.REC.1402.066) and was registered prospectively in the Iranian Registry of Clinical Trials (IRCT20230520058235N1).
3.2. Participants
Eligible participants were children aged 1 month to 12 years admitted to the PICU who required invasive mechanical ventilation and continuous sedative infusion for ongoing sedation. Exclusion criteria included clinically significant bradycardia, hypotension, cardiac arrhythmias, and central nervous system disorders that could confound sedation or neurologic assessment (including head trauma, encephalitis, or meningitis), as well as concurrent barbiturate therapy. Participants were enrolled after eligibility was confirmed by the clinical team.
3.3. Randomization, Allocation Concealment, and Blinding
Participants were randomized in a 1:1 ratio to the intervention or control group using computer-generated block randomization with variable block sizes (4 and 6). The random sequence was generated by an individual not involved in patient care or outcome assessment. Allocation concealment was ensured using identical, anonymized study packaging prepared according to the randomization code. Implementation followed standard CONSORT roles: sequence generation was independent, enrollment was performed by clinical personnel, and group assignment was applied via concealed coded packages.
The trial was triple-blind: participants’ guardians, treating clinicians and bedside nurses, outcome assessors, and the data analyst were blinded to group assignment until database lock and completion of the primary analysis. Unblinding was permissible only when required for urgent clinical decision-making.
3.4. Interventions and Co-interventions
Both groups received standard sedation with continuous intravenous midazolam and fentanyl infusions per routine PICU practice, titrated to a nurse-assessed target on the RASS. The intervention group additionally received dexmedetomidine as a continuous intravenous infusion at a fixed rate of 0.2 µg/kg/h. No routine loading bolus was administered at initiation. Study treatment was continued for up to 7 days from randomization or until cessation of invasive ventilation, PICU discharge, death, or a clinician’s decision to stop sedation based on clinical status, whichever occurred first.
3.4.1. Rescue and Adjunct Medications
If acute agitation, ventilator dyssynchrony, or brief painful procedures occurred despite stepwise adjustment of continuous infusions, the attending clinician could administer small weight-based rescue boluses of fentanyl for analgesia or midazolam for anxiolysis at their discretion. Lorazepam could also be used as a clinician-directed rescue benzodiazepine under the unit protocol, but it was not part of the study intervention. Because concomitant lorazepam during midazolam infusion could increase the overall benzodiazepine effect, all such use was prospectively recorded separately and was not included in the prespecified cumulative midazolam exposure outcome. Methadone and morphine could also be used as adjunct opioid medications at clinician discretion; these were recorded separately and were not included in the prespecified cumulative fentanyl exposure outcome.
3.4.2. Exposure Accounting
All administrations of midazolam and fentanyl used for ongoing sedation management, including continuous infusion and any rescue boluses, were included in cumulative exposure calculations for the primary outcome.
3.5. Data Sources and Variables
Clinical data were extracted from patient records using a standardized data collection form. Collected variables included demographics, indication for admission, intubation metrics, ventilation duration, sedative doses, use of additional sedatives or muscle relaxants, clinical functional or risk assessment scores (Pediatric Cerebral Performance Category [PCPC] (10), Pediatric Overall Performance Category [POPC] (10), Pediatric Risk of Mortality Score III [PRISM III] (11), and quick Sequential Organ Failure Assessment [qSOFA] (12), need for methadone, vital signs, adverse events (eg, bradyarrhythmia, hypotension, seizures), length of PICU and hospital stay, and outcomes.
3.6. Outcomes
3.6.1. Primary Outcome
The prespecified primary outcome was sedative-analgesic exposure per ventilator-day during study days 1 - 7, operationalized as 2 prespecified component measures:
1) Cumulative fentanyl per kg per ventilator-day (µg·kg⁻¹·day⁻¹)
2) Cumulative midazolam per kg per ventilator-day (mg·kg⁻¹·day⁻¹)
Family-wise type I error across these 2 component tests was controlled at α = 0.05 using the Holm procedure. A ventilator-day was defined as any calendar day with invasive mechanical ventilation during study days 1 - 7. Per-ventilator-day scaling was calculated as the total dose over days 1 - 7 divided by the number of ventilator-days in that window.
If no day-level administration record was present for a given drug, that day was treated as no administration for that drug in the primary calculations because exposure abstraction relied on medication administration records. However, undocumented administrations cannot be excluded; therefore, this approach may have underestimated true sedative exposure.
3.6.2. Secondary Outcomes
Prespecified secondary outcomes included time to first successful extubation, ventilator-free days to day 28 (VFD-28), rescue benzodiazepine use (lorazepam or diazepam), use of adjunct medications (ketamine, methadone, morphine, cisatracurium), hemodynamics, the Glasgow Coma Scale (GCS), qSOFA, adverse events, and in-hospital mortality. Successful extubation was defined as removal of the endotracheal tube without reintubation within 48 hours. Extubation failure was defined as reintubation within 48 hours. VFD-28 was defined using the conventional composite endpoint definition: patients who died by day 28 were assigned 0 VFD-28; among patients alive at day 28, VFD-28 was calculated as 28 minus days of invasive ventilation through day 28. This approach avoids assigning apparently favorable ventilator-free days to patients who die early.
3.6.3. Prespecified Sensitivity Analyses
To address unequal ventilation time and early exposure patterns, fentanyl and midazolam exposure over 0 - 48 hours from randomization was summarized using the sum of study day 1 and study day 2 doses per kg and was additionally normalized per ventilator-day within the same 0 - 48-hour window. These analyses were prespecified as sensitivity analyses and were interpreted as exploratory, with descriptive P values and no multiplicity adjustment beyond the primary Holm-controlled comparisons.
3.7. Sample Size
Sample size planning used an a priori standardized mean difference (SMD) informed by prior randomized data in ventilated children (Tobias and Berkenbosch, 2004) (13). Based on reported group means and standard deviations for supplemental morphine (midazolam, 0.74 ± 0.50 vs dexmedetomidine, 0.28 ± 0.12 mg/kg/24 h), we estimated Cohen d of approximately 1.27 (pooled SD, approximately 0.36). For conservative planning in a heterogeneous PICU population, we powered the trial for a large effect size of d = 0.80 with α = 0.05 (2-sided) and 80% power, yielding a target sample size of 26 participants per group (total, 52) for an independent-samples comparison. Allowing 15% attrition, the final recruitment target was N = 60 (30 per group). Calculations were cross-checked using standard power planning references/software (14).
3.8. Statistical Analysis
Analyses followed the intention-to-treat principle. Distributional assumptions for continuous variables were assessed using Q-Q plots. Continuous data are summarized as mean (standard deviation) for approximately symmetric distributions or median (interquartile range [IQR], Q1 - Q3) for skewed distributions. Categorical variables are summarized as counts and percentages. Between-group comparisons used the Mann-Whitney U test for nonnormally distributed continuous outcomes and the chi-square test or Fisher exact test for categorical outcomes, as appropriate.
For the primary outcome, the 2 prespecified component comparisons (fentanyl per ventilator-day and midazolam per ventilator-day) were tested with family-wise error controlled using the Holm procedure at α = 0.05.
Because physiological and clinical outcomes (heart rate, blood pressure, GCS, qSOFA, and the binary outcome “need for ventilation”) were measured repeatedly during study days 1 - 7, correlated within-child observations were analyzed using generalized estimating equations (GEE) with an exchangeable working correlation and robust standard errors as exploratory longitudinal analyses. Continuous repeated outcomes used a linear identity-link GEE; the binary repeated outcome used a logistic-link GEE. A prespecified minimally adjusted model included the treatment group and the baseline value of the repeated outcome. A fuller prespecified model additionally adjusted for baseline risk and clinical covariates (age, sex, weight, PRISM III, PCPC), as well as cumulative fentanyl and midazolam exposure during days 1 - 7 and length of hospital stay, and was interpreted cautiously given the sample size relative to the covariate count. Full longitudinal model outputs were reported in Supplementary Table S1.
As a prespecified exploratory sensitivity analysis for time to first successful extubation, death before extubation was treated as a competing event. Cumulative incidence functions were estimated using the Aalen-Johansen estimator, and an adjusted discrete-time cause-specific hazard model (complementary log-log link) was fitted with adjustment for age (months) and PRISM III, restricted to study days 1 - 7 because only day-level indicators were available in that window. These competing-risk analyses were descriptive and were not used to support definitive conclusions on overall ventilation duration (15-17). All analyses used a 2-sided significance threshold of P < 0.05. Statistical analyses were performed using Stata version 17 (StataCorp LLC, College Station, TX, USA).
4. Results
Baseline characteristics were broadly comparable overall, although respiratory disorders were more frequent in the dexmedetomidine group than in the control group (13/30 [43.3%] vs 7/30 [23.3%]) (Table 1). Participant flow through the trial is summarized in Figure 1.
Table 1.
Baseline Characteristics of Randomized PICU Patients by Treatment Group (N = 60) a
| Factors | Control (n = 30) | Intervention (n = 30) | Total (n = 60) | P-Value b |
|---|---|---|---|---|
| General characteristics | ||||
| Age (mo) | 15 (6 - 36) | 12 (5 - 60) | 13.5 (6 - 48) | 0.997 |
| Age group (y) | 0.606 | |||
| < 1 | 14 (46.67) | 16 (53.33) | 30 (50.0) | |
| > 1 | 16 (53.33) | 14 (46.67) | 30 (50.0) | |
| Sex | 0.196 | |||
| Female | 12 (40.0) | 17 (56.67) | 29 (48.33) | |
| Male | 18 (60.0) | 13 (43.33) | 31 (51.67) | |
| Weight (kg) | 9.25 (6.5 - 12) | 10.5 (6 - 14) | 9.5 (6.3 - 12.5) | 0.760 |
| Primary admission diagnosis | 0.478 | |||
| Gastrointestinal disorders | 4 (13.33) | 2 (6.67) | 6 (10.0) | |
| Surgery | 5 (16.67) | 7 (23.33) | 12 (20.0) | |
| Metabolic disorders | 3 (10.0) | 2 (6.67) | 5 (8.33) | |
| Neurologic disorders | 3 (10.0) | 2 (6.67) | 5 (8.33) | |
| Respiratory disorders | 7 (23.33) | 13 (43.33) | 20 (33.33) | |
| Other diagnoses c | 8 (26.67) | 4 (13.33) | 12 (20.0) | |
| Clinical assessment | ||||
| PCPC score | 1 (1 - 1) | 1 (1 - 1) | 1 (1 - 1) | 0.637 |
| PCPC category | 0.704 | |||
| Normal | 26 (86.67) | 27 (90.0) | 53 (88.33) | |
| Mild disability | 0 (0.0) | 0 (0.0) | 0 (0.0) | |
| Moderate disability | 1 (3.33) | 2 (6.67) | 3 (5.0) | |
| Severe disability | 3 (10.0) | 1 (3.33) | 4 (6.67) | |
| PRISM III score | 15 (14 - 16) | 16 (15 - 18) | 15.5 (14 - 17) | 0.110 |
Abbreviations: IQR, interquartile range; PCPC, Pediatric Cerebral Performance Category; PICU, pediatric intensive care unit; PRISM III, Pediatric Risk of Mortality III.
a Values are expressed as No. (%) or median (IQR).
b P-values compare intervention vs control using the Mann-Whitney U test for continuous variables and the chi-square test or Fisher exact test for categorical variables.
c Other diagnoses include renal disease, immunosuppression, poisoning/toxic exposure, and malignancy.
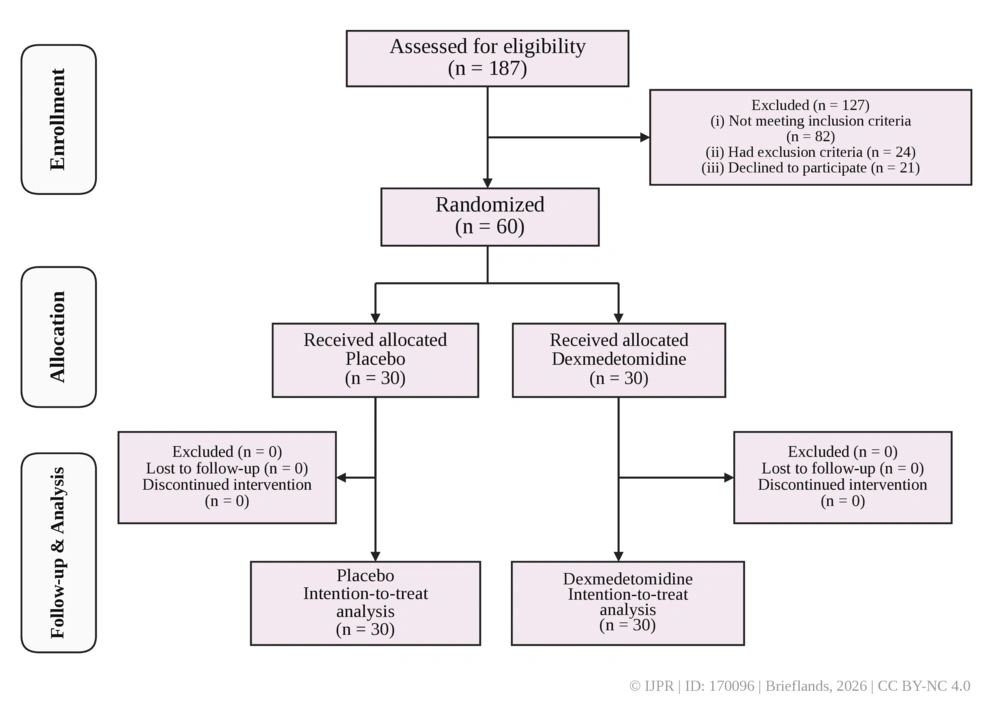
Figure 1.
CONSORT participant flow diagram
4.1. Primary Outcomes: Sedative-Analgesic Exposure Per Ventilator-Day During Days 1 - 7
The prespecified primary outcome had 2 components: fentanyl per ventilator-day and midazolam per ventilator-day. Family-wise error was controlled using the Holm procedure. Median fentanyl exposure per ventilator-day was 70.0 µg·kg-1·day-1 (IQR, 50.4 - 91.4) in the control group and 90.6 µg·kg-1·day-1 (IQR, 61.3 - 120.0) in the dexmedetomidine group, whereas median midazolam exposure per ventilator-day was 7.0 mg·kg-1·day-1 (IQR, 5.0 - 9.1) versus 9.1 mg·kg-1·day-1 (IQR, 6.1 - 12.0). The corresponding between-group median differences were 20.6 µg·kg-1·day-1 for fentanyl and 2.1 mg·kg-1·day-1 for midazolam, with 95% confidence intervals of -2.4 to 43.6 µg·kg-1·day-1 and -0.2 to 4.4 mg·kg-1·day-1, respectively. After Holm correction for the 2 prespecified primary comparisons, these differences did not reach statistical significance.
The primary outcome was sedative-analgesic exposure per ventilator-day during days 1 - 7, operationalized as 2 prespecified component measures: fentanyl (µg·kg-1·day-1) and midazolam (mg·kg-1·day-1). The Holm procedure was applied only to these 2 prespecified primary outcome components. Secondary endpoints and 0 - 48-hour sensitivity analyses are exploratory; their P values are descriptive and were not adjusted for multiplicity.
Seven-day cumulative doses (fentanyl in µg/kg and midazolam in mg/kg) and maximum infusion rates (µg/kg/h or mg/kg/h) are shown for context; because ventilation duration varied across patients, 7-day cumulative doses are not normalized for exposure time and should be interpreted descriptively.
Successful extubation was defined as removal of the endotracheal tube without reintubation within 48 hours; unplanned extubation was nonelective tube removal; extubation failure was reintubation within 48 hours.
These competing-risk analyses were prespecified as exploratory, were restricted to the first 7 study days because only day-level indicators were available, and are not used to support any definitive conclusions about overall ventilation duration.
Competing-risk rows report cumulative incidence functions estimated by the Aalen-Johansen method over study days 1 - 7. The cause-specific hazard for successful extubation (dexmedetomidine vs control) was estimated using a discrete-time complementary log-log model adjusted for age and PRISM III. Analyses were restricted to days 1 - 7 because only day-level indicators were available in that window (Table 2).
Table 2.
Sedation and Analgesia Exposure, Adjunct Use, and Key Clinical Outcomes Over the First 7 Study Days by Treatment Group a
| Factors | Control (n = 30) | Intervention (n = 30) | Total (n = 60) | P-Value |
|---|---|---|---|---|
| Primary outcome (days 1 - 7): exposure per ventilator-day | ||||
| Fentanyl per ventilator-day (µg/kg/day) | 70.00 (50.36 - 91.35) | 90.61 (61.30 - 120.00) | 75.11 (52.36 - 115.35) | 0.098 |
| Midazolam per ventilator-day (mg/kg/day) | 7.00 (5.04 - 9.14) | 9.06 (6.13 - 12.00) | 7.46 (5.24 - 11.53) | 0.107 |
| Cumulative dose over 7 days | ||||
| Fentanyl cumulative dose (µg/kg) | 332.50 (289 - 461) | 397.25 (326 - 617.50) | 361.50 (293.75 - 573.50) | 0.243 |
| Fentanyl maximum infusion rate (µg/kg/h) | 17 (14 - 24) | 19 (14 - 28) | 17.25 (14 - 25.5) | 0.738 |
| Midazolam cumulative dose (mg/kg) | 33.25 (28.90 - 46.10) | 41.10 (32.60 - 61.75) | 36.15 (29.37 - 57.35) | 0.220 |
| Midazolam maximum infusion rate (mg/kg/h) | 1.70 (1.40 - 2.50) | 1.90 (1.40 - 2.80) | 1.75 (1.40 - 2.65) | 0.891 |
| Dexmedetomidine cumulative dose (µg/kg/7 days) b | — | 30.40 (20.9 - 33.60) | — | — |
| Adjunct medications during study days 1 - 7 (therapeutic use only; intubation/procedural doses excluded) c | ||||
| Any adjunct (≥ 1 of ketamine, methadone, morphine, cisatracurium) | — | — | — | — |
| Ketamine | 28 (93.33) | 24 (80.0) | 52 (86.67) | 0.129 |
| Ketamine cumulative dose (mg) | 45.50 (30 - 60) | 35 (24 - 70) | 44.25 (28 - 60) | 0.408 |
| Methadone administered | 10 (33.33) | 13 (43.33) | 23 (38.33) | 0.426 |
| Methadone cumulative dose (mg) | 1.25 (0.6 - 1.7) | 2 (1.20 - 2.80) | 1.75 (0.80 - 2.35) | 0.070 |
| Morphine | 3 (10.0) | 4 (13.33) | 7 (11.67) | 1.00 |
| Morphine cumulative dose (mg) | 2 (1 - 10) | 1.10 (1 - 15.60) | 1.20 (1 - 10) | 0.914 |
| Cisatracurium administered | 20 (66.67) | 25 (83.33) | 45 (75.0) | 0.136 |
| Cisatracurium cumulative dose (mg) | 4 (2 - 6.10) | 2.80 (1.50 - 5) | 3 (2 - 5.50) | 0.396 |
| Rescue benzodiazepines (a priori definition) c | ||||
| Any rescue benzodiazepine (lorazepam or diazepam | — | — | — | — |
| Lorazepam | 3 (10.0) | 9 (30.0) | 12 (20.0) | 0.104 |
| Lorazepam cumulative dose (mg) | 2 (1 - 4) | 6 (5 - 8) | 5 (2.50 - 8) | 0.045 |
| Diazepam | 2 (6.67) | 2 (6.67) | 4 (6.67) | 1.00 |
| Diazepam cumulative dose (mg) | 7 (2 - 12) | 4 (2 - 6) | 4 (2 - 9) | 1.00 |
| In-hospital events | ||||
| Alive | 17 (56.67) | 14 (46.67) | 31 (51.67) | 0.483 |
| Deceased | 13 (43.33) | 16 (53.33) | 29 (48.33) | — |
| Seizure | 0 (0.0) | 2 (6.67) | 2 (3.33) | 0.492 |
| Length of hospital stay (d) | 29 (21 - 53) | 27 (21 - 36) | 27.5 (21 - 41) | 0.416 |
| Length of PICU stay (d) | 18 (11 - 35) | 23 (17 - 28) | 22 (13 - 30.5) | 0.424 |
| Time to successful extubation (d) | 15 (10 - 15) | 6 (3 - 10) | 10 (10 - 15) | 0.006 |
| Unplanned extubation | 5 (16.67) | 1 (3.33) | 6 (10.0) | 0.195 |
| Extubation failure | 6 (20.0) | 8 (26.67) | 14 (23.33) | 0.542 |
| Competing-risk analysis (days 1 - 7) | ||||
| CIF for successful extubation to day 7, % | 46.7 | 36.7 | — | NA |
| CIF for death to day 7 (competing event) | 33.3 | 43.4 | — | NA |
| Cause-specific hazard of successful extubation (dexmedetomidine vs control) | — | 0.77 (95% CI, 0.34 - 1.74) | — | 0.54 |
| Sensitivity analysis d | ||||
| Fentanyl dose 0 - 48 h (µg/kg) | 112.5 (63.0 - 103.0) | 160.0 (96.0 - 225.0) | 129.0 (68.0 - 179.0) | < 0.001 |
| Midazolam dose 0 - 48 h (mg/kg) | 8.05 (6.30 - 10.30) | 16.00 (9.60 - 22.50) | 9.60 (6.80 - 17.90) | < 0.001 |
| Fentanyl per ventilator-day 0 - 48 h (µg/kg/day) | 45.0 (31.5 - 63.3) | 83.3 (48.0 - 120.0) | 55.5 (34.0 - 89.5) | 0.0025 |
| Midazolam per ventilator-day 0 - 48 h (mg/kg/day) | 4.50 (3.15 - 6.33) | 8.33 (4.80 - 12.00) | 5.50 (3.40 - 8.95) | 0.0025 |
Abbreviations: CIF, cumulative incidence function; IQR, interquartile range; NA, not applicable; PICU, pediatric intensive care unit.
a Values are expressed as No. (%) or median (IQR) unless otherwise indicated. Between-group comparisons used the Mann-Whitney U test for continuous variables and the chi-square test or Fisher exact test for categorical variables. Effect sizes with 95% CIs are reported in the Results.
bDexmedetomidine was administered only in the intervention arm; totals and P values are therefore not shown.
c “Rescue benzodiazepine” was prespecified as any lorazepam or diazepam given for breakthrough agitation or anxiety. “Adjunct medications” were ketamine, methadone, morphine, and cisatracurium used therapeutically during study days 1 - 7; doses given solely for intubation or procedural sedation were excluded.
d Rows labeled “0 - 48 h” report the 48-hour sensitivity analysis. Doses are the sum of study day 1 and day 2 values (fentanyl in µg/kg; midazolam in mg/kg). “Per ventilator-day” is the 0 - 48-hour dose divided by the number of days with invasive mechanical ventilation in that window (ventilation day 1 plus day 2; range, 0 - 2). If no ventilation occurred in the first 48 hours, per-ventilator-day values were not calculated. Missing day-level doses within the window were treated as zero, which may have underestimated exposure if undocumented administrations occurred. P values for these rows are 2-sided Mann-Whitney U values and are descriptive.
4.2. Seven-Day Cumulative Exposure
Table 2 presents unnormalized 7-day cumulative doses and maximum infusion rates to aid clinical interpretation. These descriptive results are directionally consistent with the primary outcome but are not used for confirmatory inference. Dexmedetomidine appears only in the intervention arm by design, and no between-group test is reported for this drug.
4.3. Secondary Outcome: Time to First Successful Extubation
In this high-mortality setting, unadjusted extubation medians were descriptive only. Median time to first successful extubation was 6 days (IQR, 3 - 10) in the dexmedetomidine group and 15 days (IQR, 10 - 15) in the control group. However, the prespecified competing-risk analysis did not support an extubation benefit, and the longitudinal ventilation analysis also did not support a ventilation benefit. Therefore, this finding should not be interpreted as evidence of earlier ventilator liberation.
4.4. Adjuncts and Rescue Medications
Adjunct therapy was common overall, with ketamine used most frequently (Table 2). Rescue benzodiazepines occurred more often in the intervention arm, driven by lorazepam use. Lorazepam was administered to 3/30 (10.0%) control patients and 9/30 (30.0%) dexmedetomidine patients, corresponding to an odds ratio of 3.86 (95% CI, 0.93 - 16.05). Diazepam and cisatracurium metrics were broadly comparable. All findings are exploratory and were not adjusted for multiplicity.
4.5. In-Hospital Events
Differences in mortality, unplanned extubation, and extubation failure were imprecise and should be interpreted descriptively (Table 2). In-hospital mortality occurred in 13/30 (43.3%) patients in the control group and 16/30 (53.3%) in the dexmedetomidine group (odds ratio, 1.49; 95% CI, 0.54 - 4.14). Point estimates and confidence intervals are provided in the table.
4.6. Sensitivity Analyses: 0 - 48 Hours From Randomization
Absolute exposure and exposure normalized per ventilator-day were higher in the intervention arm during the first 48 hours (Table 2). These findings are compatible with delayed or insufficient early sedative effects from the fixed low-dose, no-bolus dexmedetomidine regimen, rather than with an opioid- or benzodiazepine-sparing effect.
4.7. Longitudinal Trajectories During Days 1 - 7
Day-by-day hemodynamic variables (heart rate and blood pressure) and clinical trajectories (GCS, qSOFA, and need for ventilation) over study days 1 - 7 are summarized in Tables S2 and S3 in Supplementary File. Patterns over time were broadly consistent with clinical recovery in both groups, and the exploratory GEE models did not show any consistent or clinically important between-group divergence. In the fully adjusted GEE model (Model 2), the odds ratio for daily need for ventilation with dexmedetomidine versus control was 1.57. This exploratory estimate was imprecise, but its direction does not support a ventilation benefit and does not reinforce the unadjusted extubation summary. Full coefficient estimates are provided in Table S1 in Supplementary File, and the corresponding forest plot is shown in Figure S1 in Supplementary File.
5. Discussion
The main finding of this trial is that the tested regimen, fixed low-dose dexmedetomidine at 0.2 µg/kg/h without a loading dose, did not reduce fentanyl or midazolam exposure per ventilator-day, which was the prespecified primary endpoint. Fentanyl and midazolam exposure per ventilator-day was numerically higher in the dexmedetomidine group during study days 1 - 7, and the 0 - 48-hour sensitivity analyses also showed higher early exposure in the intervention arm. Therefore, this regimen did not demonstrate the expected opioid- or benzodiazepine-sparing effect in mechanically ventilated children.
Clinically, the intervention group did not show a sedative-sparing pattern. Both 7-day cumulative fentanyl and midazolam exposure and exposure per ventilator-day were numerically higher with dexmedetomidine, and 0 - 48-hour exposure was also higher. Therefore, the shorter unadjusted time to successful extubation should not be interpreted as evidence that dexmedetomidine achieved earlier ventilator liberation despite lower conventional sedative exposure. Because the extubation signal was exploratory and was not supported by the competing-risk or longitudinal ventilation analyses, the overall pattern is more consistent with insufficient early sedation with the fixed low-dose, no-bolus regimen, followed by escalation of conventional sedatives to reach the target RASS.
This early exposure pattern is clinically important. The most plausible interpretation is a delayed or insufficient early sedative effect with the fixed low-dose, no-bolus dexmedetomidine regimen, rather than a direct pharmacologic effect causing higher opioid or benzodiazepine use. A continuous infusion of 0.2 µg/kg/h without a loading dose is a conservative strategy and is at the low end of dosing strategies evaluated in pediatric dexmedetomidine studies (18-20). Because dexmedetomidine has clinically relevant pharmacokinetic and pharmacodynamic variability, some patients may have experienced an early period of inadequate α_2-mediated sedation (19). In practical terms, this pattern is compatible with an early “agitation gap,” in which the α_2-mediated sedative effect was insufficient to meet clinical sedation targets and clinicians therefore increased conventional sedatives. This explanation is consistent with the higher 0 - 48-hour exposure to fentanyl and midazolam and with the greater use of rescue lorazepam in the dexmedetomidine group.
Our findings should be interpreted in relation to the heterogeneous pediatric dexmedetomidine literature. Previous pediatric studies have reported variable effects on rescue sedative or analgesic requirements, likely because patient populations, comparators, dose ranges, titration strategies, and sedation targets differed across studies. Prasad et al. compared dexmedetomidine with fentanyl in postoperative pediatric cardiac surgical patients, whereas Tobias and Berkenbosch compared dexmedetomidine with midazolam during mechanical ventilation in infants and children (1, 13). Gulla et al. studied dexmedetomidine versus midazolam in mechanically ventilated children and did not establish noninferiority of dexmedetomidine for sedation (4). More recent pediatric syntheses similarly suggest that dexmedetomidine effects depend on clinical setting, dose, titration strategy, concomitant sedatives, and safety trade-offs (18, 21). Therefore, our findings should be viewed as evidence about one conservative regimen, fixed low-dose dexmedetomidine without a loading bolus, and should not be generalized to all dexmedetomidine strategies.
The extubation outcome should be interpreted cautiously. In unadjusted analyses, the median time to first successful extubation was shorter in the dexmedetomidine group than in the control group. However, this was a descriptive finding. Because mortality was high, death before extubation represents a competing event, making simple unadjusted medians potentially misleading (15-17).
The prespecified competing-risk analysis limited to study days 1 - 7 did not show a clear extubation benefit with dexmedetomidine. This cautious interpretation was consistent with the exploratory longitudinal GEE analysis, in which the adjusted odds ratio for daily need for mechanical ventilation was 1.57 for dexmedetomidine versus control. Although exploratory and imprecise, the GEE point estimate was directionally opposite to a ventilation benefit and therefore does not reinforce the unadjusted extubation summary. Therefore, the unadjusted extubation medians should not be considered confirmatory evidence that dexmedetomidine shortened mechanical ventilation.
The mismatch between the unadjusted extubation summary and the competing-risk and GEE analyses is clinically important. The time-to-extubation summary reflects a simple unadjusted time-to-event pattern, whereas the competing-risk analysis accounts for death before extubation, and the GEE model estimates the adjusted daily odds of remaining mechanically ventilated during study days 1 - 7. Because these analyses address related but different clinical questions, a conservative interpretation is needed. Overall, the available data do not confirm a ventilation benefit with this dexmedetomidine regimen.
Safety should also be interpreted conservatively. Dexmedetomidine may cause dose-related bradycardia and hypotension, especially with higher infusion rates or bolus dosing (19, 21). In this trial, no clear excess of clinically evident bradycardia or hypotension was observed, and longitudinal hemodynamic trends showed no consistent clinically important difference between groups. However, this does not prove hemodynamic safety, because adverse hemodynamic events were not systematically collected or adjudicated, and the trial was not powered for safety outcomes. In-hospital mortality and rescue lorazepam use were numerically higher with dexmedetomidine. These findings are imprecise and should not be overinterpreted, but they preclude any definitive safety claim.
A baseline respiratory case-mix imbalance may have influenced the findings. Respiratory diagnoses were more common in the dexmedetomidine group than in the control group. Although this difference was not statistically significant, its magnitude may be clinically relevant in a small randomized trial. Greater respiratory illness burden could increase early sedation needs, affect ventilator synchrony, delay extubation readiness, and influence both sedative exposure and ventilation outcomes. Therefore, the exposure and extubation findings should be interpreted in light of this plausible baseline imbalance.
Adjunct and rescue-medication findings also support a cautious interpretation. Lorazepam was used more often in the dexmedetomidine group, but lorazepam exposure was recorded separately and was not included in the prespecified cumulative midazolam outcome. Likewise, methadone and morphine were recorded separately and were not included in cumulative fentanyl exposure. Therefore, the primary outcome should be interpreted as fentanyl and midazolam exposure only, not as total benzodiazepine-class or opioid-class burden. This distinction is important because adjunct and rescue medications may have affected sedation depth and ventilator management. Ketamine was also common in both groups. Pediatric ketamine evidence is context-specific, and oncology pain data cannot be directly extrapolated to mechanically ventilated PICU sedation (22).
Taken together, the findings suggest that fixed low-dose dexmedetomidine at 0.2 µg/kg/h without a loading dose may be insufficient to reduce early co-sedative exposure in some mechanically ventilated pediatric intensive care unit patients. This regimen may have favored hemodynamic caution, but possibly at the cost of early sedative efficacy. Clinically, these results challenge the assumption that adding dexmedetomidine necessarily reduces opioid or benzodiazepine exposure. Instead, sedative-sparing effects may depend on dose, titration, timing of initiation, loading-dose use, sedation targets, and rescue-medication protocols (9, 18-21).
In summary, this early-phase, process-focused randomized trial did not show that adjunct fixed low-dose dexmedetomidine without a loading dose reduced fentanyl or midazolam exposure per ventilator-day. Early sedative-analgesic exposure was higher with dexmedetomidine, and the apparent earlier-extubation signal was descriptive, exploratory, and not confirmed by competing-risk analysis. Future multicenter, protocolized trials should use standardized sedation targets, predefined rescue-medication pathways, hour-level medication and ventilation data, and systematic adverse-event capture to determine whether other dexmedetomidine dosing strategies can reduce conventional sedative exposure without increasing cardiovascular or clinical risk.
5.1. Limitations
Several limitations render these findings hypothesis-generating. Exposures and ventilation were abstracted by calendar day; partial ventilation days counted as full ventilator-days, and daily maximum infusion rates were used, risking misclassification. The 0 - 48-hour analysis summed days 1 and 2 rather than elapsed time; it was exploratory and not power-based, with descriptive P values and no multiplicity control. Missing day-level doses were treated as zero based on medication administration records; however, undocumented administrations cannot be excluded, so sedative exposure may have been underestimated. For this reason, post hoc multiple imputation was not performed. Per-ventilator-day normalization reduces bias, but the denominator is coarse; ventilator-hours would be preferable. Rescue medication use and RASS targets were not fully protocolized, allowing confounding with respect to lorazepam use and extubation timing. In addition, respiratory diagnoses were more frequent in the dexmedetomidine group, which may have influenced sedation requirements, ventilator synchrony, extubation readiness, and ventilation-related outcomes. GEE analyses were exploratory; results are in Table S1 in Supplementary File. Extubation and death timestamps beyond day 7 were unavailable, so VFD-28 could not be calculated, and extubation time-to-event analyses were limited to days 1 - 7 and treated as exploratory. The single-center design and low-dose, no-bolus dexmedetomidine regimen limit generalizability and dose-response inference. These limitations should be considered when interpreting the exposure, extubation, and safety findings, and they support future multicenter, protocolized trials with hour-level exposure data and systematic adverse-event capture.