
1. Background
Osteoporosis is one of the most common metabolic bone diseases, which can cause significant physical, psychological, and economic problems, such as pain, disability, and reduced quality of life. However, it often goes undetected and untreated until a bone fracture occurs (1, 2). Important factors in the pathogenesis of osteoporosis include inadequate bone strength during growth and development, significant loss of bone density without adequate replacement, and microstructural weakness in the bone tissue. Early detection and treatment of bone density loss can lead to a favorable prognosis (3).
The bone density is responsible for 50 - 80% of bone strength. The measurement of bone density is based on bone mineral density (BMD), which is determined to diagnose osteoporosis (4, 5). Dual-energy X-ray absorptiometry (DXA), a standard method for confirming bone loss and diagnosing osteoporosis, shows BMD as an absolute number in grams per cubic centimeter (g/cm3) (6). The trabecular bone score (TBS) is another analytical parameter measured by DXA, which is used to diagnose osteoporosis. The T-score represents the bone density relative to the baseline level. Mainly, DXA is applied to the bones of the pelvis and waist (7, 8). Despite the precision of densitometry, DXA cannot accurately determine the effects of osteoporosis on bone strength (9) and may produce inconsistent TBS results in different areas, such as the spine, hip, and proximal femur (10).
The T-score inconsistency between different bone areas may be attributed to the following factors: (1) weight bearing in the hip and femoral regions, which increases the bone density as opposed to the spine; (2) faster rate of bone loss in the trabecular bone (lumbar) relative to the cortical bone (proximal femur); (3) pathological conditions with positive and negative effects on the T-score, such as the presence of vertebral osteophytosis and sclerosis, osteochondrosis, and aortic calcification and nephrolithiasis; and (4) artifactual or technical factors in DXA (10).
It is a major challenge to find an accessible and non-invasive technology for an accurate estimation of fracture risk beyond what is determined by combining standard BMD-DXA measurements. Nevertheless, TBS, as a texture measurement, can be an effective tool. It has been shown that TBS derived from the lumbar spine DXA image is associated with fracture risk, which is partially independent of clinical risk factors and BMD on DXA images (11, 12).
2. Objectives
The present study aimed to determine the diagnostic value of TBS in differentiating osteoporosis from osteopenia or normal BMD.
3. Patients and Methods
In this cross-sectional study, a total of 254 patients referred to the rheumatology clinic of Resalat Hospital in Tehran, Iran, were investigated for osteoporosis in 2019. This study was approved by the ethics committee of Shahid Beheshti University of Medical Sciences (ethics code: IR.SBMU.RETECH.REC.1398.329).
The sample size was estimated at 80% power, considering a prevalence rate of 20% and a significance level of < 0.05 by determining the minimum sample size for sensitivity and specificity (13). The minimum sample size was considered to be 244 patients. Finally, a total of 254 patients were recruited in the study using the convenience sampling method. Regarding the inclusion criteria, patients of different age and sex groups undergoing bone quality assessments (BMD and TBS) were included in the study. On the other hand, the exclusion criteria were as follows: A history of osteoporosis drug consumption in the last year; malabsorption syndrome; liver or renal failure; and any chronic disorders due to abnormal mineral metabolism.
The BMD and TBS were measured in all the patients. The BMD of the femoral neck and lumbar spine (L1-L4) was extracted from DXA images, based on the T-score in mg/cm2 and divided into three groups: T-score > -1, normal bone density; -1 ≥ T-score ≥ -2.5, osteopenia; and T-score < -2.5, osteoporosis (14). Trabecular bone score, as a new tissue index, was developed to determine the bone microarchitecture based on the analysis of lumbar spine DXA images. It was calculated based on variations in the gray-level texture between pixels, using iNsight™ version 3.0 (15). Overall, a TBS > 1.350 is normal, 1.200 ≤ TBS ≤ 1.350 represents a partially degraded bone, and TBS < 1.200 represents a degraded bone (14, 16). Age was also classified into two groups of < 65 years and ≥ 65 years.
3.1. Statistical Analysis
Descriptive statistics, including mean ± standard deviation (SD) and number (frequency percentage), were measured for quantitative and qualitative variables, respectively. Qualitative variables were analyzed using the chi-square test. According to the fulfilled assumptions of one-way analysis of variance (ANOVA), this test was applied to compare the mean values of continuous variables in more than two groups. Also, to determine the diagnostic accuracy of TBS (sensitivity, specificity, positive predictive value, and negative predictive value), the findings of TBS and BMD were considered as dichotomous variables (normal vs. osteopenia, normal vs. osteoporosis, and osteopenia vs. osteoporosis). These indices were calculated for each age group. The area under the receiver operating characteristic (ROC) curve (AUC) was measured based on TBS. The results of the ROC curve analysis were categorized as follows: AUC < 0.70, low accuracy; AUC = 0.70 - 0.90, moderate accuracy; and AUC ≥ 0.90, high accuracy (17). The kappa statistic was also measured to assess agreement between the findings of TBS and BMD. All analyses were performed using MedCalc for Windows version 18.11.3.8 (MedCalc Software, Ostend, Belgium) and IBM SPSS version 18 (SPSS Inc. Released 2009. PASW Statistics for Windows, Version 18.0. Chicago: SPSS Inc.). The significance level was considered to be less than 0.05.
4. Results
The demographic characteristics of 254 patients are presented in Table 1. The number of female patients was higher than that of males (88.2% vs. 11.8%; P < 0.001). The mean age of the patients was 58.87 ± 14.12 years, and the majority of them were younger than 65 years (n = 160, 63.0%). Regarding the BMD criteria, 99 (39.0%) patients were normal, while 107 (42.1%) and 48 (18.9%) patients showed osteopenia and osteoporosis, respectively. The findings of TBS indicated 85 (33.5%) normal, 128 (50.4%) partially degraded, and 41 (16.1%) degraded microarchitectures. Based on the results, there was a significant difference in the frequency percentage of BMD and TBS findings between the two age groups (< 65 and ≥ 65 years). The most frequent results of BMD and TBS in young patients (age < 65 years) were normal (45.6%) and partially degraded (48.1%) microarchitectures, respectively. Meanwhile, the majority of elderly patients had osteopenia based on BMD (40.4%) and partially degraded bones, according to TBS (54.3%) (Table 2).
Table 1.
The Baseline Characteristics of the Patients a
| Variables | Total (n = 254) |
|---|---|
| Age (y) | 58.87 ± 14.12 |
| Age group (y) | |
| < 65 | 160 (63.0) |
| ≥ 65 | 94 (37.0) |
| Sex | |
| Male | 30 (11.8) |
| Female | 224 (88.2) |
| Weight (kg) | 68.64 ± 11.80 |
| Height (cm) | 157.98 ± 7.62 |
| BMI (kg/m2) | 27.55 ± 4.72 |
| BMD (g/cm2) | -1.62 ± 1.25 |
| TBS | 1.31 ± 0.11 |
Abbreviations: BMI, body mass index; BMD, bone mineral density; TBS, trabecular bone score; SD, standard deviation.
a Values are expressed as mean ± SD or No. (%).
Table 2.
| Total | Age group (y) | Sex | BMI | |||
|---|---|---|---|---|---|---|
| < 65 | ≥ 65 | Male | Female | |||
| BMD status | ||||||
| Normal | 99 (39.0) | 73 (45.6) | 26 (27.7) | 13 (43.3) | 86 (38.4) | 28.81 ± 4.84 |
| Osteopenia | 107 (42.1) | 69 (43.1) | 38 (40.4) | 12 (40.0) | 95 (42.4) | 27.34 ± 4.65 |
| Osteoporosis | 48 (18.9) | 18 (11.3) | 30 (31.9) | 5 (16.7) | 43 (19.2) | 25.43 ± 3.74 |
| P-value | < 0.001 | 0.864 | < 0.001 | |||
| TBS status | ||||||
| Normal | 85 (33.5) | 74 (46.3) | 11 (11.7) | 15 (50.0) | 70 (31.3) | 26.85 ± 4.53 |
| Partially degraded | 128 (50.4) | 77 (48.1) | 51 (54.3) | 11 (36.7) | 117 (52.2) | 27.62 ± 4.50 |
| Degraded | 41 (16.1) | 9 (5.6) | 32 (34 .0) | 4 (13.3) | 37 (16.5) | 28.79 ± 5.52 |
| P-value | < 0.001 | 0.09 | 0.09 | |||
Abbreviations: BMI, body mass index; TBS, trabecular bone score; BMD, bone mineral density.
a Values are expressed as mean ± SD or No. (%).
b One-way ANOVA was used for quantitative variables, and the chi-square test was used for qualitative variables.
c The significance level was considered to be less than 0.05.
According to the TBS measurements, degraded or partially degraded microarchitectures were found in 50.0% of osteoporotic patients. In the osteopenia group, 11 (10.3%), 68 (63.5%), and 28 (26.2%) patients showed degraded, partially degraded, and normal TBS, respectively. Out of 99 patients with a normal BMD, only 57 (57.5%) had a normal TBS, while 6 (6.1%) had a degraded TBS (Table 3).
Table 3.
The Results of Trabecular Bone Score According to the Bone Mineral Density Status of the Patients a
| BMD status | TBS status | Total | Kappa coefficient | ||
|---|---|---|---|---|---|
| Normal | Partially degraded | Degraded | |||
| Normal | 57 (57.5) | 36 (36.4) | 6 (6.1) | 99 (100) | 0.34 |
| Osteopenia | 28 (26.2) | 68 (63.5) | 11 (10.3) | 107 (100) | |
| Osteoporosis | 0 (0.0) | 24 (50.0) | 24 (50.0) | 48 (100) | |
Abbreviations: BMD, bone mineral density; TBS, trabecular bone score.
a Values are expressed as No. (%).
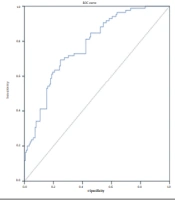
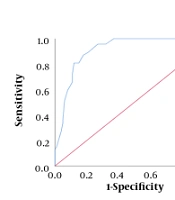
The agreement between TBS and BMD measurements was significantly fair (kappa = 0.34, P < 0.001) (18). The sensitivity, specificity, and positive and negative predictive values of TBS are presented in Table 4. The sensitivity and specificity of detecting osteopenia compared to a normal status were 70.83% and 61.2%, respectively. According to Figure 1A, the AUC was moderate in all the patients. It was also found to be low (AUC = 0.660) and moderate (AUC = 0.760) in patients aged ≥ 65 and < 65 years, respectively, with no significant difference (P > 0.05).
Table 4.
The Diagnostic Values of Trabecular Bone Score Based on the Bone Mineral Density Findings
| Validity of TBS | 95% CI | |||
|---|---|---|---|---|
| Sensitivity | Specificity | Positive predictive value | Negative predictive value | |
| Osteoporosis vs. osteopenia (y) | ||||
| Total | 50.00 (35.22 - 64.77) | 86.07 (76.45 - 92.83) | 68.75 (54.07 - 80.17) | 73.91 (67.80 - 79.21) |
| < 65 | 27.78 (9.69 - 53.48) | 93.33 (81.73 - 98.60) | 62.50 (30.74 - 86.22) | 76.36 (70.59 - 81.30) |
| ≥ 65 | 63.33 (43.86 - 80.07) | 76.47 (85.82 - 89.25) | 70.37 (55.00 - 82.19) | 70.27 (58.76 - 79.67) |
| Osteopenia vs. normal (y) | ||||
| Total | 70.83 (60.67 - 79.66) | 61.29 (50.62 - 71.22) | 65.83 (58.66 - 71.54) | 67.05 (58.89 - 74.30) |
| < 65 | 63.63 (50.87 - 75.13) | 69.44 (57.46 - 79.76) | 65.62 (56.30 - 73.88) | 67.56 (59.38 - 74.80) |
| ≥ 65 | 86.66 (69.27 - 96.24) | 33.33 (14.58 - 56.96) | 65.00 (57.09 - 72.16) | 63.63 (36.93 - 83.94) |
| Osteoporosis vs. normal (y) | ||||
| Total | 100.00 (85.73 - 100.00) | 90.47 (80.41 - 96.42) | 80.00 (65.14 - 89.54) | 100.00 (56.02 - 76.87) |
| < 65 | 100.00 (47.81 - 100.00) | 98.03 (89.55 - 99.95) | 83.33 (41.79 - 97.20) | 100.00 |
| ≥ 65 | 100.00 (82.35 - 100.00) | 58.33 (27.66 - 84.83) | 79.16 (66.05 - 88.12) | 100.00 |
Abbreviations: TBS, trabecular bone score; CI, confidence interval.

Figure 1.
The receiver operating characteristic (ROC) curve analysis of trabecular bone score (TBS) for discrimination of osteoporosis, osteopenia, and normal status: A, Osteopenia vs. normal; B, Osteoporosis vs. normal; and C, Osteoporosis vs. osteopenia.
The TBS measurements demonstrated a sensitivity of 100% and a specificity of 90.47% in identifying osteoporosis compared to a normal status. The ROC curve analysis (Figure 1B) confirmed the high efficacy of TBS (AUC = 0.911) and was acceptable for discrimination. There were no significant differences in the curves of the age groups (P > 0.05). Moreover, in the diagnosis of osteoporosis versus osteopenia, the sensitivity and specificity of TBS were estimated at 50.0% of 86.07%, respectively, and the AUC was found to be moderate (AUC = 0.762) and statistically significant (P < 0.001). However, there was no significant difference in the AUCs of different age groups (Figure 1C). The sensitivity of TBS for distinguishing osteoporosis versus osteopenia and osteopenia versus a normal status was higher in patients ≥ 65 years compared to those < 65 years (63.33% vs. 27.78% and 86.66% vs. 63.63%, respectively) (Table 4). According to the ROC curve analysis, the differences were not statistically significant (Figure 1).
5. Discussion
Osteoporosis is the most common metabolic bone disease, which can induce bone fractures due to decreased bone mass and altered bone structure. The improvement of diagnostic methods over the past decade has facilitated diagnosis before fracture. Dual-energy X-ray absorptiometry is the most common and reliable method for measuring BMD in the lumbar spine and hip and diagnosing osteoporosis (19, 20). Nonetheless, there are major variations in BMD measurements, and they are often compared to data from a young, healthy population to determine the T-score (10). Sometimes, T-score inconsistencies are found between the lumbar spine and hip, which may not be suitable for decision-making in osteoporosis diagnosis and treatment; therefore, TBS may be used as a new method along with BMD.
In the present study, the following points were considered for detecting osteoporosis based on TBS. The best diagnostic accuracy of TBS was found when differentiating osteoporosis from normal BMD, while its accuracy was moderate for differentiating osteopenia from a normal status and low for differentiating osteoporosis from osteopenia. In elderly patients, the sensitivity of TBS was higher for differentiating osteoporosis from a normal BMD and also for differentiating osteopenia from a normal BMD; however, the ROC curve analysis did not indicate this finding. Overall, there was no strong evidence for differentiating osteoporosis from osteopenia. The sensitivity of TBS was 50% for differentiating osteoporosis from osteopenia, which can be justified by the low agreement between BMD and TBS measurements; besides, only half of our osteoporotic patients showed degraded TBS. In this regard, Mirzaei et al. (14) reported a 50% detection rate for TBS in identifying a bone density that required a treatment intervention.
The BMD (T-score) is an essential measure for estimating the 10-year fracture probability. Kang and colleagues showed that TBS is more accurate than BMD in detecting vertebral fractures of osteoporosis (21). In the present study, TBS was found to be a suitable index for differentiating osteoporosis or osteopenia from normal status. However, its diagnostic accuracy was insufficient to accurately estimate the extent of bone density loss (osteopenia vs. osteoporosis). Overall, the findings suggest that TBS cannot replace BMD.
Some studies have investigated TBS and BMD independently to predict the risk of fractures. However, there is no agreement regarding the advantages of TBS in predicting fracture risk (14, 22, 23). In this regard, McCloskey et al. showed that TBS could be a predictive factor for fracture risk in elderly patients (24). Several studies have also evaluated and compared the diagnostic value of BMD and TBS in vertebral fractures and emphasized that TBS can be a complementary test to BMD for detecting osteoporotic fractures (25-28). Meanwhile, TBS can be helpful in the evaluation of bone density in elderly patients due to the presence of osteophytes associated with advancing age. In the present study, a high percentage of our patients had a normal bone mineral content or osteopenia according to BMD measurements; they were in an old age range and probably required therapeutic interventions.
The limitations of the present study include a lack of research on the diagnostic accuracy of TBS for making comparisons, as well as a lack of access to the follow-up of patients with contrary TBS and BMD results.
According to the results of the present study on the validity of TBS for osteoporosis diagnosis, TBS alone is insufficient as an alternative in detecting osteoporosis and cannot replace BMD. Therefore, using a combination of BMD and TBS techniques can be the best approach for diagnosing osteoporosis, especially in patients aged 65 years or above.