


1. Background
2. Objectives
3. Patients and Methods
3.1. Patients
3.2. Computed Tomography Examination
3.3. Analysis of the Computed Tomography Features
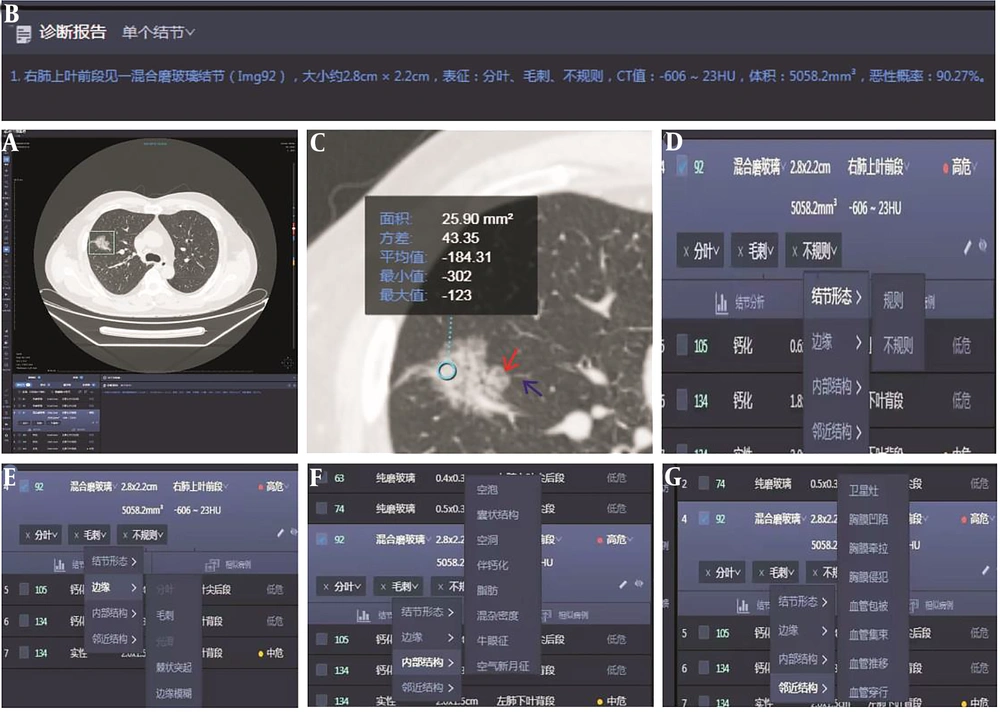
Artificial intelligence automatically screens pulmonary ground-glass nodules (GGNs). A and B, A 56-year-old man with a mixed GGN of the anterior segment of the right upper lobe of the lung, with a size of about 2.8 × 2.2 cm, a CT value of 606 23 HU, a volume of 5058.2 mm3, and a malignant probability of 90.27%. C, The region of interest extraction (indicated by blue circle), lobation (indicated by red arrow), and spiculation (indicated by blue arrow). Artificial intelligence automatically extracts features such as D, morphology; E, margin; F, internal structures; and G, surrounding structures.
3.4. Pathological Data
3.5. Statistical Analysis
4. Results
4.1. Patient Clinical Features and CT Features of Benign and Malignant GGNs
| Variables | Group A | Group B | OR (95%CI) | 2/t | P | ||||||
|---|---|---|---|---|---|---|---|---|---|---|---|
| Toal | AAH (n=8) | AIS (n=14) | Other (n=47) | Toal | MIA (n=15) | IAC (n=112) | Other (n=8) | ||||
| Sex | 2.986 | >0.005 | |||||||||
| Male | 40 | 7 | 8 | 25 | 61 | 5 | 48 | 8 | |||
| Female | 29 | 1 | 6 | 22 | 74 | 10 | 64 | 0 | |||
| Age | 56.62 ± 12.29 | 59.50 ± 10.0 | 56.00 ± 6.92 | 56.32 ± 13.88 | 59.78 ± 10.74 | 54.6 ± 13.09 | 60.04 ± 10.21 | 66.00 ± 10.09 | -1.892 | >0.05 | |
| Diameter (mm) | |||||||||||
| Long | 15.72 ± 9.09 | 10.44 ± 2.38 | 12.65 ± 5.66 | 17.55 ± 10.05 | 18.73 ± 7.91 | 11.18 ± 4.26 | 20.06 ± 7.33 | 14.20 ± 11.63 | -1.892 | 0.016 | |
| Short | 12.45 ± 7.91 | 7.76 ± 3.53 | 10.44 ± 6.30 | 13.84 ± 8.51 | 15.06 ± 7.14 | 8.99 ± 3.33 | 16.23 ± 6.76 | 10.01 ± 10.02 | -2.386 | 0.018 | |
| Volume (mm3) | 380.78 ± 805.39 | 400.27 ± 385.00 | 843.01 ± 589.53 | 3307.92 ± 5899.51 | 847.71 ± 929.79 | 4163.10 ± 7283.18 | -5.740 | <0.001 | |||
| Mean CT value (HU) | -615.54 ± 101.36 | -629.63 ± 113.22 | -607.50 ± 97.48 | -485.56 ± 173.67 | -547.93 ± 190.77 | -457.55 ± 186.69 | -4.648 | <0.001 | |||
| Vacuole sign | 7 (22.32) | 1 | 4 | 2 | 59 (43.68) | 7 | 52 | 0 | 0.441 (1.06-1.22) | 23.50 | <0.001 |
| Lobulated sign | 0.150 (0.06-0.34) | 0.750 | 0.387 | ||||||||
| Superficial a | 19 (32.13) | 3 | 8 | 8 | 76 (62.87) | 11 | 64 | 1 | |||
| Deep a | 3 (8.79) | 0 | 0 | 3 | 23 (22.68) | 1 | 20 | 2 | |||
| Air bronchogram sign | 7 (19.27) | 2 | 3 | 2 | 50 (37.72) | 2 | 45 | 3 | 0.211 (0.9-0.50) | 14.28 | <0.001 |
| Vascular convergence sign | 14 (30.78) | 1 | 7 | 6 | 77 (60.22) | 4 | 72 | 1 | 0.198 (0.10-0.39) | 24.01 | <0.001 |
| Vascular perforator sign | 18 (32.48) | 7 | 10 | 1 | 78 (63.53) | 7 | 70 | 1 | 0.264 (0.14-0.51) | 18.41 | <0.001 |
| Pleural indentation sign | 16 (29.76) | 2 | 3 | 11 | 72 (58.24) | 2 | 68 | 2 | 0.264 (0.14-0.51) | 16.916 | <0.001 |
| Interlobular septal obstruction sign a | 9 (16.57) | 1 | 7 | 1 | 40 (32.43) | 5 | 35 | 0 | 0.356 (0.16-0.79) | 6.883 | <0.01 |
| Tumor-lung interface a | 0.676 (0.26-1.77) | 0.642 | 0.423 | ||||||||
| Clear | 61 (62.57) | 6 | 10 | 45 | 124 (122.43) | 14 | 59 | 51 | |||
| Vague | 8 (6.43) | 1 | 4 | 3 | 11 (3.26) | 1 | 10 | 0 | |||
| Spiculated sign | 0.294 (0.07-4.37) | 24.529 | <0.001 | ||||||||
| Short and thin a | 17 (20.63) | 1 | 2 | 14 | 44 (40.36) | 5 | 36 | 3 | |||
| short and thick a | 5 (10.15) | 0 | 2 | 3 | 25 (19.85) | 2 | 22 | 1 | |||
| Tall and thin a | 9 (14.88) | 1 | 2 | 6 | 35 (29.12) | 0 | 35 | 0 | |||
| tall and thick a | 3 (3.04) | 0 | 0 | 3 | 6 (5.96) | 0 | 6 | 0 | |||
| Density | 1.081 (0.50-2.34) | 0.039 | 0.843 | ||||||||
| pGGN | 12 (11.5) | 6 | 6 | 0 | 22 (12.57) | 5 | 15 | 2 | |||
| mGGN | 57 (57.5) | 2 | 8 | 47 | 113 (112.5) | 10 | 97 | 6 | |||
Abbreviations: GGN, ground-glass nodul; Group A, Benign nodule; Group B, Malignant; AAH, atypical adenomatous hyperplasia; AIS, adenocarcinoma in situ; MIA, minimally invasive adenocarcinoma; IAC, invasive adenocarcinoma; pGGN, pure ground-glass nodule; mGGN, mixed ground-glass nodule; OR, odds ratio; HU, Hounsfield unit; CI, confidence interval.
a Using radiologists to obtain data.
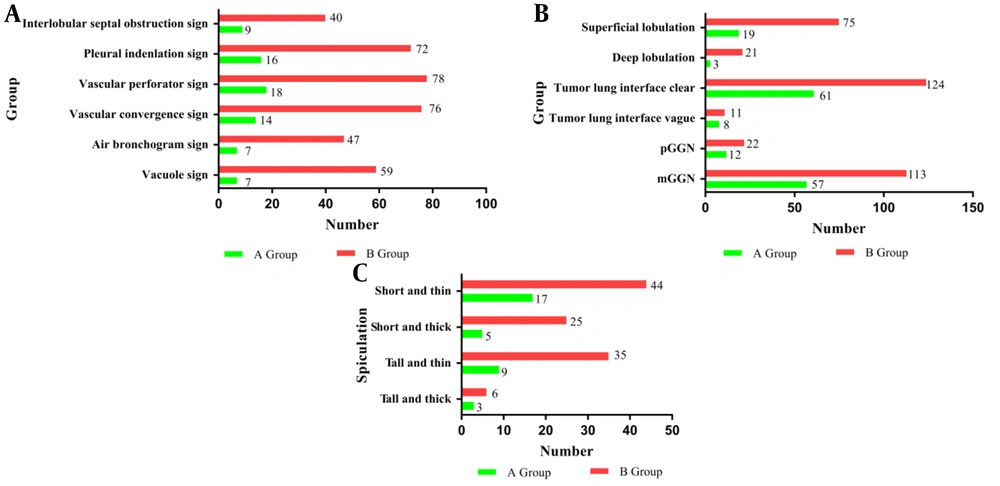
Different imaging findings among malignant (groups B) and benign ground-glass nodules (GGNs) (groups A): A, Vacuole sign, air bronchogram sign, vascular perforation sign, pleural indentation sign, vascular convergence sign, and interlobular septal obstruction sign CT features of GGNs in groups A and B. B, GGN margins (clear or blurry), degree of lobulation (deep or superficial), and GGN density (pure GGNs or mixed GGNs) in groups A and B. C, Spiculation (short and thick, short and thin, tall and thick, or tall and thin) of GGNs in groups A and B.
4.2. Comparison of the Size, Volume, CT Value, and Features of GGNs
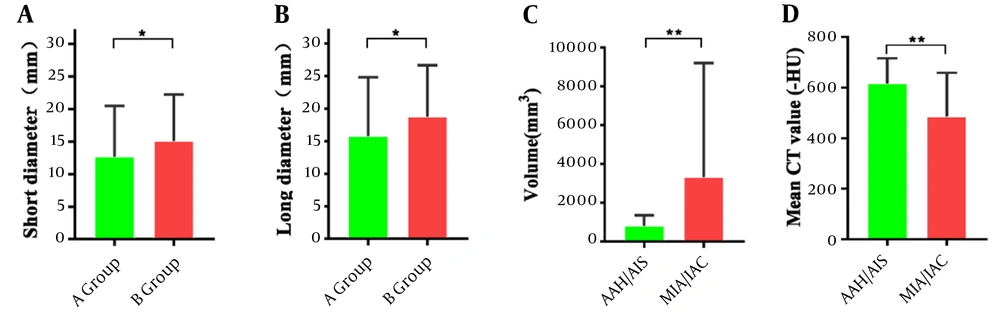
Comparison of imaging measurements between different groups: Short diameter and long diameter in malignant and benign groups (A and B). Volume and mean CT values in atypical adenomatous hyperplasia/adenocarcinoma in situ vs minimally invasive adenocarcinoma/invasive adenocarcinoma subgroups (C and D). * P < 0.05 and ** P< 0.01, significant differences between groups. Comparison of imaging measurements between different groups: Short diameter and long diameter in malignant and benign groups (A and B). Volume and mean CT values in AAH/AIS versus MIA/IAC sub AAH/AIS versus MIA/IAC sub--groups (C and D). * Groups (C and D). * PP < 0.05, and ** < 0.05, and ** PP < 0.01, significant < 0.01, significant differdifferences between groups.ences between groups.
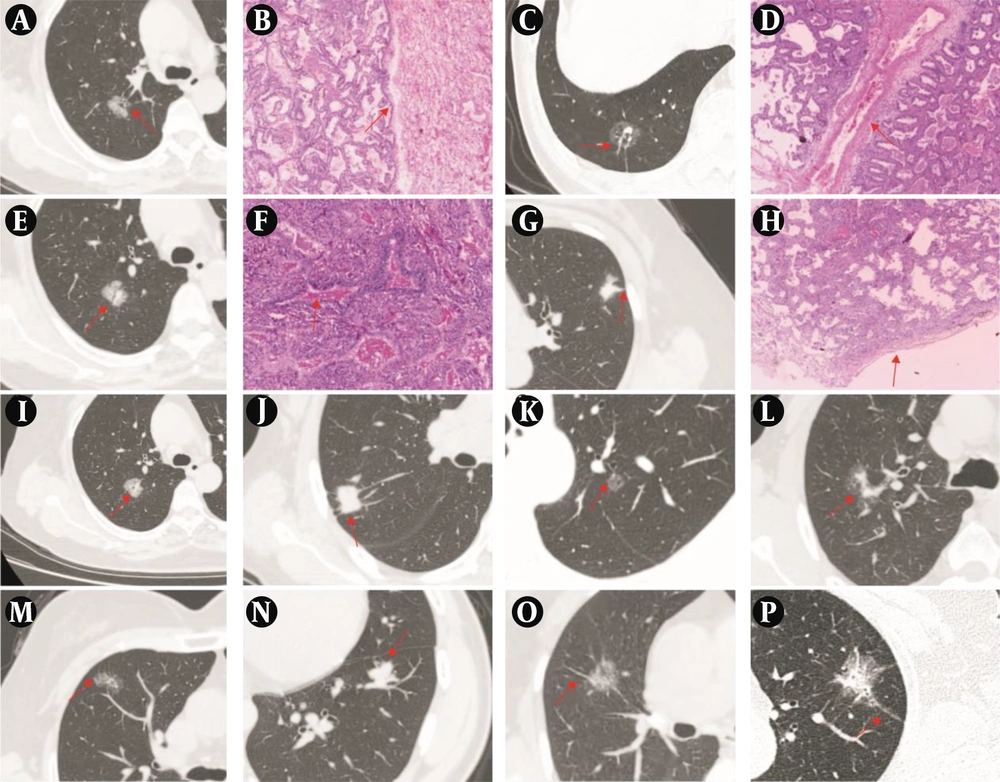
A, Representative CT image showing a mixed ground-glass nodule (mGGN) in the upper lobe of the right lung, with the red arrow indicating the sign of interlobular septal obstruction. B, Representative image of hematoxylin and eosin staining confirming invasive adenocarcinoma (IAC) pathologically (H&E, ×40). C, Representative CT image showing a pure ground-glass nodule (pGGN) in the lower lobe of the right lung, with the red arrow indicating the sign of vascular penetration. D, Representative image of hematoxylin and eosin staining confirming IAC pathologically (H&E, ×40). E, Representative CT image showing a mGGN in the upper lobe of the right lung, with the red arrow indicating the sign of air bronchogram. F, Representative image of hematoxylin and eosin staining confirming IAC pathologically (H&E, ×40). G, Representative CT image showing a mGGN in the upper lobe of the left lung, with the red arrow indicating the sign of pleural indentation. H, Representative image of hematoxylin and eosin staining confirming IAC pathologically (H&E, ×40). I - P, Representative CT images showing the sign of vacuole, the sign of vascular convergence, the sign of superficial lobulation, the sign of deep lobulation, the sign of short and thin spiculation, the sign of short and thick spiculation, the sign of tall and thin spiculation, the sign of tall and thick spiculation, with the red arrow indicating the sign in each panel.
4.3. Multivariate Logistic Regression Analysis
| Variables | B | Wald 2 | P-Value | Exp (B) | 95% CI for Exp (B) | |
|---|---|---|---|---|---|---|
| Lower | Upper | |||||
| X1 (long diameter) | 0.023 | 0.205 | 0.651 | 1.023 | 0.928 | 1.128 |
| X2 (short diameter) | 0.015 | 0.073 | 0.788 | 1.015 | 0.910 | 1.133 |
| X3 (vacuole sign) | 1.075 | 5.113 | 0.024 | 0.341 | 0.135 | 0.867 |
| X4 (air bronchogram sign) | 0.54 | 0.924 | 0.336 | 0.582 | 0.194 | 1.753 |
| X5 (vascular convergence sign) | 0.342 | 0.553 | 0.457 | 0.710 | 0.288 | 1.751 |
| X6 (vascular perforator sign) | 0.967 | 5.127 | 0.024 | 0.380 | 0.165 | 0.878 |
| X7 (pleural indentation sign) | 0.223 | 0.245 | 0.621 | 0.800 | 0.332 | 1.932 |
| X8 (interlobular septal obstruction sign) | 1.235 | 5.031 | 0.025 | 0.291 | 0.099 | 0.856 |
| Constant | 3.167 | 7.351 | 0.007 | 23.746 | ||
Abbreviation: CI, confidence interval.
| Variables | Cutoff Point | P-Value | Sensitivity | Specificity | PPV | NPV | AUC | 95% CI |
|---|---|---|---|---|---|---|---|---|
| The AI system model | 0.618 | 0.001 | 0.756 | 0.696 | 0.837 | 0.318 | 0.771 | 0.705-0.837 |
| The radiologists model | 0.695 | 0.001 | 0.726 | 0.783 | 0.881 | 0.667 | 0.804 | 0.743-0.866 |
| The combined model | 0.637 | 0.001 | 0.768 | 0.793 | 0.933 | 0.783 | 0.833 | 0.775-0.891 |
Abbreviations: PPV, positive predictive value; NPV, negative predictive value; AUC, area under the curve; CI, confidence interval.
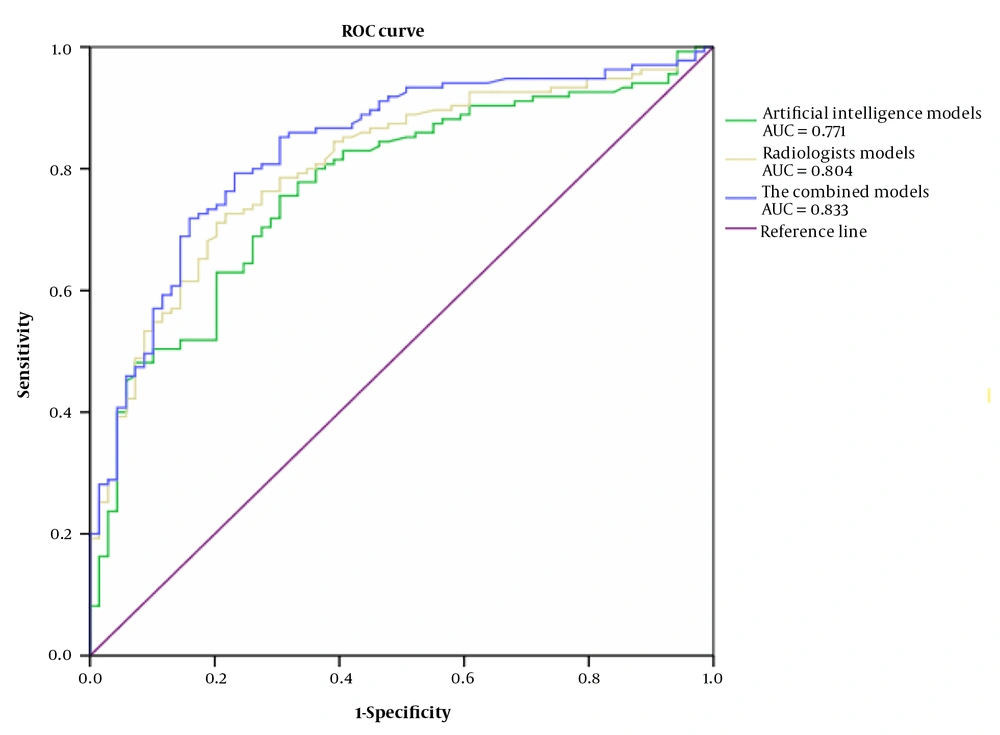
The receiver operating characteristic (ROC) curves of the logistic regression models (AUC, area under the curve)
4.4. Comparison of the Results of AI System and Radiologists’ Reports of Images
| Variables | AI System | Radiologist | Combine | Pathology | |||
|---|---|---|---|---|---|---|---|
| Malignant | Benign | Malignant | Benign | Malignant | Benign | ||
| Benign GGN | 47 | 22 | 23 | 46 | 15 | 54 | 69 |
| Malignant GGN | 113 | 22 | 119 | 16 | 126 | 9 | 135 |
Abbreviations: AI, artificial intelligence; GGN, ground-glass nodule.


