
1. Background
The coronavirus disease 2019 (COVID-19) is a complex viral condition that predominantly involves multiple organs, such as the respiratory and cardiovascular systems (1, 2). Although the majority of the patients experience a moderate form of the disease, small groups develop acute respiratory distress syndrome (ARDS) and multi-organ dysfunctions (3). According to recent studies, patients with underlying cardiovascular diseases (CVD) are more likely to develop complications and experience a more severe clinical course of the disease. Furthermore, numerous reports of cardiovascular complications among patients without a CVD history may contribute to poor disease outcomes (4, 5).
The main known mechanism for COVID-19 cardiovascular toxicity is the expression of angiotensin-converting enzyme-2 (ACE-2) in cardiomyocytes. When SARS-CoV-2 binds to its cellular target, ACE2 receptors, myocardial infection occurs. SARS-CoV-2 also may induce endothelial cell apoptosis, leading to microvascular dysfunction that is a predisposing factor for developing thromboembolic events. The following hypoxemic mechanisms will lead to further damage (6). Well-known COVID-19 cardiac manifestations can be named myocardial infarction, myocarditis, arrhythmias, cardiomyopathy, pulmonary embolism, and deep vein thrombosis (7-9).
The modality of choice for COVID-19 diagnosis is the real-time reverse transcription polymerase chain reaction (RT-PCR) test (10). Moreover, chest computed tomography (CCT) is an imaging method with high sensitivity that has been widely used in healthcare centers to stratify the severity of the disease and evaluate pulmonary and extrapulmonary complications (11). It has been demonstrated that some imaging-based parameters comprising cardiac indices can predict the severity of the disease and the risk of morbidity and mortality in different stages of the disease (10). An elevated cardiothoracic ratio (CTR) that indicates cardiomegaly (12), an increased pulmonary artery to the aorta (PA/A) ratio that can be a sign of pulmonary hypertension, inferior vena cava (IVC) dimension, and pericardial effusion all were compatible with poor prognosis in patients with COVID-19 (10, 13). These indices may also indicate an increased risk of CVD secondary to COVID-19 (14, 15).
2. Objectives
Investigating the CT-based pulmonary and extrapulmonary prognostic parameters, along with the clinical course of the disease, can help us to determine disease severity and stratify the risk of mortality and morbidity among COVID-19 patients and can play an important role in patient management, especially for early interventions. Therefore, this study aimed to investigate CT-based cardiac indices as prognostic factors in predicting outcomes among hospitalized patients with COVID-19.
3. Patients and Methods
3.1. Study Design
This descriptive-analytical study was conducted in Gorgan, northern Iran, from March 2020 up to June 2020. Participants included patients with a confirmed diagnosis of COVID-19 who were admitted to Shahid Sayad Shirazi Hospital. All the patients in the study were managed according to diagnostic and management guidelines of Iran's Ministry of Health and Medical Education (MoHME) that were released during the study period. The summary of management strategies was as follows. Patients with mild COVID-19 received supportive care and were managed in the outpatient setting. Patients with moderate to severe disease were admitted to the hospital and then received supportive care, oxygen therapy, corticosteroids (dexamethasone), anticoagulants (heparin and enoxaparin), and remdesivir if they had moderate to severe lung involvement. Then, patients were monitored for further therapeutic options such as intubation and intensive care unit admission.
The present study was approved by the Ethics Committee of Golestan University of Medical Sciences (ID: IR.GOUMS.REC.1400.214). Informed consent was obtained from all individuals who were enrolled in the study. All investigations were in accordance with the Declaration of Helsinki Declaration.
3.2. Inclusion and Exclusion Criteria
Inclusion criteria included (1) patients with confirmed COVID-19 diagnosis through positive RT-PCR test; and (2) age older than 18 years. Exclusion criteria were: (1) Positive history of pulmonary embolism; (2) history of oxygen-dependent chronic lung disease (COPD); (3) patients who were treated as outpatients and were not hospitalized; and (4) poor image quality of chest CT scan.
3.3. Chest CT Imaging
All clinically suspicious patients underwent chest CT upon admission according to the COVID-19 guidelines (16). The CT scan imaging was obtained in the supine position during end inspiration with a 16-slice scanner (Siemens Somatom emotion CT scanner, Germany). The scanning parameters were as follows: Gantry rotation time of 0.6 seconds, detector array: 16 × 1.2, pitch of 1.5, table speed of 150 mm/sec, and a 512 × 512 matrix. The tube voltage and tube current ranges were 130 kv and 20-345 mA, respectively. A 1.5 mm slice thickness and 1 mm reconstruction interval were used for sagittal and coronal image reconstruction.
Only the initial CT was evaluated in the case of multiple chest CTs. All imaging data were extracted from the picture archiving and communicating system (PACS) and evaluated by 2 experienced radiologists. The parameters were all examined through low-dose CT scans in axial, coronal, and sagittal planes, and the following data were extracted by the radiologist:
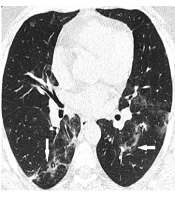
The pattern of lung involvement was classified as ground-glass opacification (GGO), consolidation, reticular or mixed. Pulmonary involvement was assessed by using the following system: (1) Upper zone: The area above the carina; (2) middle zone: The area between the carina and inferior pulmonary vein; and (3) lower zone: The region below the inferior pulmonary vein. The amount of pulmonary involvement was scored based on the following system: 0: No involvement, 1: Less than 25%, 2: Between 25 and 50%, 3: Between 51 and 75%, 4: More than 75%. Upper, middle, and lower zonal scores were calculated by combining the scores of both lungs (maximum score for each zone = 8) and were summed for all three zones to determine the lung total score (maximum score = 24) (3, 17, 18).
A CTR is calculated by dividing the greatest transverse cardiac diameter from outer to outer myocardium by the greatest transverse thoracic diameter from inner to inner chest wall on axial images. The ratio > 0.49 is considered to be an indicator of cardiac enlargement. Moreover, PA/A > 1 was defined as PA enlargement and was calculated based on the PA measured within the pulmonary bifurcation to the diameter of the ascending aorta (19).
The IVC diameter was also measured in both anteroposterior and transverse directions at the right diaphragmatic crus, and a diameter > 2 cm is considered significant (20).
To measure the pleural effusion in the CT scan, we divided the anteroposterior (AP) diameter of the chest into quartiles, and the maximum AP diameter was measured at the midclavicular line. Three categories are defined as follows: First AP-quartile effusions are small, second AP-quartile effusions are moderate, and third or fourth AP-quartile effusions are severe. Normal pericardium thickness measured on CT scan is considered to be 2 mm (30 - 50 cc). The effusion depth can estimate the volume of fluid in pericardial space. Therefore, pericardial effusion is reported as small: < 10 mm, moderate: 10 - 20 mm, and large: > 20 mm.
3.4. Statistical Analysis
Data analysis was performed by SPSS v. 20 (IBM Corp. Released 2011. IBM SPSS Statistics for Windows, Version 20.0. Armonk, NY: IBM Corp.) and the Statistical Package of GraphPad Prism v. 9.3.1.471.
For descriptive statistical analysis, frequencies, percentages, and mean ± standard deviation (SD) were used. The normal distribution of variables was evaluated by the Shapiro-Wilk test and Kolmogorov-Smirnov test. Age, sex, comorbidities, and other basic variables were adjusted between groups. For comparing groups, Mann-Whitney U, chi-square, and Fisher's exact tests were used. A Cox regression survival analysis was applied to evaluate the effect of cardiac indices on the length of hospitalization, and a logistic regression test was performed to investigate the mortality rate. Moreover, the correlation between lung involvement and cardiac indices was analyzed by linear regression models. P-value < 0.05 was considered statistically significant.
4. Results
4.1. Patient Demographic, Clinical, and Laboratory Findings
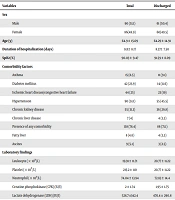
A total of 176 patients with COVID-19 were enrolled in the study; 90 patients were male (51.1%) and 86 were female (48.9%) (Table 1). During the follow-up, 121 patients were finally discharged, and 55 patients were deceased. The mean age of participants was 64.9 ± 5.09 years, and the distribution of age (P = 0.31) and sex (P = 0.87) was equal between the 2 groups. There was no significant difference in the duration of hospitalization between discharged and deceased (P = 0.36). Oxygen saturation (SpO2) level at admission was lower among deaths than discharged patients (86.62 ± 11.3 vs. 9.59 ± 8.09), which was statistically significant (P < 0.0001). Among comorbidity factors, the history of diabetes mellitus (P = 0.0001), ischemic heart disease, chronic heart failure (P = 0.0086), and hypertension (0.034) were significantly more frequent among the deceased. The presence of any comorbidity was also shown to be higher among deceased patients (94.5%) as compared to discharged (71.1%), and this difference was statistically significant (P = 0.0003). The laboratory data findings are also summarized in Table 1.
Table 1.
Demographic, Clinical, and Laboratory Data Characteristics for Coronavirus Disease 2019 Patients
| Variables | Total | Discharged | Deceased | P-Value |
|---|---|---|---|---|
| Sex | 0.87 | |||
| Male | 90 (51.1) | 61 (50.4) | 29 (52.7) | |
| Female | 86(48.9) | 60(49.5) | 26(47.2) | |
| Age (y) | 64.9 ± 15.09 | 64.29 ± 14.91 | 66.25 ± 15.53 | 0.31 |
| Duration of hospitalization (days) | 9.11± 8.17 | 8.37± 7.50 | 10.71 ± 9.35 | 0.36 |
| SpO2 (%) | 90.03 ± 9.47 | 91.59 ± 8.09 | 86.62 ± 11.3 | < 0.0001 |
| Comorbidity factors | ||||
| Asthma | 15 (8.5) | 11 (9.1) | 4 (7.3) | 0.77 |
| Diabetes mellitus | 42 (23.9) | 14 (11.6) | 28 (50.9) | < 0.0001 |
| Ischemic heart disease/congestive heart failure | 44 (25) | 23 (19) | 21 (38.2) | 0.0086 |
| Hypertension | 90 (51.1) | 55 (45.5) | 35 (63.6) | 0.034 |
| Chronic kidney disease | 55 (31.3) | 36 (29.8) | 19 (34.5) | 0.59 |
| Chronic liver disease | 7 (4) | 4 (3.3) | 3 (5.5) | 0.68 |
| Presence of any comorbidity | 138 (78.4) | 86 (71.1) | 52 (94.5) | 0.0003 |
| Fatty liver | 8 (4.6) | 4 (3.3) | 4 (7.3) | 0.26 |
| Ascites | 9 (5.1) | 3 (2.5) | 6 (10.9) | 0.027 |
| Laboratory findings | ||||
| Leukocyte (× 109/L) | 19.91 ± 11.71 | 20.77 ± 11.22 | 18.2 ± 12.63 | 0.035 |
| Platelet (× 109/L) | 215.2 ± 110 | 20.77 ± 11.22 | 210.5 ± 130.3 | 0.22 |
| Neutrophil (× 109/L) | 74.04 ± 13.94 | 72.83 ± 14.4 | 76.79 ± 12.57 | 0.08 |
| CPK (IU/I) | 2 ± 1.74 | 1.95 ± 1.75 | 2.09 ±1.74 | 0.21 |
| LDH (IU/I) | 528.7 ±342.4 | 470.4 ± 290.8 | 655.9 ± 409 | 0.0003 |
| CRP (mg/L) | 0.41 | |||
| Negative | 34 (19.3) | 27 (22.3) | 7 (12.7) | |
| +1 | 43 (24.4) | 31 (25.6) | 12 (21.8) | |
| +2 | 36 (20.5) | 24 (19.8) | 12 (21.8) | |
| +3 | 40 (22.7) | 26 (21.5) | 14 (25.5) | |
| +4 | 23 (13.1) | 13 (10.7) | 10 (18.2) |
Abbreviations: SpO2, oxygen saturation; CPK, creatine phosphokinase; LDH, lactate dehydrogenase; CRP, C-reactive protein.
4.2. Association Between Pulmonary and Cardiovascular CCT Parameters and Patient Outcome
Total lung involvement, same as the upper, middle, and lower zones, was significantly more prevalent in deceased patients (P ≤ 0.0001). The main lung involvement pattern was GGO among all patients (50%), but this was not significantly more frequent in deaths (P = 0.10). Consolidation was the second main involvement pattern, which was highly significant in the deceased group in comparison with the discharged (P = 0.0032). Bilateral involvement also was found to be more common in COVID-19 patients who died (P = 0.0005). Other pulmonary findings that were statistically significant were air bronchogram (P = 0.0099) and dilated vessels, which were only found in the deceased group (P = 0.03). Moderate and severe pleural effusion varied with 1.7% and 0.8% in recovered patients and 9.1% and 7.3% in patients who died, respectively, which was highly significant (P = 0.0086). However, pericardial effusion showed no significant difference between the recovered and the dead (P = 0.41). Increased CTR was found in 31.4% of discharged and 50.9% of deceased patients, which was considerable (P = 0.018). The PA/A > 1 varied by 32.2% in patients who recovered and 52.7% among the deceased, which was statistically significant (P = 0.012). The diameter of the trachea was noticeably higher in the deceased group in comparison with the discharged (P = 0.0042), but we did not find a significant difference in IVC diameter between the two groups (P = 0.07) (Table 2).
Table 2.
Radiologic Findings of Pulmonary and Cardiovascular Parameters in Chest-Computed Tomography Imaging a
| Variables | Total | Discharged | Deceased | P-Value |
|---|---|---|---|---|
| Lung involvement | ||||
| Total | 10.44 ± 6.01 | 4.26 ± 4.07 | 6.19 ± 5.54 | < 0.0001 |
| Upper zone | 1.12 ± 1.95 | 0.21 ± 0.81 | 0.5 ± 1.34 | 0.0001 |
| Middle zone | 3.38 ± 3.12 | 1.30 ± 1.99 | 1.95 ± 2.58 | < 0.0001 |
| Lower zone | 5.92 ± 3.10 | 2.74 ± 2.66 | 3.74 ± 3.16 | < 0.0001 |
| Pattern of involvement | ||||
| Ground-glass opacity | 88 (50) | 55(45.5) | 33(60) | 0.10 |
| Consolidation | 82 (46.6) | 47 (38.8) | 35 (63.6) | 0.0032 |
| Reticular | 3 (1.7) | 2 (1.7) | 1 (1.8) | < 0.99 |
| Mixed | 3 (1.7) | 2 (1.7) | 1 (1.8) | < 0.99 |
| Lesion distribution | ||||
| Unilateral | 10 (5.7) | 8 (6.6) | 2 (3.6) | 0.72 |
| Bilateral | 103 (58.5) | 60 (49.6) | 43 (78.2) | 0.0005 |
| Peripheral | 65 (36.9) | 43 (35.5) | 22 (40) | 0.61 |
| Central | 34 (19.3) | 23 (19) | 11 (20) | < 0.99 |
| Both | 16 (9.1) | 8 (6.6) | 8 (14.5) | 0.9 |
| Posterior | 24 (13.6) | 15 (12.4) | 9 (16.4) | 0.48 |
| Anterior | 7 (4) | 3 (2.5) | 4 (7.3) | 0.20 |
| Lateral | 9 (5.1) | 6 (5) | 3 (5.5) | < 0.99 |
| Nonspecific | 84 (47.7) | 48 (39.7) | 36 (65.5) | 0.0019 |
| Other findings | ||||
| Airway thickening | 67 (38.1) | 39 (32.2) | 28 (50.9) | 0.02 |
| Crazy paving | 3 (1.7) | 1 (0.8) | 2 (3.6) | 0.23 |
| Lymphadenopathy | 72 (40.9) | 42 (34.7) | 30 (54.5) | 0.02 |
| Dilated vessel | 3 (1.7) | 0 (0) | 3 (5.5) | 0.03 |
| Airway dilatation | 11 (6.3) | 5 (4.1) | 6 (10.9) | 0.1 |
| Air bronchogram | 12 (6.8) | 4 (3.3) | 8 (14.5) | 0.0099 |
| Septal thickening | 48 (27.3) | 29 (24) | 19 (34.5) | 0.15 |
| Cyst | 2 (1.1) | 1 (0.8) | 1 (1.8) | 0.52 |
| Cardiac indices | ||||
| Pulmonary artery diameter (mm) | 27.89 ± 4.81 | 27.62 ± 4.95 | 28.47 ± 4.46 | 0.10 |
| Aorta diameter (mm) | 32.56 ± 4.97 | 32.63 ± 5.17 | 32.4 ± 4.53 | 0.94 |
| Pulmonary artery/aorta ratio | 0.86 ± 0.17 | 0.85 ± 0.17 | 0.87 ± 0.16 | 0.24 |
| T/AP inferior vena cava | 1.08 ± 0.14 | 1.06 ± 0.13 | 1.11 ± 0.15 | 0.07 |
| T/AP trachea | 1.01 ± 0.21 | 1.04 ± 0.19 | 0.93 ± 0.23 | 0.0042 |
| Pleural effusion | ||||
| No pleural effusion | 110 (62.5) | 80 (66.1) | 30 (54.5) | 0.0086 |
| Mild | 54 (30.7) | 38 (31.4) | 16 (29.1) | |
| Moderate | 7 (4) | 2 (1.7) | 5 (9.1) | |
| Severe | 5 (2.8) | 1 (0.8) | 4 (7.3) | |
| Pericardial effusion | ||||
| None | 137 (77.8) | 95 (78.5) | 42 (76.4) | 0.41 |
| Mild | 36 (20.5) | 23 (19) | 13 (23.6) | |
| Moderate | 3 (1.7) | 3 (2.5) | 0 (0) | |
| Cardiothoracic ratio | 66 (37.5) | 38 (31.4) | 28 (50.9) | 0.018 |
| PA/A > 1 | 68 (38.6) | 39 (32.2) | 29 (52.7) | 0.012 |
Abbreviations: T/AP, transverse to anteroposterior diameter ratio; PA/A, pulmonary artery to the aorta ratio.
a Continuous variables are reported as mean ± SD and categorical variables are reported as No. (%).
4.3. Odds ratios (OR) of Death and Hazard Ratios (HR) of Hospitalization Based on Cardiovascular CCT Parameters
In the present study, logistic regression analysis was performed to assess the risk of mortality after classifying the age, sex, and comorbidities (Table 3). The odds ratios of death were increased in the CTR > 0.49, PA/A > 1, IVC diameter, pleural effusion, and the amount of lung involvement (OR = 1.75, OR = 1.99, OR = 10.09, OR = 10.79, and OR = 1.25, respectively). However, this was only significant in the PA/A > 1 and the volume of lung involvement (P = 0.046; P < 0.0001, respectively). The Cox regression analysis was also performed to investigate the relation between cardiovascular parameters and the time of hospitalization, in which the duration of hospitalization was prolonged along with increased CTR, PA/A > 1, IVC diameter, and pericardial effusion (HR = 1.43, HR = 1.36, HR = 2.22, HR = 1.09, respectively), which was not statistically noticeable. The moderate and severe pleural effusion was significantly associated with prolonged hospitalization (HR = 4.09 and HR = 3.37, respectively; P = 0.01 and P = 0.029, respectively). Moreover, lung involvement also increased the hospitalization duration considerably (HR = 1.1; P = 0.0002).
Table 3.
The Hazard Ratio of Hospitalization Time and Odds Ratio of Death Derived from Cardiovascular Computed Tomography Parameters in Patients with Coronavirus Disease 2019
| Variables | Odds Ratio (CI 95%) | P-Value | Hazard Ratio | P-Value |
|---|---|---|---|---|
| CTR > 0.49 | 1.75 (0.87 - 3.51) | 0.11 | 1.43 (0.82 - 2.51) | 0.19 |
| PA/A > 1 | 1.99 (1.1 - 3.94) | 0.046 | 1.36 (0.79 - 2.34) | 0.26 |
| IVC | 10.09 (0.90 - 127.3) | 0.06 | 2.22 (0.90 - 127.3) | 0.43 |
| Pleural effusion | ||||
| Mild | 0.72 (0.33 - 1.52) | 0.40 | 1.12 (0.59 - 2.07) | 0.71 |
| Moderate | 5.35 (1.04 - 42.53) | 0.058 | 4.09 (1.25 - 11.49) | 0.01 |
| Severe | 10.79 (1.31 - 243.6) | 0.052 | 3.37 (0.96 - 9.14) | 0.029 |
| Mild pericardial effusion | 1.09 (0.55 - 2.02) | 0.77 | ||
| Lung involvement | 1.25 (1.16 - 1.37) | < 0.0001 | 1.1 (1.04 - 1.16) | 0.0002 |
Abbreviations: CI, confidence interval; CTR, cardio-thoracic ratio; PA/A, pulmonary artery diameter to aorta diameter ratio; IVC, inferior vena cava.
4.4. Association Between Cardiovascular Parameters and Lung Involvement Scores in CCT
The relation between the extent of lung involvement and cardiovascular parameters was investigated with linear regression analysis (Table 4). As shown in Table 4, CTR > 0.49 increased lung involvement in all zones, which was significant in the middle, lower, and total zones (P = < 0.0001; P = 0.01; P = 0.0002, respectively). The PA/A > 1 was significantly associated with higher lung involvement in all zones (Table 4). A considerable correlation was also found between The IVC diameter and upper, middle, and total lung scores (P = 0.0009; P = 0.045; P = 0.024 respectively). Moreover, the mild pleural effusion was noticeably associated with zonal involvement in the upper and middle zones (P = 0.0026; P ≤ 0.0001). However, in moderate pleural effusion, the association was observed in lower and total zones (P = 0.008; P = 0.035), and no correlation was observed between severe pleural effusion and lung involvement except for the upper zone (P = 0.0327). The amount of lung involvement was increased in the middle, lower, and total zones in accordance with the first stage of pericardial effusion. However, the severe pericardial effusion showed no correlation with zonal lung involvement.
Table 4.
Association Between Cardiovascular Parameters and Lung Involvement Scores by Linear Regression Analysis in Coronavirus Disease 2019 Patients
| Variables | Upper Zone | Middle Zone | Lower Zone | Total Zone | ||||
|---|---|---|---|---|---|---|---|---|
| Standard Estimation (Standard Error) | P-Value | Standard Estimation (Standard Error) | P-Value | Standard Estimation (Standard Error) | P-Value | Standard Estimation (Standard Error) | P-Value | |
| CTR > 0.49 | 0.15 (0.22) | 0.47 | 1.76 (0.39) | < 0.0001 | 1.25 (0.50) | 0.01 | 3.17 (0.84) | 0.0002 |
| PA/A > 1 | 0.42 (0.21) | 0.043 | 0.84 (0.39) | 0.033 | 1.11 (0.48) | 0.024 | 2.37 (0.83) | 0.005 |
| IVC | 2.34 (0.69) | 0.0009 | 2.69 (1.33) | 0.045 | 1.43 (1.67) | 0.39 | 4.47 (2.83) | 0.024 |
| Pleural effusion | ||||||||
| Mild | -0.69 (0.22) | 0.0026 | 1.96 (0.41) | < 0.0001 | 0.25 (0.53) | 0.63 | 1.53 (0.93) | 0.0997 |
| Moderate | -0.33 (0.52) | 0.52 | 1.54 (0.95) | 0.11 | 3.34 (1.24) | 0.008 | 4.54 (2.14) | 0.035 |
| Severe | 1.27 (0.59) | 0.0327 | 1.41 (1.08) | 0.197 | -0.78 (1.41) | 0.58 | 1.90 (2.43) | 0.43 |
| Pericardial effusion | ||||||||
| Mild | -0.44 (0.25) | 0.085 | 2.36 (0.44) | < 0.0001 | 1.53 (0.58) | 0.009 | 3.73 (0.99) | 0.0002 |
| Moderate | 2 (-0.44) | 0.57 | 1.81 (1.35) | 0.18 | -1.92 (1.80) | 0.29 | -0.55 (3.05) | 0.85 |
Abbreviations: CTR, cardio-thoracic ratio; PA/A, pulmonary artery diameter to aorta diameter ratio; IVC, inferior vena cava diameter.
5. Discussion
Since the beginning of the COVID-19 pandemic in Iran, low-dose CT scans have become a crucial tool for screening and diagnosis of COVID-19 in suspected patients because of the shortage of RT-PCR tests (16, 21). On the other hand, the CT scan has been widely available in Iran, and this fact has made the CT scan a useful alternative to RT-PCR. Moreover, the latest national guideline for the diagnosis and management of COVID-19 patients in Iran suggested low-dose CT scans besides RT-PCR for the management of all cases with moderate to severe stages of the disease (16). Therefore, low-dose CT scan is now a routine and common part of patient management in COVID-19 centers in Iran. Despite the widespread use of low-dose CT scans in Iran, clinicians still do not take full advantage of them. In this study, we showed how cardiac indices in CT scans of COVID-19 patients can be used for risk stratification and evaluation of the outcomes.
As a result of the COVID-19 relationship with the cardiovascular system, poor outcomes can be experienced in 2 different ways. Previous epidemiological investigations reported that patients with pre-existing cardiovascular disorders such as coronary artery disease, heart failure, and hypertension are at higher risk for adverse outcomes of COVID-19 (22, 23). In our study, comorbidities like hypertension and heart failure were more common in deceased patients. On the other hand, COVID-19, with different mechanisms, causes cardiovascular complications in patients, including acute cardiac injury, heart failure, arrhythmia, myocarditis, acute coronary syndrome, and pleural effusion, which increase the risk of mortality and morbidity (22, 24). In this regard, our results showed that an increase in CTR, PA/A, and IVC diameter raised the likelihood of mortality in COVID-19 patients. Therefore, the findings of the present investigations admitted this two-sided relationship and its importance in predicting the outcomes in COVID-19 patients.
Traditionally, PA/A has been regarded as a reliable indicator of pulmonary hypertension because it correlates with the mean pulmonary artery pressure and predicts poor clinical outcomes in respiratory diseases (25). During the COVID-19 pandemic, several studies reported that increased PA/A is associated with poor prognosis in patients (3, 26). In a study by Eslami et al. in 2020, PA/A > 1 increased the odds and hazard of death, but it was not significantly correlated with them (3). Another study in Egypt also reported that PA/A > 1 had no significant relationship with the severity of disease in COVID-19 cases (27). A study in Japan found that PA/A > 0.9 was significantly associated with severe respiratory exacerbation and poor prognosis among hospitalized patients (28). Also, Dhok's investigation in India showed PA/A > 0.9 was related to the COVID-19 severity (29). A Turkish study in 2021 found the PA/A > 0.82 as an independent predictor of in-hospital mortality according to the considerable increase in odds of death, while the hazard ratio did not show significant changes (26). In this regard, our study also presented a significant relationship between PA/A > 1 and an increase in the odds ratio of hospitalized death. As it is clear, there is still controversy in accounting PA/A as an independent indicator for the prediction of COVID-19 outcomes in the clinic. One of the main sources for the heterogenicity in findings is using different cut-offs for the PA/A ratio. It seems that the best method for defining the PA/A ratio cut-off is to calculate optimal values in every study according to basic artery diameter in the study population. Also, it is suggested that a meta-analysis be performed in order to draw a conclusion from this controversy. Considering the high PA/A ratio can indicate pulmonary hypertension and microvascular thrombi is the leading cause, determining the ratio is important clinically, as it allows clinicians to assess patients who might benefit from early management of pulmonary hypertension and conduct cardiac echocardiography and anticoagulant therapy.
A CTR > 0.5 indicates heart enlargement and is used as a prognostic factor in different disorders, such as respiratory and cardiac diseases (30). Due to COVID-19's multi-organ nature and the fact that it affects both the heart and lungs, it was expected that CTR would change among the patients. Some investigations from different parts of the world showed that cardiomegaly was associated with disease severity (3, 31). In Kanayama et al.'s study in Japan, cardiomegaly was found to be strongly associated with the severity of the disease on admission (31). An Iranian study also reported that cardiomegaly showed significant relationships with odds and hazard of death among hospitalized patients (3). Also, Truszkiewicz et al.'s study in Poland found that CTR can be a useful prognosis predictor of right ventricle enlargement in COVID-19 patients with suspected pulmonary embolism (2). On the other hand, some reports indicate that cardiomegaly was not related to an increase in the risk of adverse outcomes in COVID-19 cases. In a study by Khosravi et al. (32), cardiomegaly was more common in deceased cases, but it did not show a significant association with worse outcomes. In addition, although our findings showed more frequency of cardiomegaly in deceased patients, it did not have significant relationships with an increase in odds and hazard of death. As there are different results on both sides, CTR > 0.5 cannot be accounted as a prognostic factor for COVID-19 yet. Therefore, more evidence and investigations are needed to determine cardiomegaly's role in predicting the COVID-19 prognosis.
The present study faced some limitations that need to be mentioned for improvement of future studies. First, only the images of CT scans of the patients on admission were used for analysis. It is suggested that the changes in cardiac indices in serial imaging be considered in future studies. Second, the thoracic motion and respiratory changes were not controlled and evaluated in the study, which may influence some measurements of indices. Third, we did not evaluate normal values of ratios in our study and used defined cut-offs. The cut-offs of ratios according to the normal features of the study population should be determined.
In conclusion, cardiac indices in chest CT of COVID-19 patients can be accounted for in the prediction of patient outcomes, such as PA/A > 1 ratio, which increases the likelihood of in-hospital death. Considering the controversy about the findings for suggesting CT-measured cardiac indices as prognostic factors in COVID-19 patients, further primary and secondary studies are needed.