
1. Background
Lung adenocarcinoma is a major subtype of non-small cell lung cancer. With the wider use of thin-section computed tomography (CT) and screening programs, radiologists are encountering an increasing number of small peripheral tumors amenable to surgical treatment. Recent randomized evidence has made the choice between lobectomy and sublobar resection more individualized, particularly for early peripheral disease (1, 2). Contemporary pathologic classification also emphasizes invasive growth patterns with prognostic implications (3).
Spread through air spaces (STAS) refers to detached tumor cell clusters or single cells within alveolar spaces beyond the main tumor border. This finding has been repeatedly associated with recurrence and worse outcomes after limited resection, with the concern being most pronounced for wedge resection (4, 5). In CT-solid tumors measuring 1 - 3 cm, preoperative estimation of the likelihood of STAS may therefore influence the operative plan and the targeted safety margin.
Preoperative assessment of STAS has been investigated using semantic CT, positron emission tomography/computed tomography (PET/CT), radiomics, and deep learning, but reported performance remains variable, and external validation is limited (6). Tumor computed tomography-derived extracellular volume fraction (CT-ECV) is a hematocrit-corrected enhancement index that may reflect stromal and extracellular changes and has shown potential for pulmonary lesion characterization and grading of invasive adenocarcinoma (7, 8). Whether CT-ECV adds useful information beyond routine CT morphology in small CT-solid adenocarcinoma remains uncertain.
2. Objectives
The purpose of this study was to investigate whether preoperative CT morphologic features and tumor CT-ECV can predict STAS in 1 - 3 cm CT-solid lung adenocarcinoma. We also examined the association between STAS and selected postoperative pathological features.
3. Patients and Methods
3.1. Patients
Eligible cases were retrospectively identified among patients who underwent resection for lung adenocarcinoma from January 2020 through June 2024. The institutional ethics review committee approved this study and waived informed consent because the analysis used anonymized clinical and imaging data collected in routine care (approval No. cqbykyll-20250724 - 01).
Patients were included if all of the following criteria were met: 1) maximum tumor diameter of 1 - 3 cm on preoperative CT; 2) a CT-solid pulmonary nodule; 3) available noncontrast and contrast-enhanced CT examinations; 4) preoperative hematocrit available for CT-ECV calculation; and 5) postoperative pathology documenting STAS status. Patients with incomplete clinical, imaging, or pathologic information or preoperative antitumor treatment were excluded. Pure ground-glass and part-solid nodules were excluded to maintain a radiologically homogeneous CT-solid cohort because their attenuation composition requires a different CT-ECV measurement strategy and may complicate the distinction between intratumoral ground-glass and peripheral ill-defined opacity. The final cohort included 51 STAS-negative and 53 STAS-positive tumors (Figure 1).
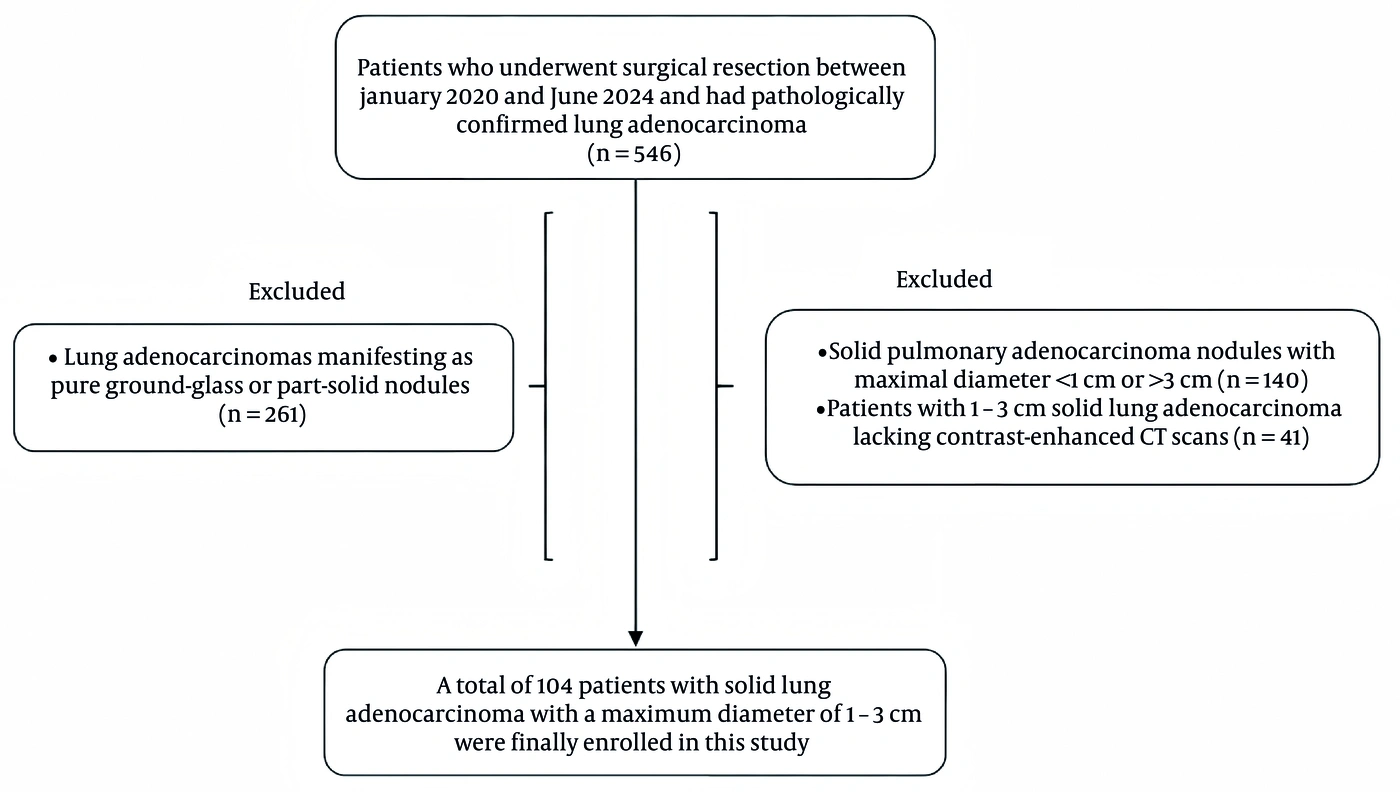
Figure 1.
Flow diagram of patient selection. (Abbreviation: CT, computed tomography.)
3.2. CT Acquisition and Image Analysis
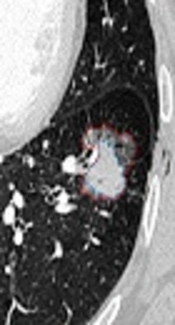
The preoperative dataset comprised age, sex, maximum and minimum lesion diameters, tumor CT-ECV, and visually assessed CT findings: lobulation, vacuole sign, spiculation, vascular convergence, pleural indentation, air bronchogram, peripheral ill-defined opacity, and satellite lesions. Peripheral ill-defined opacity was defined as a non-solid hazy attenuation immediately outside and contiguous with the tumor margin, distinct from intratumoral ground-glass, satellite nodules, and linear vascular or bronchial structures (9) (Figure S1A in the Supplementary File; Figure 2A). It was considered absent when the tumor-lung interface was sharp and no peripheral ill-defined opacity was present (Figure S1B in the Supplementary File). Two thoracic radiologists with 5 and 6 years of experience independently reviewed the images while blinded to pathology; a senior chest radiologist with 20 years of experience adjudicated disagreements. Consensus ratings were used for descriptive and prediction analyses, and the original independent ratings were used for interobserver agreement.
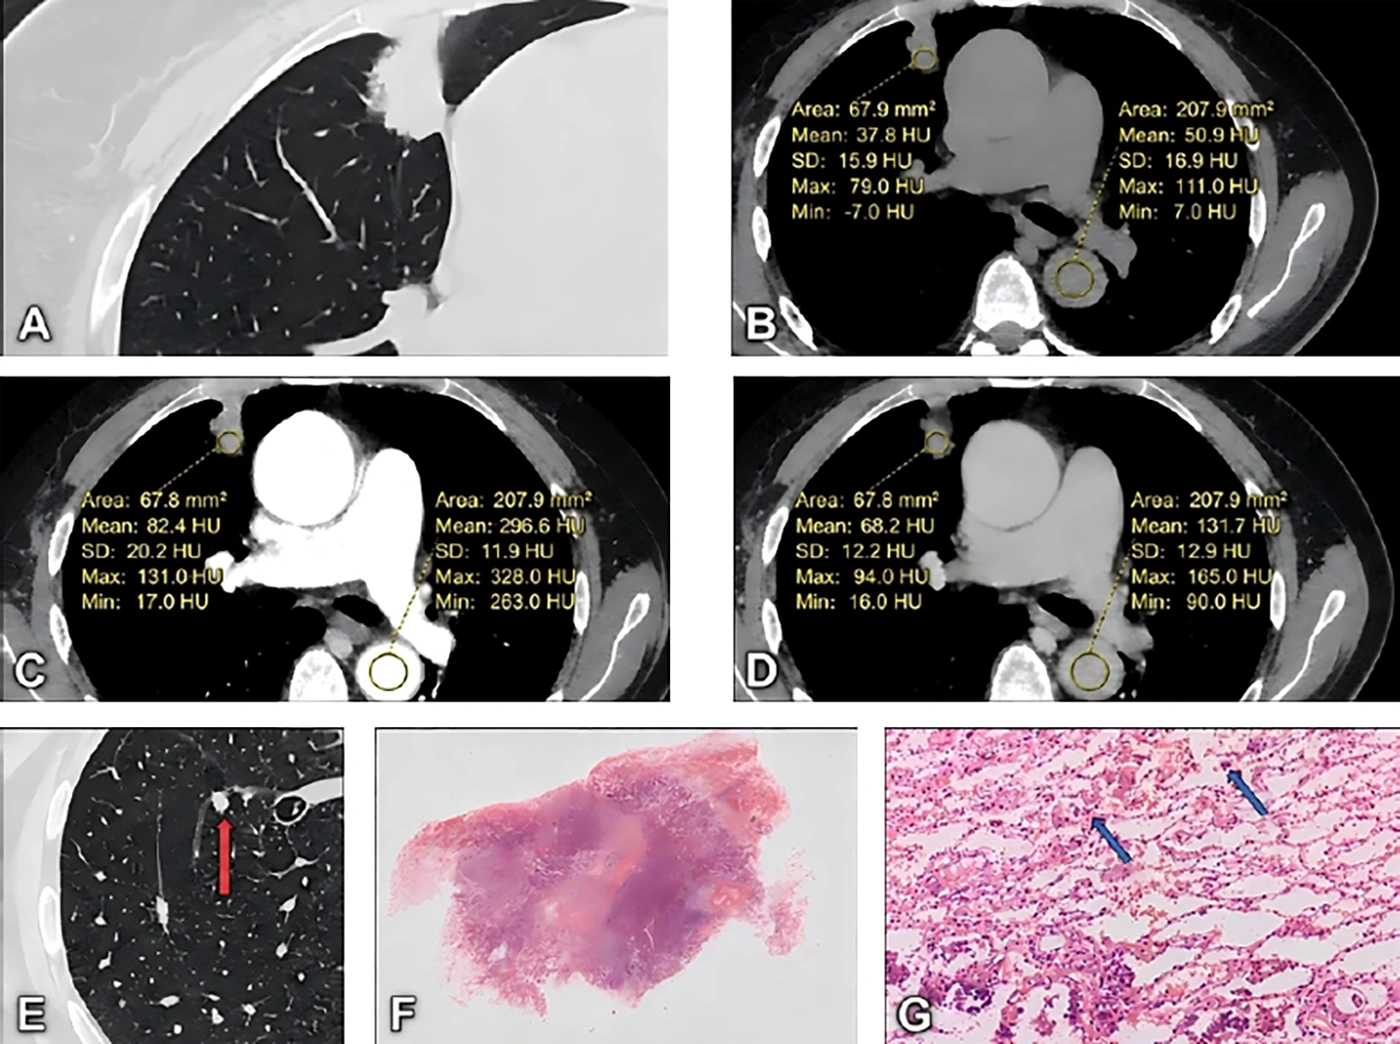
Figure 2.
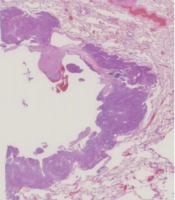
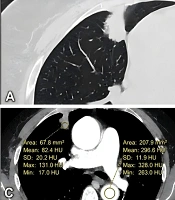
Example of STAS-positive lung adenocarcinoma. The 69-year-old patient had a 25.9-mm lesion on preoperative CT. The tumor showed lobulation, spiculation, and pleural indentation; peripheral ill-defined opacity was visible as a non-solid hazy attenuation immediately outside and contiguous with the lateral margin of the right upper lobe tumor (A). Vascular convergence, vacuole sign, air bronchogram, and satellite lesions were absent. Unenhanced, arterial-phase, and venous-phase CT images are shown in B-D, respectively. Tumor CT-ECV was calculated as 22.27% using the unenhanced and venous-phase attenuation measurements (B and D) together with the hematocrit value; the arterial-phase measurements (C) were not used in the calculation. Follow-up CT showed intrapulmonary metastasis (E, red arrow). Surgical pathology demonstrated STAS (F-G, blue arrows), lymphovascular invasion, and pleural invasion, without mediastinal lymph node metastasis. (Abbreviations: CT, computed tomography; CT-ECV, computed tomography-derived extracellular volume fraction; HU, Hounsfield unit; SD, standard deviation; STAS, spread through air spaces.)
Interobserver agreement for each semantic feature was assessed from the initial independent binary ratings using Cohen's kappa and the discordance rate. Percentile bootstrap 95% confidence intervals (CIs) were obtained from 10,000 resamples. Kappa values were interpreted as slight (< 0.20), fair (0.21 - 0.40), moderate (0.41 - 0.60), substantial (0.61 - 0.80), or almost perfect (> 0.80) agreement (Table S1 in the Supplementary File).
All examinations were obtained on a Discovery CT750 HD scanner (GE Healthcare) using 64 × 0.625-mm collimation, a pitch of 0.984, 0.28-second rotation, 5.5-mm section thickness, and a 5.5-mm interval for the original scans. After the non-contrast series, iohexol (300 mgI/mL) was administered at 1.5 mL/kg and 2.5 mL/s, followed by 30 mL saline. Bolus tracking in the descending aorta used a 120-Hounsfield unit (HU) trigger; arterial images were acquired 8 seconds after triggering and venous images 30 seconds after completion of the arterial phase. The arterial phase was part of routine imaging but was not used for feature scoring, attenuation measurement, CT-ECV calculation, remeasurement reproducibility assessment, or modeling. Semantic features were assessed on 1.0-mm venous-phase lung-window reconstructions, whereas CT-ECV used the unenhanced and venous-phase series. No interscanner harmonization or cross-calibration was performed because a single scanner and fixed protocol were used.
CT-ECV was measured from unenhanced and venous-phase attenuation values using a single-slice region-of-interest (ROI) approach. A central intratumoral ROI was placed on the largest axial tumor section, avoiding visible vessels, air-containing bronchi, the tumor edge, and adjacent aerated lung. A blood-pool ROI was placed in the descending aortic lumen at the same or nearest axial level, excluding the vessel wall and artifacts. Tumor CT-ECV was calculated as (1 - hematocrit) × [(CTtumor, venous - CTtumor, unenhanced) / (CTaorta, venous - CTaorta, unenhanced)] × 100. The median hematocrit-to-CT interval was 0 days (first quartile [Q1], 0 days; third quartile [Q3], 1 day), the maximum was 3 days, and 99 of 104 patients (95.2%) had hematocrit measured within 1 day. Pleural invasion, lymphovascular invasion, and mediastinal lymph node metastasis were assessed only as postoperative pathologic correlates. To assess ROI-based remeasurement reproducibility, attenuation measurements were repeated on the same original unenhanced and venous-phase CT images after a 3-month interval using identical ROI-placement rules; no second CT acquisition was performed. CT-ECV was recalculated using these repeated attenuation measurements and the same recorded hematocrit value.
3.3. Statistical Analysis
Statistical analyses were performed using Python 3.13.5 with NumPy 2.3.5, pandas 2.2.3, SciPy 1.17.0, scikit-learn 1.8.0, statsmodels 0.14.6, and Matplotlib 3.10.8. Normally distributed continuous variables are presented as mean ± standard deviation and were compared using the independent-samples t-test; skewed variables are presented as median (Q1, Q3) and were compared using the Mann-Whitney U test. Categorical variables are presented as n (%) and were compared using the chi-square or Fisher exact test. CT-ECV remeasurement reproducibility was evaluated using the Wilcoxon signed-rank test, the intraclass correlation coefficient (ICC), and Bland-Altman analysis; limits of agreement were defined as the mean difference ± 1.96 standard deviations. The relationship between the hematocrit-to-CT interval and the absolute repeat-measurement difference was assessed using the Spearman rank correlation coefficient (rs), and same-day versus delayed hematocrit groups were compared using the Mann-Whitney U test. All tests were two-sided, with P < 0.05 considered statistically significant.
3.4. Sample Size Considerations
All eligible patients during the predefined period were included; therefore, no a priori sample size calculation was performed. A retrospective assessment using the Riley framework (10, 11) identified 53 STAS-positive outcomes for 12 candidate parameters (4.42 events per parameter). Using an area under the receiver operating characteristic curve (AUC) of approximately 0.63, an STAS prevalence of 51.0%, and a target shrinkage of 0.90 yielded an estimated minimum sample of approximately 2,029 participants, including about 1,034 STAS-positive cases. This estimate is specific to the present modeling objective and the stated assumptions and should not be interpreted as a universal sample-size benchmark. Nevertheless, the marked discrepancy between the estimated requirement and the 104 available cases indicates that variable selection, coefficient estimates, and model performance may remain highly sensitive to sample-specific variation. Accordingly, all prediction analyses were considered exploratory and hypothesis-generating.
The primary prediction analysis used least absolute shrinkage and selection operator (LASSO)-penalized logistic regression (12). Twelve prespecified predictors were entered simultaneously: age, sex, maximum and minimum diameter, tumor CT-ECV, lobulation, vacuole sign, vascular convergence, pleural indentation, air bronchogram, peripheral ill-defined opacity, and satellite lesions. Spiculation was excluded because it was present in 103 of 104 tumors and provided insufficient variation. Predictors were standardized within each training set. Model tuning and evaluation used 20 repetitions of nested stratified five-fold cross-validation, with penalty selection confined to each outer training set and performance evaluated in the held-out fold. Aggregated out-of-fold predictions were used to estimate the AUC with a bootstrap 95% CI, Brier score, calibration intercept and slope, and a smoothed calibration curve with a bootstrap 95% confidence band. A prevalence-only model would have a Brier score of approximately 0.250 at the observed STAS prevalence of 51.0%. A full-cohort stratified 10-fold analysis described variables retained at the minimum-error penalty (lambda-min) and the one-standard-error penalty (lambda-1se); stability at lambda-min was evaluated in 1,000 bootstrap resamples. Univariable logistic regressions and an unpenalized model containing CT-ECV and peripheral ill-defined opacity were secondary exploratory association analyses and did not determine predictor inclusion or primary performance.
4. Results
4.1. Patient Characteristics, CT Features, and Interobserver Agreement
Among the 104 patients with 1 - 3 cm CT-solid lung adenocarcinoma, 53 (51.0%) had STAS on pathological examination. The median CT-ECV in the complete cohort was 18.39% (12.31%, 24.52%). The clinical and CT characteristics are summarized in Table 1. Peripheral ill-defined opacity was more frequent in the STAS-positive group than in the STAS-negative group (77.4% [41/53] vs. 49.0% [25/51], P = 0.003). CT-ECV was numerically higher in STAS-positive tumors; however, the Mann-Whitney comparison of the two distributions did not reach statistical significance (19.17% [14.16%, 24.28%] vs. 16.61% [11.12%, 24.64%], P = 0.100). No significant group differences were observed for the remaining variables in Table 1.
Table 1.
Clinical and Preoperative CT Characteristics According to STAS Status a
| Variables | Overall (n = 104) | STAS-Negative (n = 51) | STAS-Positive (n = 53) | P Value |
|---|---|---|---|---|
| Age (y) | 65.14 ± 8.78 | 65.86 ± 8.28 | 64.45 ± 9.26 | 0.415 |
| Maximum diameter (mm) | 17.95 (14.28, 25.10) | 17.70 (13.90, 23.60) | 18.50 (14.40, 25.60) | 0.658 |
| Minimum diameter (mm) | 13.35 (10.58, 18.40) | 12.80 (10.50, 17.85) | 14.00 (11.00, 18.90) | 0.303 |
| Tumor CT-ECV (%) | 18.39 (12.31, 24.52) | 16.61 (11.12, 24.64) | 19.17 (14.16, 24.28) | 0.100 |
| Sex, male/female | 47/57 | 20/31 | 27/26 | 0.230 |
| Lobulation, present | 62 (59.6) | 31 (60.8) | 31 (58.5) | 0.812 |
| Vacuole sign, present | 46 (44.2) | 23 (45.1) | 23 (43.4) | 0.861 |
| Spiculation, present | 103 (99.0) | 51 (100.0) | 52 (98.1) | 1.000 |
| Vascular convergence, present | 98 (94.2) | 50 (98.0) | 48 (90.6) | 0.205 |
| Pleural indentation, present | 90 (86.5) | 44 (86.3) | 46 (86.8) | 0.938 |
| Air bronchogram, present | 51 (49.0) | 29 (56.9) | 22 (41.5) | 0.117 |
| Peripheral ill-defined opacity, present | 66 (63.5) | 25 (49.0) | 41 (77.4) | 0.003 |
| Satellite lesions, present | 3 (2.9) | 1 (2.0) | 2 (3.8) | 1.000 |
a Values are expressed as mean ± standard deviation, median (Q1, Q3), or No. (%). P values describe between-group comparisons and were not used for predictor screening in the primary LASSO analysis. Abbreviations: CT, computed tomography; CT-ECV, computed tomography-derived extracellular volume fraction; Q1, first quartile; Q3, third quartile; STAS, spread through air spaces.
Interobserver agreement is detailed in Table S1 in the Supplementary File. Peripheral ill-defined opacity had a 3.8% discordance rate (4/104) and almost perfect agreement (kappa, 0.919; 95% CI, 0.834 - 0.981). Agreement was also almost perfect for lobulation, vacuole sign, pleural indentation, air bronchogram, and satellite lesions, whereas vascular convergence showed substantial agreement (kappa, 0.785; 95% CI, 0.477 - 1.000). Spiculation had 99.0% raw agreement but an uninformative kappa of 0 because of near-universal prevalence.
4.2. Penalized Model and Internal Validation
At lambda-min, peripheral ill-defined opacity, tumor CT-ECV, and vascular convergence retained non-zero coefficients; at lambda-1se, only peripheral ill-defined opacity remained. In 1,000 bootstrap resamples at lambda-min, these variables were retained in 95.1%, 76.5%, and 57.9% of resamples, respectively. The remaining candidate predictors had lower selection frequencies; individual frequencies for all 12 prespecified candidates are reported in Table 2. Repeated nested cross-validation yielded an out-of-fold AUC of 0.632 (bootstrap 95% CI, 0.522 - 0.737) and a mean fold-specific AUC of 0.628 ± 0.122 (Figure 3A).
Table 2.
| Variables | Retained at Lambda-min | Retained at Lambda-1se | Bootstrap Selection (%) | |
|---|---|---|---|---|
| Panel A: LASSO analysis | ||||
| Peripheral ill-defined opacity | Yes | Yes | 95.1 | |
| Tumor CT-ECV | Yes | No | 76.5 | |
| Vascular convergence | Yes | No | 57.9 | |
| Sex | No | No | 45.1 | |
| Age | No | No | 29.1 | |
| Air bronchogram | No | No | 27.2 | |
| Minimum diameter | No | No | 18.2 | |
| Satellite lesions | No | No | 15.5 | |
| Vacuole sign | No | No | 12.7 | |
| Lobulation | No | No | 10.3 | |
| Maximum diameter | No | No | 10.1 | |
| Pleural indentation | No | No | 8.5 |
a Panel A summarizes the primary penalized analysis. Bootstrap selection frequency denotes the proportion of 1,000 bootstrap resamples in which a predictor had a non-zero coefficient at lambda-min; individual frequencies are reported for all 12 candidate predictors, ordered from highest to lowest. The full-cohort lambda-1se model retained only peripheral ill-defined opacity. Panel B provides secondary unpenalized association estimates for interpretability and was not used as the primary predictive model. The Mann-Whitney P value for CT-ECV in Table 1 (P = 0.100) and the univariable logistic-regression P value here (P = 0.069) arise from different statistical hypotheses. Spiculation was excluded because it was present in 103 of 104 tumors. Abbreviations: CI, confidence interval; CT, computed tomography; CT-ECV, computed tomography-derived extracellular volume fraction; LASSO, least absolute shrinkage and selection operator; OR, odds ratio; STAS, spread through air spaces; lambda-min, minimum-error penalty; lambda-1se, one-standard-error penalty.
b Panel B: Secondary logistic regression. Peripheral ill-defined opacity: Univariable OR 3.553 (95% CI, 1.525-8.278), P = 0.003; adjusted OR 4.336 (95% CI, 1.760-10.683), P = 0.001. Tumor CT-ECV (per 1% increase): Univariable OR 1.040 (95% CI, 0.997-1.084), P = 0.069; adjusted OR 1.053 (95% CI, 1.007-1.101), P = 0.024.
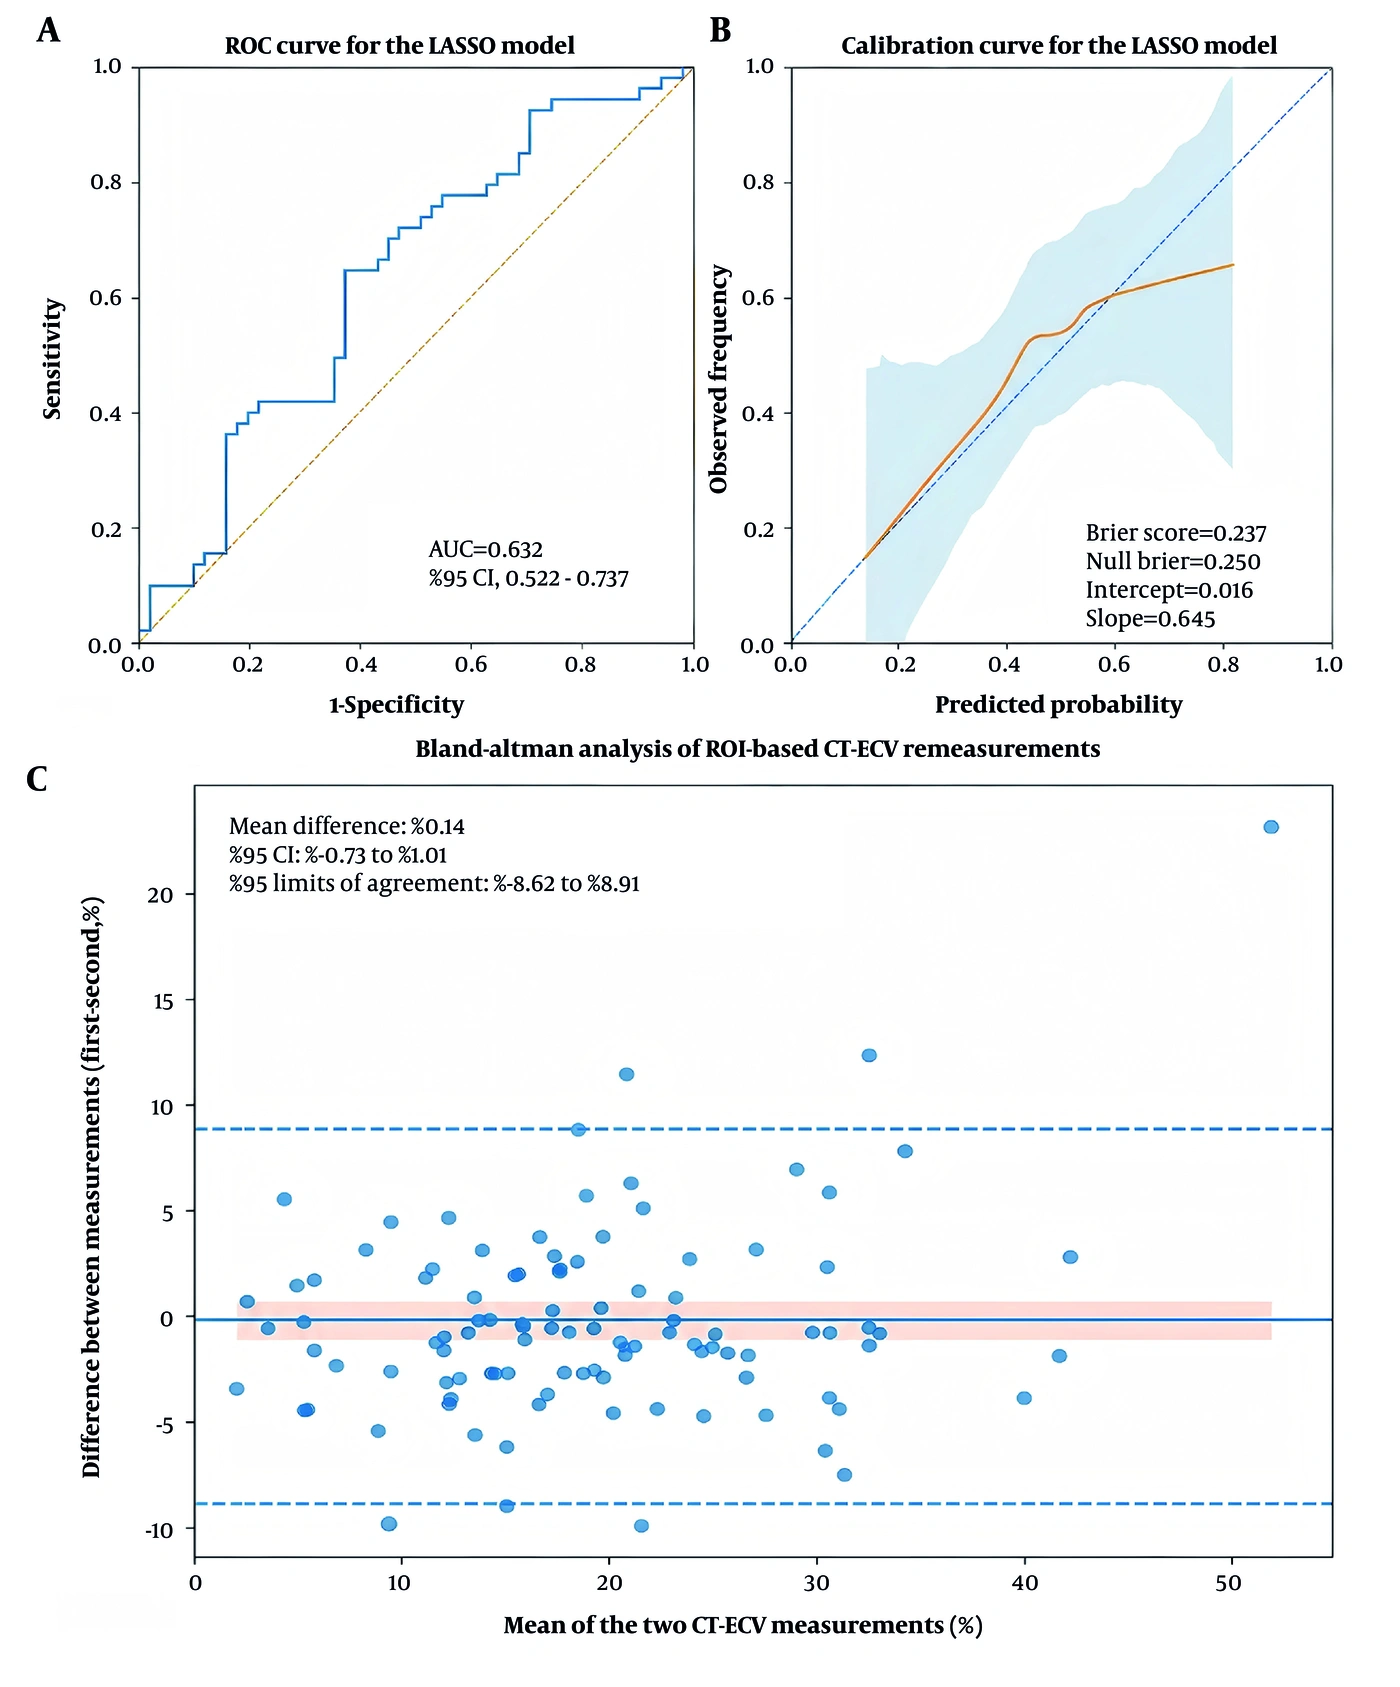
Figure 3.
Internal validation of the LASSO model and CT-ECV remeasurement reproducibility. A, Receiver operating characteristic curve based on repeated nested cross-validation out-of-fold predictions. B, Smoothed calibration curve based on the same predictions; the shaded area represents the bootstrap 95% confidence band, and the Brier score, calibration intercept, and calibration slope are displayed. C, Bland-Altman plot of the first minus the second ROI-based CT-ECV measurement on the same original CT examinations; the solid line indicates the mean difference, the shaded band indicates the 95% confidence interval of the mean difference, and the dashed lines indicate the 95% limits of agreement. (Abbreviations: AUC, area under the receiver operating characteristic curve; CI, confidence interval; CT, computed tomography; CT-ECV, computed tomography-derived extracellular volume fraction; LASSO, least absolute shrinkage and selection operator; ROC, receiver operating characteristic; ROI, region of interest.)
4.3. Calibration Performance and Secondary Association Analysis
Calibration was modest. The Brier score was 0.237 versus approximately 0.250 for a prevalence-only model. The calibration intercept was 0.016, whereas the slope was 0.645, indicating overly extreme predictions. The smoothed curve departed from the ideal line, particularly at higher predicted probabilities, with wide confidence bands at the extremes (Figure 3B).
In secondary, unpenalized exploratory association analyses, peripheral ill-defined opacity was associated with STAS in univariable (odds ratio [OR], 3.553; 95% CI, 1.525 - 8.278; P = 0.003) and adjusted models (OR, 4.336; 95% CI, 1.760 - 10.683; P = 0.001). CT-ECV showed a borderline univariable association (OR, 1.040 per 1% increase; 95% CI, 0.997 - 1.084; P = 0.069) and an adjusted association after accounting for peripheral ill-defined opacity (OR, 1.053; 95% CI, 1.007 - 1.101; P = 0.024). The Mann-Whitney and logistic-regression P values reflect different hypotheses, but both unadjusted analyses provided only borderline evidence for CT-ECV. These estimates are provided for interpretability and should not be regarded as confirmatory effect estimates.
4.4. Pathological Correlations and CT-ECV Remeasurement Reproducibility
Correlation analysis demonstrated a weak positive relationship between lymphovascular invasion and STAS (rs = 0.226; P = 0.021). Mediastinal lymph node metastasis showed a marginal relationship with STAS (rs = 0.189; P = 0.054), whereas pleural invasion was not significantly related to STAS (rs = 0.156; P = 0.113).
CT-ECV was remeasured on the same original CT examinations in all 104 patients after a 3-month interval. The median (Q1, Q3) CT-ECV values at the first and second measurements were 18.39% (12.31%, 24.52%) and 17.82% (13.95%, 25.32%), respectively, with no significant paired difference (P = 0.490). Relative agreement was good (ICC, 0.890; 95% CI, 0.841 - 0.924; P < 0.001), and the mean difference was 0.14% (95% CI, -0.73% to 1.01%). However, the 95% limits of agreement were wide (-8.62% to 8.91%), indicating substantial individual-level variability in ROI-based remeasurement (Figure 3C).
The hematocrit-to-CT interval was 0 days in 57 patients (54.8%), 1 day in 42 (40.4%), 2 days in 4 (3.8%), and 3 days in 1 (1.0%). It was not associated with the absolute repeat-measurement difference (Spearman rs = 0.069; P = 0.486), which was similar between same-day hematocrit and intervals of at least 1 day (2.21% vs. 2.45%; P = 0.592; Table S2 in the Supplementary File).
5. Discussion
Peripheral ill-defined opacity was retained at both penalty levels and in 95.1% of bootstrap resamples, whereas CT-ECV was retained at lambda-min and in 76.5% of resamples but not at lambda-1se, indicating greater stability of the morphologic sign. Internal validation showed modest and uncertain discrimination (out-of-fold AUC, 0.632; 95% CI, 0.522 - 0.737), with the lower confidence bound close to chance. A calibration slope of 0.645 and a Brier score only marginally better than the prevalence-only benchmark provided direct evidence of residual overfitting. Although repeated nested cross-validation limits within-cohort optimism, it does not establish transportability across institutions, scanners, or acquisition protocols. Given the small number of outcomes relative to the number of candidate parameters (13), the model should not be used for individual risk estimation or surgical decision-making before larger-scale external validation.
Peripheral ill-defined opacity may reflect microscopic alveolar involvement, local inflammation, or early extension along air-containing spaces. Prior CT studies have reported associations between STAS and tumor morphology or peritumoral abnormalities (9). Clinicoradiologic models have also shown that conventional CT features can contribute to preoperative assessment (14, 15). In the present study, high selection stability was accompanied by almost perfect interobserver agreement, supporting reproducibility under the study conditions. Nevertheless, external reader and multicenter validation remain necessary. The greater stability of this visually assessed but highly reproducible morphologic sign, relative to CT-ECV, supports cautious, staged validation of the quantitative biomarker before it is combined with morphology in any composite clinical score.
Preoperative STAS research now spans semantic CT, PET/CT, radiomics, and deep learning, but reviews emphasize heterogeneity in methods and validation (16, 17). Quantitative spectral and dual-energy CT parameters have also been associated with STAS (18, 19). PET/CT nomograms and automated deep-learning models have reported promising discrimination, although their complexity and transportability remain concerns (20, 21). Multicenter radiomics-deep-learning and validated clinicoradiologic models further support imaging-based assessment, but independent validation remains essential (22, 23). Against this background, the modest performance of our CT morphology and CT-ECV approach should be interpreted cautiously rather than as evidence of clinical readiness.
Evidence for CT-ECV was less consistent. Both unadjusted analyses were borderline, CT-ECV was retained only at lambda-min, and the adjusted odds ratio should therefore be considered exploratory. STAS has been associated with higher International Association for the Study of Lung Cancer grade and aggressive histologic patterns (24). Preoperative histopathologic studies have likewise linked STAS with micropapillary or solid components (25), while epithelial-mesenchymal transition and stromal-cell alterations may contribute to cell detachment and air-space dissemination (26, 27). Higher CT-ECV could therefore reflect stromal expansion, desmoplasia, inflammation, or extracellular-matrix remodeling rather than STAS itself. Because histologic subtype and quantitative stromal markers were unavailable, the study cannot determine whether CT-ECV is an independent correlate, surrogate, confounder, or mediator.
Measurement location may also influence the relationship between CT-ECV and STAS. Central tumor ROIs were used to reduce contamination from aerated lung and edge partial-volume effects, but STAS occurs beyond the tumor border. Future studies should compare central, peripheral-rim, and immediately peritumoral CT-ECV using co-registered unenhanced and venous-phase images, standardized spatial ROIs, and volumetric or voxel-wise methods. ROI-based CT-ECV remeasurement showed good relative reproducibility but limited absolute agreement: the ICC was 0.890, yet the Bland-Altman limits of -8.62% to 8.91% were wide relative to the cohort median. These findings reflect repeated ROI placement and attenuation measurement on the same CT examinations rather than true scan-rescan reliability. For future clinical implementation, standardized ROI placement, same-day hematocrit measurement, acquisition timing, and prospective scan-rescan or volumetric assessments should be evaluated.
The weak correlation between lymphovascular invasion and STAS suggests shared malignant potential but incomplete overlap between alveolar and lymphovascular dissemination. A meta-analysis has suggested a possible benefit of adjuvant chemotherapy in resected stage I STAS-positive disease (28). Real-world multicenter data also reinforce the adverse prognostic relevance of STAS (29). Because recurrence and survival were not evaluated according to combined pathologic findings in this cohort, our correlation results remain hypothesis-generating.
This study has several limitations. The surgically selected cohort represents a narrow clinical and radiologic spectrum. Patients managed without surgery, those with medically inoperable or unresectable disease, and those with pure ground-glass or part-solid nodules were not represented; therefore, the observed STAS prevalence and imaging associations should not be generalized to screening populations. Other limitations include the small sample (4.42 STAS-positive outcomes per candidate parameter), single-center design, absence of external validation, and residual instability despite penalization. Histologic subtype and quantitative stromal or cell-adhesion markers were unavailable, and reader agreement was assessed within one institution. CT-ECV was measured using a single-slice central ROI; peripheral or peritumoral CT-ECV could not be assessed. Nonsimultaneous hematocrit measurement and use of a single scanner and protocol further limit precision and transportability. Multicenter studies should standardize acquisition and ROI methods and consider cross-calibration before pooling CT-ECV values across systems.
In conclusion, peripheral ill-defined opacity was the most stable imaging contributor to STAS assessment in surgically resected 1 - 3 cm CT-solid lung adenocarcinoma, whereas CT-ECV showed a less consistent association. Given modest discrimination, limited calibration, and measurement variability, these findings remain exploratory and require validation in substantially larger multicenter cohorts before clinical use.