


1. Background
2. Objectives
3. Patients and Methods
3.1. Subjects
3.2. Inclusion and Exclusion Criteria
3.3. Sample Size Justification
3.4. Multi-Slice Computed Tomography Single-Slice Dynamic Scanning
3.5. Collection of Clinicopathological Characteristics
3.6. Prognostic Follow-up
3.7. Statistical Analysis
4. Results
4.1. Time-Density Curve Parameters of Lung Cancer and Benign Groups
| Groups | N | PT (s) | PV (Hu) | CER (%) |
|---|---|---|---|---|
| Benign | 90 | 22.65 ± 5.18 | 23.84 ± 6.32 | 11.03 ± 3.68 |
| Lung cancer | 90 | 37.49 ± 6.35 | 34.98 ± 5.58 | 14.87 ± 4.35 |
| t | - | 17.180 | 12.535 | 6.394 |
| P | - | < 0.001 | < 0.001 | < 0.001 |
Abbreviations: PV, peak value; PT, peak time; CER, contrast enhancement ratio; Hu, hounsfield unit.
a Values are expressed as mean ± SD.
4.2. Time-Density Curve Parameters in Lung Cancer Patients with Different Pathological Characteristics
| Variables | PT (s) | t/F | P | PV (Hu) | t/F | P | CER (%) | t/F | P |
|---|---|---|---|---|---|---|---|---|---|
| Gender | 0.649 | 0.518 | 0.072 | 0.943 | 0.320 | 0.750 | |||
| Male (n = 52) | 37.85 ± 5.98 | 35.02 ± 5.68 | 14.98 ± 4.48 | ||||||
| Female (n = 38) | 37.00 ± 6.35 | 34.93 ± 6.02 | 14.65 ± 5.28 | ||||||
| Age (y) | 0.038 | 0.970 | 0.614 | 0.871 | 0.831 | 0.408 | |||
| < 60 (n = 35) | 37.52 ± 5.85 | 34.86 ± 5.52 | 14.28 ± 4.85 | ||||||
| ≥ 60 (n = 55) | 37.47 ± 6.25 | 35.06 ± 5.74 | 15.20 ± 5.28 | ||||||
| Pathological type | 0.059 | 0.943 | 0.133 | 0.876 | 0.091 | 0.913 | |||
| Adenocarcinoma (n = 54) | 37.58 ± 5.48 | 35.02 ± 5.69 | 15.03 ± 4.65 | ||||||
| Squamous cell carcinoma (n = 30) | 37.49 ± 6.98 | 34.71 ± 5.18 | 14.68 ± 4.49 | ||||||
| Adenosquamous cell carcinoma (n = 6) | 36.68 ± 6.52 | 35.97 ± 6.02 | 14.38 ± 5.18 | ||||||
| Tumor type | 0.073 | 0.942 | 0.720 | 0.788 | 0.256 | 0.798 | |||
| Periphery (n = 55) | 37.45 ± 6.38 | 35.11 ± 5.68 | 14.97 ± 4.87 | ||||||
| Central (n = 35) | 37.55 ± 6.21 | 34.78 ± 5.59 | 14.71 ± 4.39 | ||||||
| Differentiation degree | 54.378 | < 0.001 | 61.332 | < 0.001 | 7.936 | < 0.001 | |||
| Poorly differentiated (n = 35) | 39.26 ± 5.25 | 38.45 ± 5.65 | 15.85 ± 5.02 | ||||||
| Moderately differentiated (n = 27) | 34.56 ± 4.69 | 32.12 ± 6.12 | 13.02 ± 4.98 | ||||||
| Highly differentiated (n = 28) | 25.76 ± 5.39 | 21.93 ± 5.98 | 10.78 ± 5.18 | ||||||
| Tumor diameter (cm) | 0.673 | 0.503 | 0.202 | 0.840 | 0.169 | 0.866 | |||
| < 3 (n = 30) | 36.98 ± 4.89 | 35.15 ± 5.84 | 14.97 ± 3.87 | ||||||
| ≥ 3 (n = 60) | 37.75 ± 5.22 | 34.90 ± 5.38 | 14.82 ± 4.02 | ||||||
| TNM stage | 2.902 | 0.005 | 6.998 | < 0.001 | 3.726 | < 0.001 | |||
| Stage I-II (n = 44) | 35.59 ± 6.32 | 31.25 ± 4.87 | 12.98 ± 4.25 | ||||||
| Stage III-IV (n = 46) | 39.31 ± 5.84 | 38.55 ± 5.02 | 16.68 ± 5.11 | ||||||
| Lymph node metastasis | 3.803 | < 0.001 | 6.859 | < 0.001 | 3.978 | < 0.001 | |||
| Yes (n = 38) | 40.26 ± 6.32 | 39.46 ± 5.84 | 17.02 ± 4.98 | ||||||
| No (n = 52) | 35.47 ± 5.58 | 31.71 ± 4.86 | 13.30 ± 3.89 |
Abbreviations: PT, peak time; PV, peak value; CER, contrast enhancement ratio; TNM, tumor-node-metastasis; Hu, hounsfield unit.
a Values are expressed as mean ± SD.
4.3. Correlations of Time-Density Curve Parameters with Pathological Characteristics of Lung Cancer Patients
| Parameters and Statistic | Differentiation Degree | TNM Stage | Lymph Node Metastasis |
|---|---|---|---|
| PT | |||
| ρ | 0.60 | 0.37 | 0.41 |
| P | < 0.001 | < 0.001 | < 0.001 |
| PV | |||
| ρ | 0.66 | 0.41 | 0.43 |
| P | < 0.001 | < 0.001 | < 0.001 |
| CER | |||
| ρ | 0.44 | 0.39 | 0.42 |
| P | < 0.001 | < 0.001 | < 0.001 |
Abbreviations: TNM, tumor-node-metastasis; PT, peak time; PV, peak value; CER, contrast enhancement ratio.
4.4. Time-Density Curve Parameters in Lung Cancer Patients with Different Prognoses
| Groups | N | PT (s) | PV (Hu) | CER (%) |
|---|---|---|---|---|
| Alive | 64 | 35.68±5.58 | 33.25 ± 5.86 | 13.24 ± 4.02 |
| Dead | 26 | 41.95±6.32 | 39.24 ± 6.02 | 18.88 ± 5.13 |
| t | - | 4.648 | 4.361 | 5.557 |
| P | - | < 0.001 | < 0.001 | < 0.001 |
Abbreviations: PT, peak time; PV, peak value; CER, contrast enhancement ratio; Hu, hounsfield unit.
a Values are expressed as mean ± SD.
4.5. Values of Time-Density Curve Parameters for Predicting Prognosis of Lung Cancer Patients
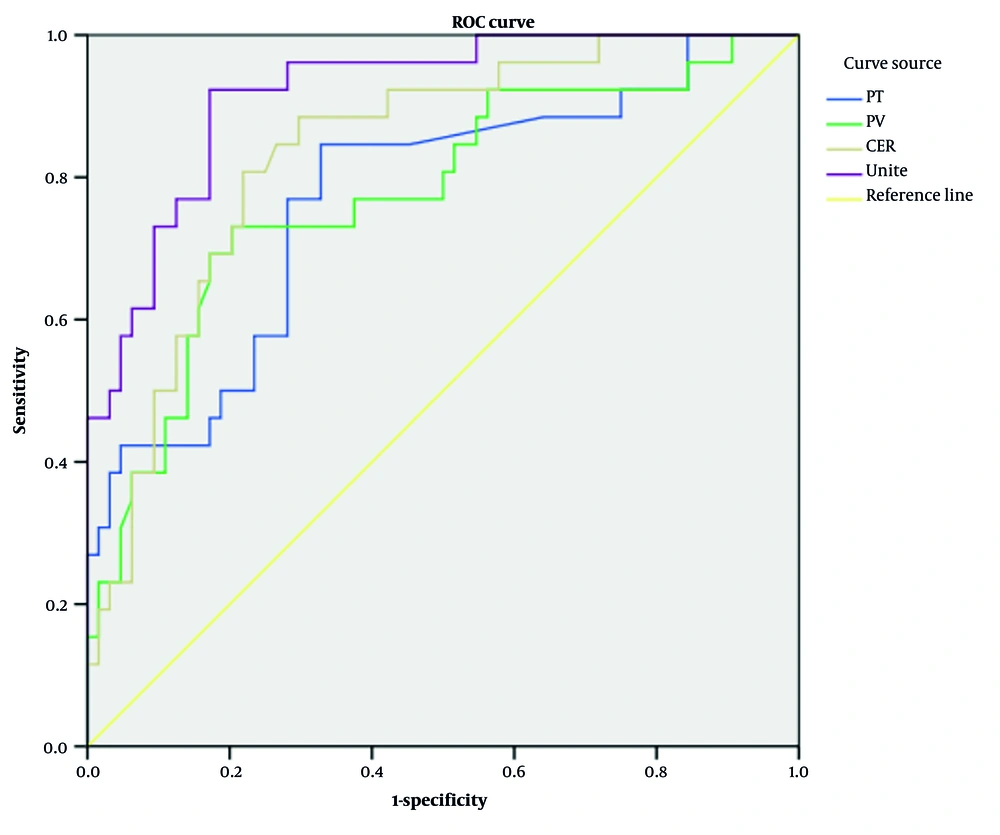
Receiver operating characteristic (ROC) curves of time-density curve (TDC) parameters for prediction of death among patients with lung cancer (Unite represents combined model integrating PT, PV, and CER).
| Parameters | AUC | SE | 95% CI | Cut-off Value | P | Sensitivity | Specificity |
|---|---|---|---|---|---|---|---|
| PT | 0.769 | 0.057 | 0.657 - 0.881 | 38.152s | < 0.001 | 0.788 | 0.820 |
| PV | 0.776 | 0.057 | 0.664 - 0.888 | 36.185Hu | < 0.001 | 0.792 | 0.815 |
| CER | 0.837 | 0.045 | 0.750 - 0.924 | 16.085% | < 0.001 | 0.805 | 0.839 |
| Combination | 0.919 | 0.030 | 0.860 - 0.977 | - | < 0.001 | 0.869 | 0.825 |
Abbreviations: AUC, area under the curve; PT, peak time; PV, peak value; CER, contrast enhancement ratio; CI, confidence interval; Hu, hounsfield unit; SE, standard error.
4.6. Kaplan-Meier Survival Analysis According to Time-Density Curve Parameters
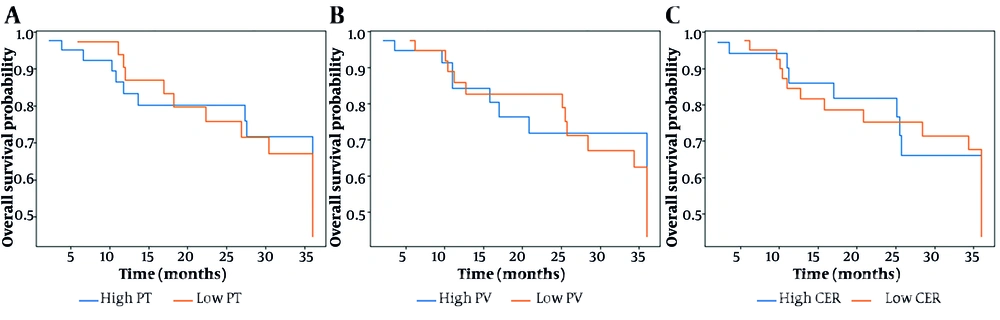
Kaplan-Meier survival curves of lung cancer patients stratified by (A) peak time (PT), (B) peak value (PV), and (C) contrast enhancement ratio (CER). Patients were divided into high and low groups according to the optimal cut-off values derived from receiver operating characteristic (ROC) curve analysis. Differences between groups were assessed using the log-rank test.
