
1. Background
Non-alcoholic fatty liver disease (NAFLD) has a worldwide prevalence of 25% among adults and is considered one of the main risk factors for liver failure, cirrhosis, and hepatocellular carcinoma (1, 2). This disease ranges from simple steatosis to advanced forms, including non-alcoholic steatohepatitis (NASH), cirrhosis, and NASH-related fibrosis (3). Severe fibrosis is observed in 7% to 49% of patients with NAFLD. Non-alcoholic fatty liver disease is associated with several factors, including obesity, lipid disorders, hyperglycemia, and hypertension (4). With the increasing prevalence of obesity in recent years, it is not unexpected that both the incidence of metabolic diseases, including NAFLD, and the severity of their clinical manifestations have increased (5).
In NAFLD, excessive lipid accumulation within hepatocytes results from dysregulation of lipid metabolism, characterized by enhanced systemic lipolysis, increased hepatic uptake of free fatty acids, augmented very low-density lipoprotein production, and impaired hepatic fatty acid oxidation and triglyceride export (6). Previous research has shown that risk factors for fibrosis include older age, low platelet count, a high AST/ALT ratio, and the presence of Mallory bodies (7). Given its clinical importance and high prevalence, NAFLD has become a major global health concern (8).
Uric acid is the main end product of purine metabolism, and serum uric acid levels are maintained by the balance between uric acid production and excretion (4). In recent years, the association between serum uric acid levels and metabolic syndrome has been repeatedly demonstrated, with serum uric acid often elevated in individuals with metabolic syndrome (9). Previous studies have shown that serum uric acid is an independent risk factor for cardiovascular disease. This process involves insulin resistance, which is considered an important risk factor for the development of NAFLD. Recent studies have also shown that elevated uric acid levels are independently associated with ultrasound-diagnosed NAFLD, regardless of insulin resistance (10). Therefore, hyperuricemia may also be associated with an increased risk of NAFLD (11).
Fibrosis is generally defined as the development of fibrous connective tissue in response to injury or inflammation (12). Fibrosis is recognized as the most important prognostic factor in NAFLD. The disease is largely asymptomatic, and liver biopsy remains the gold standard for accurate diagnosis of liver fibrosis. However, liver biopsy is invasive and is not suitable for screening. Consequently, various noninvasive diagnostic tools, mainly based on blood or other samples or imaging methods, have been developed or are under development (13).
As noted earlier, NAFLD encompasses a broad clinical spectrum, ranging from simple hepatic steatosis to NASH and progressive liver fibrosis. Approximately 20% of individuals with NAFLD progress to NASH within 3 to 7 years, and this form is associated with a higher risk of disease progression (14). However, given the complex and multifactorial pathogenesis of NASH, which is shaped by genetic, epigenetic, lifestyle, and dietary influences, it remains challenging to predict which patients will subsequently develop advanced fibrosis or cirrhosis. Among disease-related factors, the stage of liver fibrosis has emerged as the strongest predictor of liver-related mortality and extrahepatic comorbidities (14).
2. Objectives
Although several biomarkers have been examined for their association with fibrosis severity in NAFLD, the interplay between serum uric acid and HDL levels in this context remains insufficiently understood. Accordingly, the present study aimed to evaluate the relationship between HDL, serum uric acid, and UHR in patients with NAFLD-related liver fibrosis.
3. Methods
3.1. Study Design
This cross-sectional study was designed to examine the association between NAFLD, liver stiffness measured by transient elastography (FibroScan), and biochemical markers, including HDL cholesterol, uric acid, and UHR.
The study protocol was reviewed and approved by the Ethics Committee of Ahvaz Jundishapur University of Medical Sciences under ethical approval code IR.AJUMS.HGOLESTAN.REC.1403.067, ensuring adherence to ethical standards in study design, patient recruitment, and data confidentiality. The study was conducted over a 6-month period from May to October 2023.
3.2. Study Population
Eligible participants were patients with NAFLD who were referred to our medical center for FibroScan elastography assessment. Non-alcoholic fatty liver disease was defined as abnormal liver test results and imaging findings showing > 5% fat in hepatocytes, with or without fibrosis. Inclusion and exclusion criteria were defined according to current guidelines (4).
Patients were included if they met all of the following criteria:
- Abnormal liver function tests on two separate occasions within a 3- to 9-month interval
- Ultrasound-confirmed diagnosis of fatty liver
- Age 18 years or older
The exclusion criteria were as follows:
- Age younger than 18 years
- Chronic liver disease due to causes other than NAFLD, such as autoimmune hepatitis or viral hepatitis B or C
- Heart failure
- Use of medications known to induce hepatic steatosis or hepatotoxicity, including tamoxifen, nonsteroidal anti-inflammatory drugs, amiodarone, statins, and fibrates
- Unwillingness to participate in the study
All patients who fulfilled the inclusion criteria and none of the exclusion criteria were invited to participate.
3.3. Ethical Considerations
Before study initiation, all participants were fully informed about the objectives and procedures of the study. The confidentiality of personal and private information was strictly maintained, and participants were offered an explanation of their results upon request. Participation in the study was entirely voluntary and imposed no financial costs on the participants.
3.4. Sampling Method and Sample Selection Criteria
The primary objective of this study was to evaluate the association between UHR and liver stiffness measured by elastography using multivariable regression analysis. Therefore, sample size adequacy was assessed based on regression modeling requirements. According to the commonly accepted rule of at least 10 to 15 observations per predictor variable, the sample size would be considered sufficient with at least 70 participants for the planned adjusted analyses. However, because of time constraints and funding limitations, only 44 participants were included. Figure 1 shows the scatter plots and regression lines for the associations of HDL, uric acid, and UHR with elastography values.
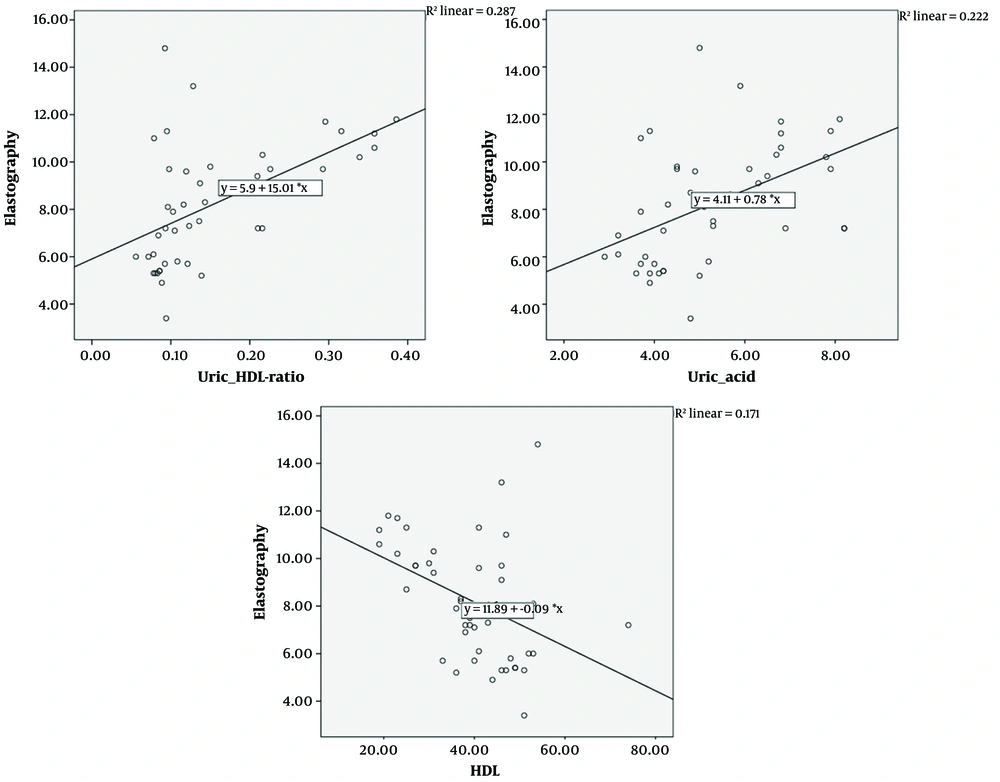
Figure 1.
Visualization of HDL, uric acid, and uric-HDL ratio (UHR) with elastography values using scatter plots and regression lines.
3.5. Data Collection
Transient elastography was performed in the FibroScan room by an experienced gastroenterologist who was blinded to laboratory data. Elastography was performed using an EchoSens 502 FibroScan device with a medium-sized probe manufactured in France, and values were recorded in kPa. Required information, including laboratory data, was extracted from patients' medical records.
Laboratory tests were measured after a 12-hour fasting state. High-density lipoprotein cholesterol and uric acid were recorded in mg/dL. Aspartate aminotransferase and ALT were recorded in U/L, and platelet counts were recorded as ×10³/µL. The AST/ALT ratio was calculated for all participants. The UHR was also calculated as the primary independent predictor. Laboratory and demographic data collected in this study are reported in Table 1.
Table 1.
Research Variables
| Variable name | Independent | Dependent | Quantitative | Continuous | Discrete | Practical definition | Scale |
|---|---|---|---|---|---|---|---|
| Uric acid | a | a | Serum uric acid | mg/dL | |||
| HDL | a | a | Blood lipids | mg/dL | |||
| Elastography rate | a | a | Inflammation of liver tissue | kPa | |||
| Age | a | a | Age in years | Relative | |||
| Gender | a | a | Sex | Relative | |||
| AST | a | a | Liver function test | U/L | |||
| ALT | a | a | Liver function test | U/L | |||
| PLT | a | a | Total blood platelet count | ×10³/µL |
Abbreviations: HDL, high-density lipoprotein; AST, aspartate aminotransferase; ALT, alanine aminotransferase; PLT, platelet.
a applicable variable characteristics.
3.6. Statistical Analysis
Quantitative variables were summarized as mean, standard deviation, minimum, and maximum, whereas qualitative variables were presented as frequency and percentage. The normality of continuous variables was assessed using the Shapiro-Wilk test. Homogeneity of variances was evaluated using Levene's test to verify the assumptions of parametric analyses, and linearity between continuous predictors and the dependent variable was examined using residual plots.
Associations between categorical variables were analyzed using the chi-square test or Fisher's exact test, as appropriate. Comparisons of continuous variables between two independent groups were conducted using the independent samples t test or, when assumptions of normality or homoscedasticity were violated, the non-parametric Mann-Whitney U test.
Univariable linear regression analyses were performed to assess associations between continuous variables. Subsequently, two multivariable generalized linear models were constructed to evaluate these relationships after adjustment for potential confounders. Model 1 was adjusted for basic characteristics, including age and sex, whereas Model 2 was adjusted for all included variables. Model assumptions, including normality of residuals, linearity, and homoscedasticity, were examined using residual diagnostics. To avoid multicollinearity, separate models were designed to evaluate the relationship between UHR and elastography, whereas another model evaluated the associations of uric acid and HDL with elastography.
4. Results
4.1. Baseline Characteristics
According to the information presented in Table 2, a total of 45 participants were recruited. One patient was excluded because of a withdrawal request; therefore, 44 patients were included in the statistical analysis. The average age of the study participants was 43.97 ± 7.65 years. Of the included participants, 23 (52.3%) were male and 21 (47.7%) were female. The youngest participant was 28 years old, and the oldest was 67 years old.
Table 2.
Description of Basic Characteristics of Participants a
| Variables | Values | Maximum | Minimum |
|---|---|---|---|
| Age | 43.97 ± 7.65 | 67 | 28 |
| Gender | |||
| Female | 21 (47.7) | ||
| Male | 23 (52.3) | ||
| Elastography rate | 8.21 ± 2.55 | 14.9 | 3.4 |
| HDL | 39.45 ± 11.34 | 74 | 19 |
| Uric acid | 5.25 ± 1.54 | 8.2 | 2.9 |
| Uric acid/HDL | 0.154 ± 0.091 | 0.39 | 0.06 |
| AST | 34.70 ± 18.72 | 93 | 11 |
| ALT | 42.43 ± 16.49 | 74 | 9 |
| AST/ALT | 0.847 | 1.89 | 0.4 |
| PLT | 234.13 ± 68.73 | 401 | 114 |
Abbreviations: HDL, high-density lipoprotein; AST, aspartate aminotransferase; ALT, alanine aminotransferase; PLT, platelet.
a Values are expressed as No. (%) or mean ± SD.
4.2. Univariable Analyses
In univariable comparisons, male participants had higher uric acid levels and lower HDL levels than female participants. Elastography values did not significantly differ by sex or age (P = 0.20 and P = 0.52, respectively). Uric acid, HDL, and UHR were significantly associated with elastography values. Uric acid (B = 0.78, SE = 0.226, P = 0.001) and UHR (B = 15.01, SE = 3.653, P = 0.001) were positively associated with elastography values, whereas HDL showed an inverse association (B = -0.093, SE = 0.032, P = 0.005). Elastography values were positively associated with AST, ALT, and the AST/ALT ratio (Table 3).
Table 3.
Association of Elastography and UHR with Basic Characteristics
| Variables | Elastography Rate a | P-Value | Uric Acid/HDL b | P-Value | Uric Acid a | P-Value | HDL a | P-Value |
|---|---|---|---|---|---|---|---|---|
| Sex | 0.20 | 0.001 | 0.003 | 0.011 | ||||
| Female | 7.69 ± 2.87 | 0.094 ± 0.05 | 4.56 ± 1.10 | 43.9 ± 8.01 | ||||
| Male | 8.69 ± 2.18 | 0.15 ± 0.19 | 5.88 ± 1.63 | 35.39 ± 12.53 | ||||
| Age | 0.029 ± 0.045 | 0.53 | 0.001 | 0.80 | 0.014 ± 0.027 | 0.61 | 0.156 ± 0.201 | 0.442 |
| Uric acid/HDL | 15.01 ± 3.653 | 0 .000 | - | - | - | - | - | - |
| Uric acid | 0.78 ± 0.226 | 0.001 | - | - | - | - | - | - |
| HDL | -0.093 ± 0.032 | 0.005 | - | - | - | - | - | - |
| AST | 0.074 ± 0.018 | 0 .000 | - | - | 0.047 ± 0.01 | 0.000 | -0.276 ± 0.083 | 0.002 |
| ALT | 0.069 ± 0.021 | 0.003 | - | - | 0.043 ± 0.013 | 0.002 | -0.32 ± 0.094 | 0.001 |
| Platelet | -0.014 ± 0.004 | 0.003 | - | - | -0.006 ± 0.003 | 0.06 | 0.085 ± 0.022 | 0.000 |
| AST/ALT | 2.457 ± 1.119 | 0.03 | 0.071 ± 0.041 | 0.086 | 1.386 ± 0.68 | 0.048 | -2.545 ± 5.23 | 0.629 |
Abbreviations: SE, standard error; HDL, high-density lipoprotein; AST, aspartate aminotransferase; ALT, alanine aminotransferase; PLT, platelet.
a Results are interpreted as mean and standard deviation for categorical variables and as B coefficient and standard error for continuous variables.
b Results are interpreted as median and interquartile range for categorical variables.
4.3. Generalized Linear Model
To examine the associations between biochemical markers and elastography values after adjustment for age and sex, generalized linear models were performed.
The UHR showed a significant positive association with elastography values in Model 1 (B = 15.707, SE = 4.164, P = 0.001). This indicates that each 1-unit increase in UHR corresponded to an average 15.7-unit increase in elastography values before adjustment for additional covariates.
Uric acid alone was also positively associated with elastography values in Model 1 (B = 0.608, SE = 0.266, P = 0.028). High-density lipoprotein cholesterol demonstrated an inverse relationship with elastography values, with lower HDL associated with higher elastography values, although this trend did not reach statistical significance in Model 1 (B = -0.066, SE = 0.036, P = 0.071) (Table 4).
Table 4.
Association Between Elastography Rate and UHR (Model 1), Uric Acid, and HDL (Model 2) Adjusted for Age and Sex
| Predictor | Model 1 B (Unstandardized) | Model 1 Std. Error | Model 1 P-Value | Model 1 95% CI | Model 2 B (Unstandardized) | Model 2 Std. Error | Model 2 P-Value | Model 2 95% CI |
|---|---|---|---|---|---|---|---|---|
| Age (y) | 0.024 | 0.039 | 0.548 | -0.056 to 0.103 | 0.061 | 0.040 | 0.132 | -0.019 to 0.142 |
| Uric-HDL ratio | 15.707 | 4.164 | 0.001 | 7.292 to 24.123 | 6.183 | 5.247 | 0.178 | -4.448 to 16.815 |
| Gender (male as baseline) | 0.312 | 0.754 | 0.681 | -1.211 to 1.836 | 0.442 | 0.768 | 0.568 | -1.114 to 1.998 |
| AST | - | - | - | - | 0.047 | 0.030 | 0.128 | -0.014 to 0.108 |
| ALT | - | - | - | - | 0.004 | 0.032 | 0.899 | -0.060 to 0.068 |
| PLT | - | - | - | - | -0.008 | 0.006 | 0.197 | -0.020 to 0.004 |
| Age (y) | 0.032 | 0.041 | 0.433 | -0.050 to 0.115 | 0.063 | 0.040 | 0.123 | -0.018 to 0.145 |
| HDL (mg/dL) | -0.066 | 0.036 | 0.071 | -0.138 to 0.006 | -0.27 | 0.036 | 0.463 | -0.101 to 0.047 |
| Uric acid (mg/dL) | 0.608 | 0.266 | 0.028 | 0.070 to 1.146 | 0.323 | 0.288 | 0.269 | -0.261 to 0.908 |
| Gender (male as baseline) | 0.416 | 0.783 | 0.598 | -1.168 to 2.000 | 0.585 | 0.781 | 0.459 | -1.00 to 2.169 |
| AST | - | - | - | - | 0.044 | 0.30 | 0.156 | -0.018 to 0.106 |
| ALT | - | - | - | - | 0.002 | 0.032 | 0.956 | -0.062 to 0.066 |
| PLT | - | - | - | - | -0.009 | 0.006 | 0.151 | -0.021 to 0.003 |
Abbreviations: HDL, high-density lipoprotein; AST, aspartate aminotransferase; ALT, alanine aminotransferase; PLT, platelet.
a Model summary: Model 1: R² = 0.296 (UHR), R² = 0.288 (uric acid and HDL); Model 2: R² = 0.434 (UHR), R² = 0.419 (uric acid and HDL).
5. Discussion
The present study investigated the associations of serum uric acid, HDL, and several clinical parameters, including elastography values, sex, platelet count, and the AST/ALT ratio, in patients with NAFLD. The findings revealed several significant associations, particularly between elastography values and uric acid, HDL, and UHR. Higher uric acid levels and lower HDL levels were associated with higher elastography values. This discussion explores the mechanisms underlying these associations, considering the metabolic and pathophysiological factors involved in NAFLD.
The significant association between elastography values and uric acid levels in patients with NAFLD highlights the link between liver stiffness and metabolic changes. Elastography is a noninvasive method used to measure liver stiffness, an indicator of liver fibrosis. In NAFLD, liver fibrosis results from chronic inflammation and fat accumulation, leading to progressive liver damage (15). Uric acid, a product of purine metabolism, is implicated in oxidative stress and inflammation, which are key elements of liver fibrosis in NAFLD (16). Elevated uric acid levels can stimulate the production of proinflammatory cytokines, promoting liver inflammation and fibrogenesis. This may explain the observed association between higher elastography readings and uric acid levels in this study. In addition, uric acid is known to induce endothelial dysfunction and activate hepatic stellate cells, which play an important role in the progression of liver fibrosis (17). In the liver, these cells are responsible for producing extracellular matrix components that contribute to liver stiffness and can be detected by elastography. Increased elastography values in patients with high uric acid levels suggest that uric acid may contribute to liver fibrosis, making it a potentially important biomarker in NAFLD progression.
The significant correlation observed between elastography values and HDL levels suggests that decreased HDL may be associated with increased liver stiffness in patients with NAFLD. High-density lipoprotein cholesterol plays a key role in cholesterol transport and has anti-inflammatory and antioxidant properties that protect against liver damage. In the context of NAFLD, low HDL levels may exacerbate liver inflammation and fat accumulation, thereby contributing to liver fibrosis (18). Low HDL levels are also associated with impaired reverse cholesterol transport, a process critical for maintaining liver health by preventing lipid accumulation in liver cells. This impairment may worsen liver stiffness, which could explain the association between low HDL levels and increased elastography values. In addition, HDL is known to regulate cytokine production in the liver, reducing proinflammatory markers that contribute to liver injury (19). When HDL levels are low, the liver may experience more severe inflammation, leading to increased fibrotic activity and higher elastography scores. This correlation between elastography and HDL reinforces the importance of lipid management in preventing fibrosis progression in NAFLD, where low HDL levels may act as both a consequence and a contributor to liver stiffness.
The inverse relationship between uric acid and HDL levels in relation to elastography values suggests a common feature in patients with metabolic syndrome and NAFLD (20). Uric acid is considered proinflammatory and is associated with oxidative stress, which can impair HDL function and reduce HDL cholesterol levels in the bloodstream (21). This relationship likely contributes to a proinflammatory state and worsens liver conditions by reducing the protective antioxidant and anti-inflammatory roles of HDL.
In our analysis, UHR was significantly associated with higher elastography values, indicating greater liver stiffness and more severe NAFLD. This finding is consistent with evidence from large population-based studies conducted in the United States and China, which demonstrated that higher UHR levels were associated with increased odds of NAFLD and greater severity of hepatic steatosis. Notably, those studies also reported that UHR showed superior predictive performance for NAFLD compared with uric acid or HDL alone, as assessed by the area under the receiver operating characteristic curve (22, 23). Together, these findings support the concept that UHR may be useful for predicting both the onset and severity of NAFLD and may better capture the combined metabolic and inflammatory burden relevant to NAFLD pathophysiology than either component alone.
In our analysis, the association between UHR and elastography values was attenuated and lost statistical significance after additional adjustment for AST and ALT. This finding can be interpreted in several ways. First, AST and ALT are not fully correlated with uric acid or HDL; therefore, they may not act as true confounders in the relationship between UHR and elastography. Second, AST and ALT are well-established markers of liver injury and are closely related to liver stiffness; adjusting for these variables may represent overadjustment, as they could lie on the causal pathway between metabolic dysregulation and liver fibrosis severity. Overadjustment in this context may obscure the true association of UHR with elastography values. Third, the relatively small sample size of the present study limits statistical power, and the inclusion of multiple covariates in the regression model may further reduce the ability to detect independent associations. A larger sample size would be required to support more extensive adjustment while maintaining adequate statistical power. In contrast to our findings, large population-based cohort studies have demonstrated that the association between UHR and NAFLD severity persists even after adjustment for AST and ALT, suggesting that the loss of significance observed in our study is likely related to limited sample size and reduced statistical power rather than the absence of a true biological association (23).
This study had several limitations. First, its cross-sectional design limits the ability to establish causal relationships between variables, as longitudinal associations between variables and outcomes were not assessed. Second, although elastography is a valuable noninvasive measure of liver stiffness, it does not provide comprehensive information about liver function or the presence of other liver-related pathologies. Third, uric acid and HDL levels are influenced by factors such as diet, physical activity, and alcohol consumption, which were not considered in this study. Without controlling for these variables, it is difficult to determine the independent effects of serum uric acid and HDL on liver stiffness in patients with NAFLD. Fourth, the study did not reach its targeted sample size. A large longitudinal study with adjusted analyses for a complete set of potential confounders would strengthen these findings.
This study demonstrates several important associations between metabolic and inflammatory markers in patients with NAFLD. Elastography values were significantly associated with uric acid and HDL levels, indicating that liver stiffness is linked to metabolic factors. The inverse association between uric acid and HDL emphasizes the pro-inflammatory role of uric acid and the protective effects of HDL in the liver. Furthermore, the correlation between the AST/ALT ratio and HDL emphasizes the link between liver injury and lipid metabolism. Increased uric acid was also associated with platelet count, indicating an inflammatory process that may worsen liver pathology. Overall, these findings emphasize the importance of managing lipid profiles and uric acid levels in NAFLD, where they may play a role in liver health and disease progression. Further research into these mechanisms could lead to better treatment strategies for patients with NAFLD.