
1. Background
Cancer treatment methods are evolving rapidly nowadays. One of the reasons for this swift-footed progress is the emergence of immune-based therapies to fight against cancer (1). The use of monoclonal antibodies (mAb) or adoptive cell therapies for antitumor purposes has gained a significant deal of attention because of their considerable potential in inducing remission in patients with relapsed/refractory (R/R) malignancies with rather manageable toxicity rates (2). The clinical and commercial success of mAbs began in 1986 with the approval of Orthoclone OKT3 by the US Food and Drug Administration (FDA) for kidney transplant rejection. To date, numerous mAbs have been approved by the responsible regulatory agencies in the US and Europe for distinctive immunological and oncological indications. Alongside conventional mAbs, several other treatment modalities have been introduced, which can be considered as derivatives of mAb therapies. Such therapies include antibody-drug conjugates (ADCs), immunotoxins, and chimeric antigen receptor (CAR) T cell therapies (1, 2).
So far, several immune-based therapeutics have been approved for the treatment of hematologic malignancies including R/R B-cell acute lymphoblastic leukemia (B-ALL), multiple myeloma (MM), mantle cell lymphoma (MCL), follicular lymphoma (FL), and diffuse large B-cell lymphoma (DLBCL) (1-3). Among different target antigens, CD19 has been regarded as one of the most suitable target antigens for the development of targeted therapeutics. Numerous CD19-based therapeutics, such as Loncastuximab tesirine, Blinatumomab, Inebilizumab, Tafasitamab, Tisagenlecleucel, Axicabtagene ciloleucel, and Lisocabtagene maraleucel have been approved for medical use against various hematologic indications, which supports the applicability of CD19 as suitable cancer immunotherapy target antigen (2, 4).
Cytotoxic T cells exert their cytolytic reactions through the secretion of perforin and granzyme. Since granzyme B (GrB) has important roles in the induction of apoptosis, it can be regarded as a suitable cytotoxic agent for the development of antibody conjugates for therapeutic purposes (5). In detail, in vitro studies have revealed that GrB is able to activate a series of caspases and promote cell apoptosis (6). On the other hand, the apoptosis induction capability of GrB has also been evidently linked to an unidentified mechanism, which is independent of the caspases (6). Following entrance into the nucleus, GrB causes DNA fragmentation and promotes the cleavage of those proteins important in the process of DNA repair (such as DNA-dependent protein kinases) (6). Moreover, owing to the human origin of GrB, its application in human subjects as a cytotoxic agent could not be intertwined with immunogenicity issues (5).
2. Objectives
In this study, we aimed to design a CD19-redirected antibody conjugate composed of a humanized single-chain variable fragment (scFv) and GrB using precise in silico techniques.
3. Methods
3.1. Granzyme B and scFv Sequences
The protein databank (https://www.rcsb.org/) was carefully searched for the crystalized structure of the human form of GrB. Moreover, since the administration of murine antibodies or any other animal-derived antibodies into human subjects might result in the production of neutralizing antibodies against that foreign entity and consequently lead to its elimination from the circulation, we selected a humanized version of the CD19-specific scFv FMC63 (hereafter referred to as HuFMC63 or concisely as Hu63). HuFMC63 was obtained from a paper by Qian et al., in which they successfully humanized FMC63 to increase its clinical applicability (7).
3.2. Three-Dimensional (3D) Structure Prediction and Analyses
The GalaxyWEB server (http://galaxy.seoklab.org/cgi-bin/submit.cgi?type = TBM) was employed for the prediction of the 3D structure of HuFMC63 and the desired antibody conjugates. After the server completed the modeling process, the best predicted model of HuFMC63 and the desired antibody conjugates were subjected to deep analysis using QMEANDisCo (https://swissmodel.expasy.org/qmean/) (8). Also, Ramachandran analysis of the 3D models was carried out using MolProbity (http://molprobity.biochem.duke.edu/). Since the recombinant conjugation of GrB to HuFMC63 could affect the structural conformation of the scFv to an unknown extent, we decided to use four different linker peptides for the fusion of GrB to HuFMC63. Our selected linker peptides included “GGGGSGGGGSGGGGS”, “AEAAAKEAAAKA”, “EGKSSGSGSESKST”, and “PTPPTTPT”, as represented in one-letter amino acid codes. To select the best linker peptide for the rest of the experiments, the best predicted 3D model of each antibody conjugate (referred to as Hu63-(G4S)3-GrB, Hu63-AEAAAKEAAAKA-GrB, Hu63-EGKSSGSGSESKST-GrB, and Hu63-PTPPTTPT-GrB, respectively) was superimposed with the 3D structure of GrB and HuFMC63. Since the 3D structure of GrB obtained from protein database was a dimer protein, we proceeded to manually eliminate one of the monomers alongside the other unfavorable molecules captured throughout the course of crystallization (GrB is functional as a monomer) (6). Furthermore, the root-mean-square deviation (RMSD) of each of these alignments were measured using UCSF Chimera software, and the linker peptide with the least RMSD was selected for the next steps. This means that the selected linker peptide would have the least negative effect on the structural conformation of GrB and HuFMC63, and hence the least negative effect on their functionality. In detail, RMSD is a scale for measuring the average distance between the backbone atoms of two aligned protein structures (9). For visualization of the desired 3D models, we used PyMOL Molecular Graphics System, Version 2.3.2 Schrödinger, LLC software.
3.3. Structural Improvement Through Energy Minimization
Any given experiment could face errors, and the prediction of structural conformation of proteins is no exception. As a routine of in silico studies, predicted 3D models are subject to energy minimization to achieve a more energetically stable model for further experiments. For this goal, the selected antibody conjugate model was subjected to the steepest descent minimization using Chimera software. In detail, 10,000 steps (with 0.02 Å step size), which were followed by 1,000 steps of conjugate gradient minimization (with 0.02 Å step size), were considered for this process as the atom fixation option was set to “none”. Owing to the privileges of the steepest descent minimization technique, the obtained structure is deemed to be as free of severe clashes as possible.
3.4. Structural Flexibility
The structural flexibility of the selected antibody conjugate was evaluated using the CABSflex server (http://biocomp.chem.uw.edu.pl/CABSflex2) (10). This step makes sure that the recombinant conjugation of HuFMC63 to GrB via the most favorable linker peptide would have no negative effects on the 3D structure of either of the proteins.
3.5. Characterization
The physicochemical properties of the selected antibody conjugate were assessed using ProtParam (http://web.expasy.org/protparam/). Moreover, the solubility profile of the selected antibody conjugate was also compared with that of HuFMC63 and GrB to predict whether the recombinant conjugation could have negative effects on the solubility of each of the building blocks. The ccSol omics (http://service.tartaglialab.com/update_submission/361300/448985149d) was utilized to carry out this step. Additionally, the melting temperature (Tm) of HuFMC63, GrB, and the selected antibody conjugate was predicted by Tm Predictor (http://tm.life.nthu.edu.tw/index.htm) to evaluate what effects their recombinant conjugation could bear on their Tm as a single construct.
3.6. Binding Efficacy to CD19
Since the main aim of this study was to design a recombinant antibody conjugate for the selective targeting and elimination of CD19-positive malignant cells, the final construct should be able to target CD19 in the same orientation and affinity as those of HuFMC63. To assess these qualities, HuFMC63 and the selected antibody conjugate were separately docked to CD19. The sequence of CD19 was obtained from UniProt (https://www.uniprot.org/uniprot/P15391) under the accession number P15391. Next, the extracellular domain of the antigen, which was from residue 20 to 291, was used for predicting the 3D structure of CD19. GalaxyWEB was used for this aim, and the best predicted model was used for the docking process. HDOCK (http://hdock.phys.hust.edu.cn/) was employed for this goal (11). In the next step, the most favorable output of the docking step was fed to the PRODIGY server (https://wenmr.science.uu.nl/prodigy) to predict the binding affinity (ΔG) and dissociation constant (KD) between the selected antibody conjugate and CD19, as well as between HuFMC63 and CD19 (12). Additionally, the amino acids that contributed to the binding of the selected antibody conjugate to CD19 were visualized through the generation of a two-dimensional (2D) interaction plot using LigPlot+ software (version 2.2) (13).
4. Results
4.1. GrB and HuFMC63 Sequences
The crystalized structure of GrB was retrieved from the protein databank under the accession number 1FQ3 and its amino acid sequence was confirmed with the GrB sequence in UniProt (https://www.uniprot.org/uniprot/P10144), which is under the accession number P10144. Figure 1A and B represent the amino acid sequences of HuFMC63 and GrB, respectively.
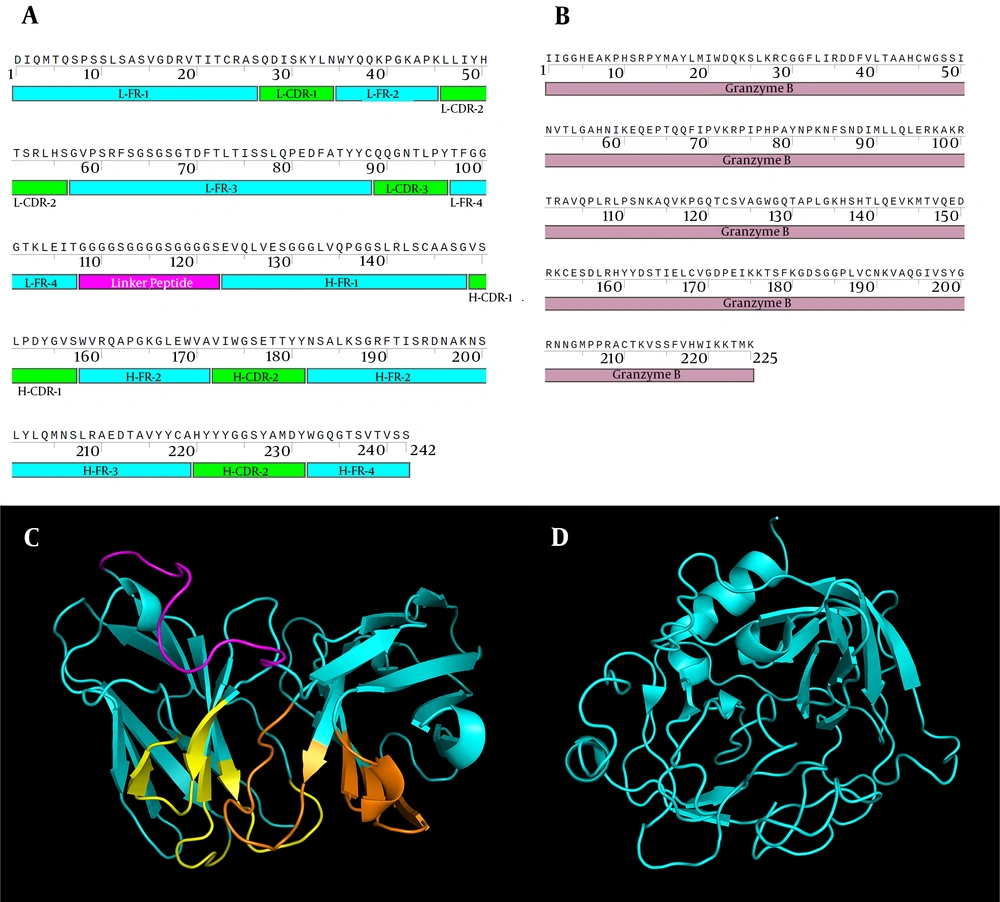
Figure 1.
The amino acid sequences and the 3D structure of HuFMC63 and GrB. A and B, The amino acid sequence of HuFMC63 and GrB, respectively; C and D, The 3D structure of HuFMC63 and GrB, respectively. The framework regions of HuFMC63 are represented in cyan, the CDRs of the light and heavy chain in yellow and orange, respectively, and the (G4S)3 linker peptide in magenta. L, light chain; H, heavy chain; FR, framework region; CDR, complementarity-determining regions.
4.2. The 3D Structure of HuFMC63, GrB, and the Antibody Conjugates
According to the results of the Ramachandran plot analysis and QMEANDisCo, the 3D models predicted by GalaxyWEB were of high structural quality (Table 1). Therefore, these outputs were used for the rest of the experiments. Figure 1C and D represents the 3D structure of HuFMC63 and GrB (monomeric), respectively. Moreover, since four different linker peptides were utilized to recombinantly link HuFMC63 to GrB, the decision of which linker peptide to proceed with was based on the magnitude of the RMSD of HuFMC63 and GrB while aligned with each antibody conjugate. In detail, the RMSD of HuFMC63 and GrB while aligned with Hu63-(G4S)3-GrB, Hu63-AEAAAKEAAAKA-GrB, Hu63-EGKSSGSGSESKST-GrB, and Hu63-PTPPTTPT-GrB were measured as 0.191 and 0.661, 0.217 and 0.650, 0.253 and 0.648, and 0.211 and 0.659 Å, respectively (Figure 2). Based on these measurements, the (G4S)3 linker induced the least structural changes on HuFMC63, and hence the least functionality impairment. Considering the effects of the linker peptides on the structure of GrB, since all four linkers induced almost similar effects based on the measured RMSD, the selection of the most favorable linker was based on its effect on HuFMC63 and its degree of flexibility. In this regard, the (G4S)3 linker peptide and its corresponding antibody conjugate, Hu63-(G4S)3-GrB, were selected for the further steps.
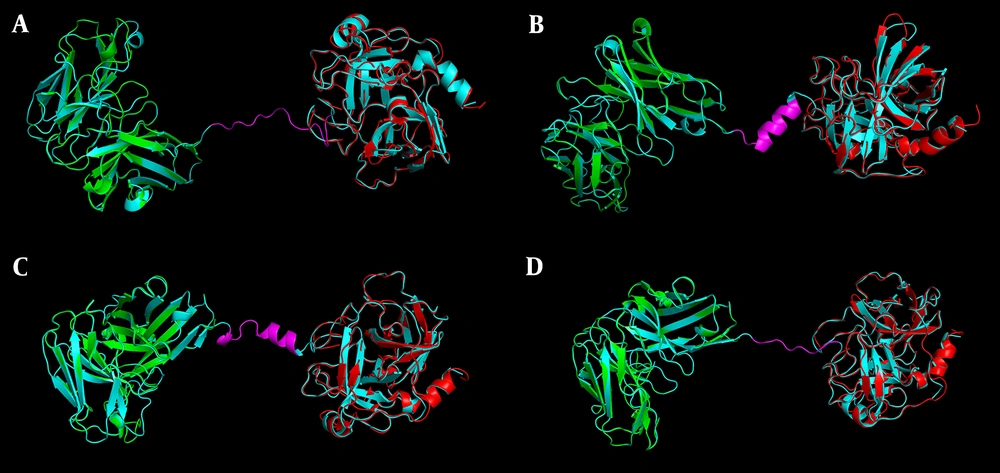
Figure 2.
A, B, C, and D, The superimposed structures of Hu63-(G4S)3-GrB, Hu63-AEAAAKEAAAKA-GrB, Hu63-EGKSSGSGSESKST-GrB, and Hu63-PTPPTTPT-GrB, respectively, as aligned with their building components, HuFMC63 and GrB. The antibody conjugates are represented in cyan with their different linker peptides in magenta, HuFMC63 in green, and GrB in red.
Table 1.
The Structural Evaluation of the Best 3D Models Predicted by GalaxyWEB
| HuFMC63 | Hu63-(G4S)3-GrB | Hu63-AEAAAKEAAAKA-GrB | Hu63-EGKSSGSGSESKST-GrB | Hu63-PTPPTTPT-GrB | |
|---|---|---|---|---|---|
| QMEANDisco | 0.76 ± 0.05 | 0.78 ± 0.05 | 0.77 ± 0.05 | 0.77 ± 0.05 | 0.78 ± 0.05 |
| Residues in favored regions (residue proportion) | 94.6% (227/240) | 95.2% (457/480) | 95.2% (454/477) | 95.8% (459/479) | 94.3% (446/473) |
| Residues in allowed regions (residue proportion) | 97.5% (234/240) | 98.8% (474/480) | 99.6% (475/477) | 99.0% (474/479) | 98.3% (465/473) |
| Residues in outlier regions (residue proportion) | 2.50% (6/240) | 1.25% (6/480) | 0.42% (2/477) | 1.04% (5/479) | 1.69% (8/473) |
4.3. Energy Minimization and Structural Flexibility
After the completion of the energy minimization process, the structurally refined model of Hu63-(G4S)3-GrB showed an RMSD of 0.549 Å while superimposed with the native 3D model of Hu63-(G4S)3-GrB. This demonstrates that minor structural improvements were made to the 3D model of Hu63-(G4S)3-GrB to relieve the unfavorable clashes. This 3D model was used for the further steps. Furthermore, according to the results obtained from CABSflex (Figure 3), the residues of HuFMC63 and GrB did not undergo a high degree of flexibility; therefore, their recombinant conjugation should not impinge on the structural integrity. On the other hand, as it is evident from the RMSF plot and the ten superimposed 3D models (Figure 3), the residues corresponding to the glycine-serine linker peptide showed a high degree of flexibility (~6 Å), which is the main characteristic of our desired linker peptide.
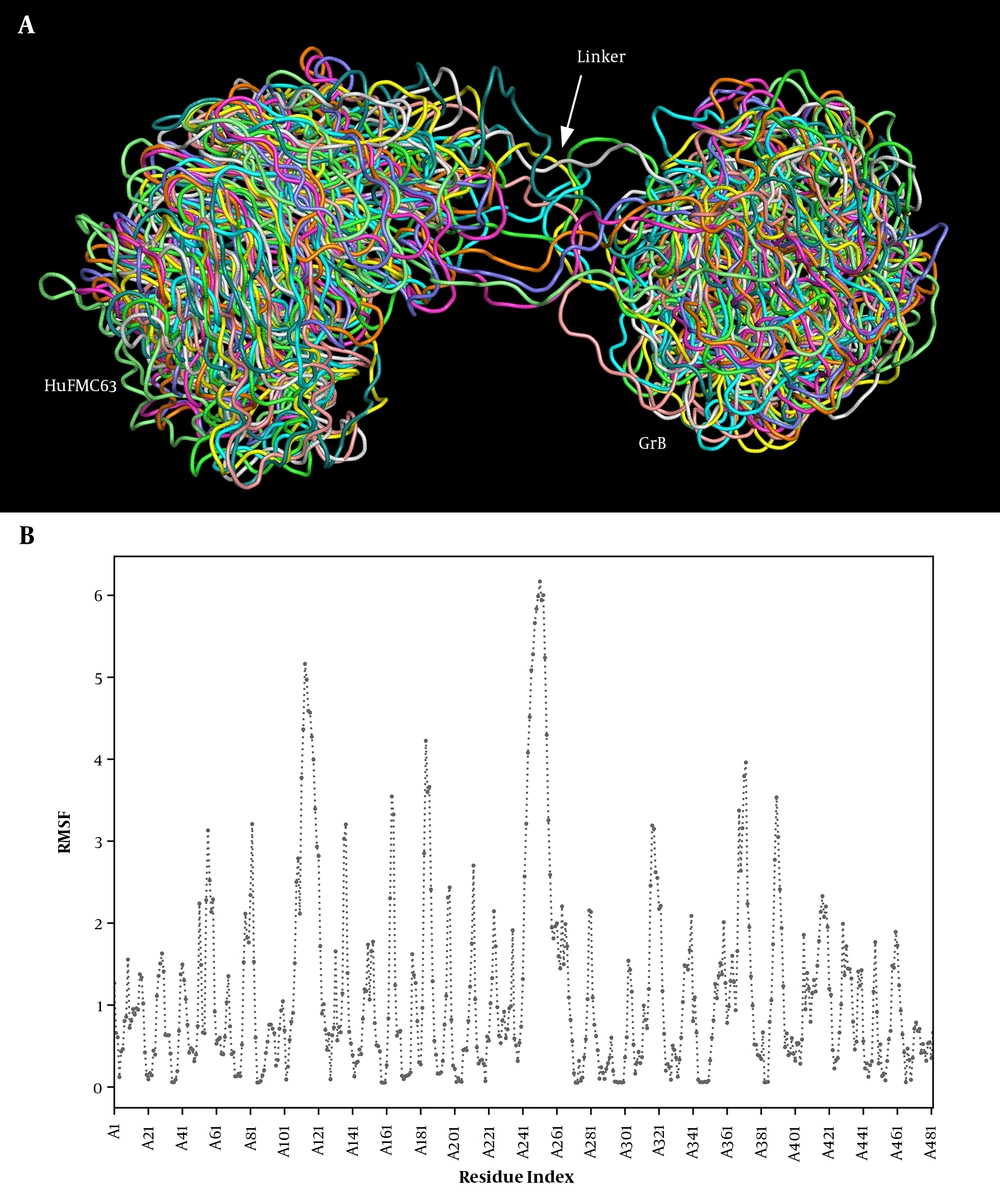
Figure 3.
The flexibility simulation of Hu63-(G4S)3-GrB. A, The ribbon mode superimposition of the ten simulated structure of Hu63-(G4S)3-GrB achieved after the completion of the simulation run with each 3D model represented in a different color; B, The RMSF (Å) plot of Hu63-(G4S)3-GrB in relation to the residue numbers of the construct.
4.4. Hu63-(G4S)3-GrB Characterization
In reference to the physicochemical properties of Hu63-(G4S)3-GrB as predicted by ProtParam, the theoretical pI and molecular weight of Hu63-(G4S)3-GrB were predicted as 9.25 and ~51.7 kDa, respectively. Moreover, the estimated half-life of Hu63-(G4S)3-GrB in mammalian reticulocytes (in vitro), yeast (in vivo), and Escherichia coli (in vivo) were predicted as 1.1 hours, 3 minutes, and > 10 hours, respectively. Additionally, the aliphatic index and the grand average of hydropathicity (GRAVY) of Hu63-(G4S)3-GrB were predicted as 66.95 and -0.429, respectively. The prediction of the solubility profile of HuFMC63, GrB, and Hu63-(G4S)3-GrB indicated 60, 60, and 98% solubility propensity, respectively. This means that Hu63-(G4S)3-GrB might have a more solubility probability than each of its components alone. According to the results of TM predictor, the TM index of HuFMC63, GrB, and Hu63-(G4S)3-GrB were predicted as 1.3760198444599, 1.8870942346767, and 1.8458337666773, respectively. In detail, the Tm of any given protein whose TM index is more than 1 is predicted to be > 65°C.
4.5. The Binding Capacity of Hu63-(G4S)3-GrB to CD19
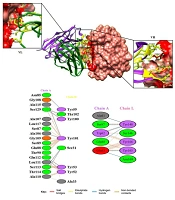
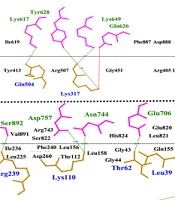
Based on the docking results, Hu63-(G4S)3-GrB binds CD19 exactly in the same orientation of that of HuFMC63 (Figures 4A - D). This means that the recombinant conjugation of HuFMC63 to GrB does not impinge on its ability to recognize its specific epitope on CD19. Moreover, the ΔG and KD of HuFMC63 and Hu63-(G4S)3-GrB as docked to CD19 were predicted by the PRODIGY server at 25.0°C and 37.0°C. At both temperatures, HuFMC63 and Hu63-(G4S)3-GrB bound CD19 with a ΔG of -10.6 kcal.mol-1. Moreover, the KD values of HuFMC63 and Hu63-(G4S)3-GrB bound CD19 at these temperatures were the same, as they were predicted as 17 and 33 nM, respectively. This slight increase in the value of KD could be taken as a slight decrease in the affinity of the scFv to CD19 when the environmental temperature increases from 25.0°C to 37.0°C. Furthermore, according to the results of the 2D interaction plot (Figure 4E), all of the Hu63-(G4S)3-GrB residues that contributed to its binding to CD19 correspond to those in the complementarity-determining regions (CDRs) of the scFv.
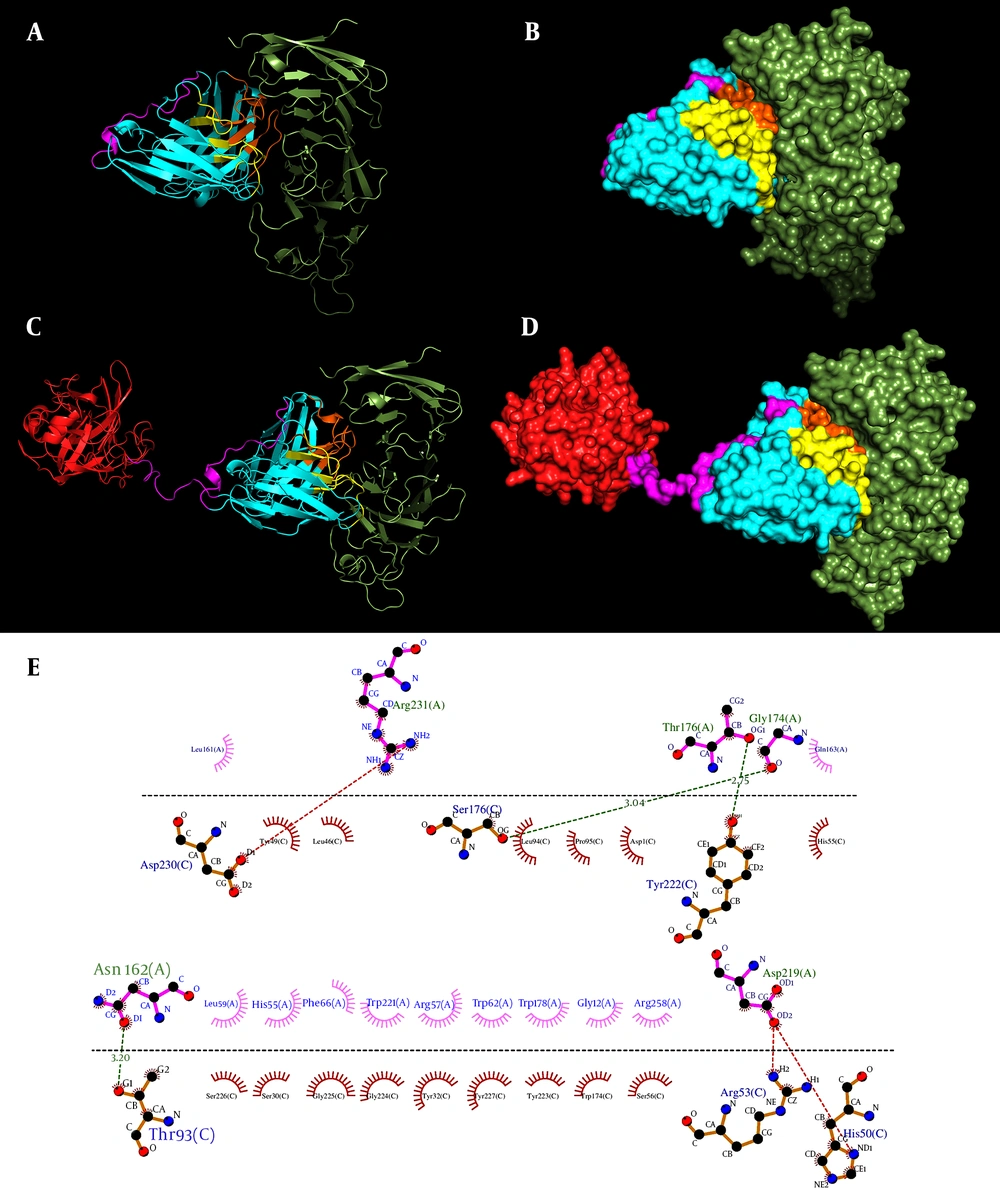
Figure 4.
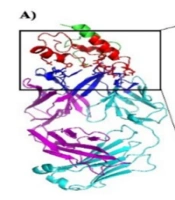
The docking process of HuFMC63 and Hu63-(G4S)3-GrB to CD19. A and B, The docking of HuFMC63 to CD19 in ribbon mode and surface mode, respectively; C and D, The docking of Hu63-(G4S)3-GrB to CD19 in ribbon mode and surface mode, respectively. CD19 is represented in smudge, the scFv framework regions in cyan, the light and heavy complementarity-determining regions (CDRs) in yellow and orange, respectively, GrB in red, the (G4S)3 linker peptide in magenta; E, The 2D interaction plot of Hu63-(G4S)3-GrB as docked to CD19. The residues of Hu63-(G4S)3-GrB and CD19 that contribute to the binding of the scFv to the antigen are positioned below and above the horizontal dashed lines, respectively.
5. Discussion
Cancer immunotherapy has revolutionized the treatment of patients with CD19-associated malignancies, including B-ALL, MCL, DLBCL, and FL (2). However, there is still room for the development of innovative treatment modalities that, in comparison with the FDA-approved adoptive cell therapies, are sometimes more affordable. In this study, we successfully designed an antibody conjugate (named Hu63-(G4S)3-GrB) that might be introduced as a therapeutic against CD19-associated malignancies after careful preclinical (in vitro and in vivo) and clinical investigations. One of the supremacies of Hu63-(G4S)3-GrB over other similar therapeutic platforms is the usage of GrB as its cytotoxic agent. Various similar studies have used bacterial or plant-based toxins as their desired cytotoxic agents (14). However, a proportion of patients with hematologic malignancies with high disease burden require more than a single round of drug infusion to achieve complete remission. This occurrence reveals one of the downsides of toxin-based therapeutics such as immunotoxins. In detail, repeated rounds of immunotoxin infusion results in the production of neutralizing antibodies against the foreign toxins (such as Pseudomonas aeruginosa toxin A or ricin) (14). This results in the rapid elimination of the immunotoxin from the patient’s circulation; therefore, an alternative treatment should be considered (14). In the case of Hu63-(G4S)3-GrB, such events do not occur owing to the human origin of the cytotoxic agent, GrB, and the humanized scFv. Moreover, the targeting fragment of Hu63-(G4S)3-GrB, HuFMC63, has already been used in other treatment modalities, such as CAR T cells, that have been approved by the US FDA for several CD19-associated malignancies (1, 7). This might further accelerate the clinical investigation and vouch for the safety and clinical applicability of Hu63-(G4S)3-GrB. Moreover, according to Qian et al. (7), CAR T cells equipped with HuFMC63 exerted the same tumoricidal activity as CAR T cells equipped with FMC63 in a xenograft model of lymphoma. Furthermore, according to the results of our study, Hu63-(G4S)3-GrB also showed a slight affinity decrease, which can be negligible, notwithstanding the fact that detailed in vitro experiments (such as ELISA or surface plasmon resonance) are required to determine the exact affinity of Hu63-(G4S)3-GrB to CD19. Also, Hu63-(G4S)3-GrB might be more soluble than HuFMC63 and GrB, unconjugated. This can be beneficial in the prospective clinical settings since Hu63-(G4S)3-GrB is aimed for intravenous administration to target CD19-positive malignant cells in the circulation.
5.1. Conclusions
In this study, we utilized precise in silico approaches to design an antibody conjugate, named Hu63-(G4S)3-GrB, for the selective elimination of CD19-positive malignant cells. Our results anticipated that the recombinant conjugation of HuFMC63 to GrB could not negatively impact the structural conformation of either of the proteins; however, future studies should assess their functionality in vitro. This means that Hu63-(G4S)3-GrB might be considered as a potent immunotherapeutic for the treatment of patients with CD19-positive malignancies. However, only after the necessary preclinical assessments have been carefully carried out, Hu63-(G4S)3-GrB can be fully investigated in clinical trials. Future studies could focus on the in vitro assessments of Hu63-(G4S)3-GrB to investigate whether the conjugate format could bind CD19 with a similar affinity as that of HuFMC63. Moreover, in vivo assessments could be conducted to evaluate the therapeutic efficacy and safety profile of Hu63-(G4S)3-GrB in cell line-established and patient-derived xenograft models.