
1. Background
Rabies is a fatal viral disease that primarily affects mammals, including humans, by targeting the nervous system. This pathogenesis is characterized by the virus's remarkable ability to evade host immune surveillance. Following a bite, the rabies virus (RABV) often replicates locally in muscle tissue before entering peripheral nerves and traveling retrograde towards the central nervous system (CNS), an immune-privileged site where it can cause devastating encephalitis before an effective immune response can be mounted (1). Transmission typically occurs through the saliva of infected animals via bites or scratches. The virus's interaction with the host's innate immune system at the wound site is a critical determinant of infection outcome, with RABV encoding proteins that can actively suppress early interferon responses, thereby facilitating its silent entry into the nervous system (2).
Immediate medical intervention following exposure, especially from wild or unfamiliar animals, is critical to prevent disease onset. This intervention, known as post-exposure prophylaxis (PEP), is a classic example of immunotherapy and active immunization working in concert. PEP involves thorough wound cleansing, administration of rabies immunoglobulin (RIG) to provide immediate passive immunity at the exposure site, and a series of inactivated RABV vaccinations to stimulate the patient's adaptive immune system. The primary goal is to induce a robust titer of rabies virus-neutralizing antibodies (RVNAs) before the virus can reach the CNS, as these antibodies are the established correlate of protection (3). The risk of contracting rabies, combined with injuries from animal bites and the disease’s near-universal fatality once symptoms manifest, represents a significant public health challenge. To eliminate rabies, healthcare systems must enhance their prevention and management strategies (3).
The COVID-19 pandemic has profoundly impacted global health, economics, social structures, and daily living, resulting in severe disruptions and livelihood threats (4-6). Early in the pandemic, resources were reallocated to prioritize COVID-19 detection and treatment, jeopardizing a decade of progress against other diseases, including rabies (7). This crisis also created a unique immunological landscape. The widespread immune activation and potential immune modulation caused by SARS-CoV-2 infection or COVID-19 vaccination raised theoretical concerns about possible interference with the immunogenicity of concurrent vaccines, including rabies, highlighting a critical area of investigation at the intersection of virology, immunology, and pharmacology (4). This crisis has underscored the importance of sustainable disease control methods and reinforced the necessity of understanding the complex interactions between humans, animals, and the environment. Gathering robust epidemiological data on animal bites in humans is crucial for effective rabies surveillance, resource distribution, and improving health outcomes for both populations, particularly in developing countries where surveillance is hindered by underreporting and misdiagnosis (6, 8-10).
Time series analysis offers a powerful tool to assess healthcare delivery by tracking error patterns, evaluating intervention outcomes at the population level, and simultaneously investigating intended and unintended effects (6, 11, 12). Using this approach, we analyzed PEP cases for animal bites treated at the Anti-Rabies Clinic from April 2016 to March 2023.
The COVID-19 pandemic significantly altered animal bite trends in Razavi Khorasan, with initial lockdowns reducing cases, followed by a sharp increase as restrictions eased. This study identifies key demographic shifts and geographic patterns, highlighting the pandemic’s indirect effects on human-animal interactions. These findings emphasize the need for a One Health approach to rabies prevention, focusing on responsible pet ownership, community engagement, and improved public health strategies to mitigate future outbreaks.
2. Objectives
The objective was to compare actual and projected cases during the COVID-19 pandemic period. The findings will inform the development of enhanced rabies prevention and control guidelines at Razavi Khorasan province.
3. Methods
3.1. Geographic Context and Data Sources for Animal Bite Incidents
Between April 2016 and March 2023, all individuals with animal bite injuries who presented to the Canter Control Health Rabies in Razavi Khorasan province, Iran, were included in this retrospective observational study. As all cases reported to the center during the study period were analyzed, no specific inclusion or exclusion criteria were applied.
Each patient's demographic information was collected, including age, sex, occupation, and location. The information was used to identify potential risk factors and patterns in animal bite incidents.
3.2. Statistical Analysis
Seasonal Autoregressive Integrated Moving Average (SARIMA) was constructed based on the monthly occurrence of cases during the study period. A SARIMA model consists of seven parameters, including (p,d,q), (P,D,Q), and s, where p is the number of autoregressive terms, d indicates the number of differences, q indicates the number of moving averages, P indicates the number of seasonal autoregressive terms, D indicates the number of seasonal differences or integrations, Q indicates the number of seasonal moving averages, and s indicates the length of the seasonal periods (s = 12 months in this study). To fit the model, the following steps were taken:
The first step was to assess stationarity in the variance using a diagram of the disease trend and the Box-Cox test. The number of animal bite cases in the model was transformed if there was non-stationarity in the variance. To test stationarity in the means of the series, we used the Dicky-Fuller test. First-order seasonal differencing (D = 1) with a period of 12 was used to remove the seasonality trend. All further analyses were conducted on stationary data.
The next step was to determine the parameters of the model AR (p, P) and MA (q, Q) using autocorrelation function (ACF) plots. In order to select the best and most parsimonious univariate model, different SARIMA models were compared using the likelihood ratio test. In order to evaluate the goodness-of-fit of the final model, we used the Ljung-Box (Q) test for residuals to determine if they are white noise, i.e., mean = 0 and constant variance (13-15).
The number of cases under "normal" circumstances occurring from March 2020 to March 2023 was based on the number of cases from April 2016 to February 2020, regressed with a 95% prediction interval: Excess cases = Reported cases - Expected cases.
The number of excess cases gives us a sense of scale, but it is less comparable across time, regions, and population subgroups. In order to make these comparisons, it is easier to compare reported cases with projected cases. This metric is called the P-score and we calculate it as follows: P-score = (Reported cases - Expected cases) / (Expected cases) × 100.
When the observed number of cases falls below the baseline, the P-score can be negative. A yearly P-score is calculated by averaging 12 months' P-scores (15). All analyses were done with Stata14 software (StataCorp, College Station, TX, USA).
4. Results
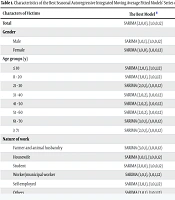
In the periods April 2016 - February 2020 and March 2020 - March 2023, Razavi Khorasan province reported 36,277 and 40,324 dog bite incidents, with 69,898 (91.25%) being bites by dogs. Table 1 shows the goodness-of-fit evaluation of the models using the Ljung-Box (Q) test and AIC. For each series of animal bite incidents between April 2016 and February 2020, best fit models were developed and forecasted between March 2020 and March 2023, regressed with a 95% prediction interval and compared with reported cases using the P-scores given in Table 2.
Table 1.
Characteristics of the Best Seasonal Autoregressive Integrated Moving Average Fitted Models’ Series of Animal Bite Victims from April 2016 to February 2020
| Characters of Victims | The Best Model a | Ljung-Box (Q) Test (P-Value) b | ALC |
|---|---|---|---|
| Total | SARIMA (2,0,0), (1,0,0,12) | 0.52 | 208 |
| Gender | |||
| Male | SARIMA (1,0,1), (1,0,0,12) | 0.43 | 211 |
| Female | SARIMA (1,0,0), (1,0,0,12) | 056 | 265 |
| Age groups (y) | |||
| ≤ 10 | SARIMA (2,0,1), (1,0,1,12) | 0.80 | 192 |
| 11 - 20 | SARIMA (3,0,1), (1,0,1,12) | 0.88 | 209 |
| 21 - 30 | SARIMA (2,0,1), (1,0,0,12) | 0.49 | 243 |
| 31 - 40 | SARIMA (2,0,2), (1,0,0,12) | 0.99 | 187 |
| 41 - 50 | SARIMA (2,0,2), (1,0,0,12) | 0.47 | 305 |
| 51 - 60 | SARIMA (2,0,2), (1,0,0,12) | 0.56 | 218 |
| 61 - 70 | SARIMA (3,0,1), (1,0,0,12) | 0.68 | 310 |
| ≥ 71 | SARIMA (2,0,1), (1,0,0,12) | 0.81 | 268 |
| Nature of work | |||
| Farmer and animal husbandry | SARIMA (3,0,1), (1,0,0,12) | 0.91 | 318 |
| Housewife | SARIMA (1,0,1), (1,0,0,12) | 0.32 | 286 |
| Student | SARIMA (2,0,0), (1,0,0,12) | 0.40 | 328 |
| Worker/municipal worker | SARIMA (1,0,1), (1,0,1,12) | 0.57 | 353 |
| Self-employed | SARIMA (2,0,1), (1,0,1,12) | 0.58 | 217 |
| Others | SARIMA (3,0,1), (1,0,1,12) | 0.54 | 293 |
| Habitat of the victims | |||
| Rural | SARIMA (3,0,1), (1,0,1,12) | 0.84 | 197 |
| Semi-urban | SARIMA (3,0,1), (1,0,1,12) | 0.76 | 245 |
| Urban | SARIMA (3,0,2), (1,0,0,12) | 0.16 | 302 |
Abbreviations: ALC, Akaike criterion; SARIMA, Seasonal Autoregressive Integrated Moving Average.
a SARIMA (p, d, q), (P, D, Q, s).
b The portmanteau test for residuals white noise.
Table 2.
Patterns of Animal Bite Victims Reported Versus Projected and P-Scores from April 2016 to March 2023 a
| Cause of Victims | 2016 - 2019 | 2020 - 2021 | 2021 - 2022 | 2022 - 2023 | ||||||||
|---|---|---|---|---|---|---|---|---|---|---|---|---|
| Reported Cases | Predicted Cases | P-Score | Reported Cases | Predicted Cases | P-Score | Reported Cases | Predicted Cases | P-Score | Reported Cases | Predicted Cases | P-Score | |
| Total | 36277 | 36299.68 (24370.05 - 48029.32) | 0.21 | 10898 | 11480.83 (6811.80 - 16149.86) | -5.07 | 13086 | 10046.29 (4807.09 - 15285.48) | 30.25 | 16340 | 10560.7 (4862.97 - 16258.44 ( | 54.72 |
| Gender | ||||||||||||
| Male | 26872 | 26880.85 (17780.97 - 35980.73) | 0.01 | 8801 | 8629.05 (4968.88 - 12289.23) | 0.27 | 10221 | 7334.16 (3316.07 - 11352.26) | 36.25 | 12315 | 7859.07 (3504.87 - 12213.27) | 53.79 |
| Female | 6725 | 6709.09 (3826.22 - 9591.96) | 0.09 | 2068 | 2026.70 (1301.25 - 2752.15) | 0.37 | 2865 | 1830.11 (1104.66 - 2555.56) | 51.68 | 4025 | 1934.48 (1148.57 - 2720.39) | 99.07 |
| Age groups (y) | ||||||||||||
| ≤ 10 | 5427 | 5491.26 (3126.39 - 7856.13) | -0.02 | 1530 | 1426.37 (598.59 - 2254.14) | -0. 20 | 2085 | 1331.32 (436.70 - 2225.93) | 0.09 | 2569 | 1475.10 (481.70 - 2468.50) | 0.12 |
| 11 - 20 | 6184 | 6131.68 | 0.53 | 1997 | 2106.99 (1372.63 - 2841.34) | -7.39 | 2470 | 2171.07 (1064.67 - 3057.46) | 11.78 | 2880 | 2248.11 (973.28 - 3262.94) | 26.80 |
| 21 - 30 | 7523 | 7479.15 (5091 - 9866.64) | 0.58 | 1980 | 2415.89 (1553.76 - 3278.01) | -0.19 | 2191 | 2178.75 (1208.69 - 3148.82) | -1.48 | 2703 | 2274.34 (1206.8 - 3341.88) | 16.64 |
| 31 - 40 | 6780 | 6659.57 (4165.12 - 9154.01) | 1.77 | 2179 | 2439.94 (1621.16 - 3258.73) | -10.21 | 2497 | 2294.77 (1245.79 - 3343.74) | 5.50 | 3167 | 2331.28 (1074.93 - 3587.63) | 12.07 |
| 41 - 50 | 4200 | 4199.43 (2426.68 - 5972.18) | 0.14 | 1372 | 1283.01 (630.37 - 1935.64) | 7.30 | 1643 | 1118.3 (422.11 - 1814.47) | 42.08 | 2121 | 1207.51 (453.29 - 1961.72) | 70.79 |
| 51 - 60 | 3360 | 3368.92 (1877.75 - 4860.1) | -.58 | 1028 | 950.56 (475.08 - 1426.04) | 8.19 | 1202 | 860.61 (351.51 - 1369.71) | 12.78 | 1555 | 910.874 (356.15 - 1465.59) | 14.00 |
| 61 - 70 | 1817 | 1815.14 (820.30 - 2809.97) | -0.31 | 546 | 526.08 (213.22 - 838.93) | 4.12 | 685 | 481.45 (153.0 - 809.91) | 16.12 | 926 | 516.84 (160.87 - 872.82) | 37.81 |
| ≥ 71 | 985 | 983.05 (408.45 - 1557.66) | 0.13 | 265 | 265.95 (95.90 - 436.0) | 3.46 | 311 | 254.95 (81.28 - 428.61) | 20.77 | 419 | 275.02 (86.85 - 463.19) | 43.38 |
| Nature of work | ||||||||||||
| Farmer and animal husbandry | 4703 | 4731 | -0.32 | 1462 | 1503.33 (756.77 - 2240.88) | -4.08 | 1290 | 1291.15 (510.80 - 2071.50) | -0.51 | 1200 | 1264.73 (483.78 - 2045.68) | -3.86 |
| Housewife | 3961 | 3951.06 (2194.9 - 5707.23) | 0.25 | 1128 | 1152.17 (636.30 - 1668.02) | -1.10 | 1415 | 1039.62 (465.02 - 1614.22) | 30.25 | 1931 | 1114.12 (488.46 - 1739.77) | 67.75 |
| Student | 6824 | 6782 (4303.93 - 9262.72) | 0.55 | 2412 | 2311.98 (1446.96 - 3177.0) | 1.41 | 3151 | 2108.9 (1061.67 - 3156.13) | 47.27 | 3799 | 2173.15 (985.56 - 3360.74) | 69.30 |
| Worker/municipal worker | 193 | 463.09 (0 - 464.13) | 0.72 | 76 | 149.28 (22.61 - 188.13) | 9.08 | 169 | 189.70 (0 - 183.10) | 16.00 | 241 | 225.12 (0 - 194.60) | 11.54 |
| Self-employed | 8909 | 8772.16 (5351.9 - 12192.4) | 1.47 | 3098 | 2921.37 (1801.38 - 4041.35) | 4.5 | 3764 | 2697.74 (1446.1 - 343.32) | 36.37 | 5133 | 2758.94 (1370.88 - 4145.99) | 81.09 |
| Others | 2016 | 2018.73 (993.57 - 3043.87) | -.022 | 686 | 6339.56 (339.86 - 939.26) | 8.51 | 797 | 580.61 (263.94 - 897.27) | 17.95 | 876 | 606.21 (260.93 - 951.5) | 14.65 |
| Habitat of the victims | ||||||||||||
| Rural | 14272 | 14290.6 (9579.8 - 19001.4) | -0.22 | 4389 | 4419.97 (2518.58 - 6321.36) | -1.19 | 4931 | 3896.98 (1822.19 - 5971.77) | 5.39 | 5500 | 4129.94 (1872.31 - 6387.57) | 9.37 |
| Semi-urban | 3180 | 3169.49 (1381.99 - 4956.99) | 0.34 | 1166 | 848.26 (221.39 - 1475.13) | 14.25 | 1338 | 810.79 (141.86 - 1479.72) | 32.31 | 1468 | 878.92 (154.05 - 1603.8) | 34.11 |
| Urban | 13627 | 13568.6 (7943.89 - 19193.4) | 0.45 | 4193 | 3985.28 (2271.72 - 5698.84) | 4.41 | 5854 | 3789.83 (1981.3 - 5598.37) | 52.97 | 7837 | 3903.89 (1919.13 - 5888.65) | 91.14 |
a Values are expressed as confidence intervals.
In Table 2, the trends of animal bites are shown based on the demographic characteristics of the victims. From March 2020 to March 2023, there has been a clear increase in the number of all cases. However, victims' characteristics experienced varying changes. It was found that an exponential increase in animal bites occurred in the first year of the COVID outbreak and continued in the second year. In the last two years, women were about twice as vulnerable as men.
The age was broken down into 10-year intervals. P-scores for ages 0 - 10 are more stable from March 2020 to 2023. The P-score for animal bites in ages 11 - 20 dropped in 2020, but in 2021 and 2022 it sharply increased. As well as in 2020, the P-score of animal bites among ages 11 - 20 and 31 - 40 dropped, but rose sharply in 2021 and 2022. P-scores for animal bites in ages 21 - 30 declined in 2020 and 2021, but spiked in 2022. P-scores for animal bites in ages 41 and over have increased in the current three consecutive years, especially in the elderly.
Those who work with animals, such as veterinarians, animal control workers, and laboratory personnel, are considered at risk of contracting rabies. According to the findings of this study, the risk of animal bites changed over time in different kinds of work. As compared to earlier times, P-scoring of animal bites in farmers and animal husbandry decreased from March 2020 to 2023. In 2020, the P-score of animal bites in housekeepers declined, but in 2021 and 2022, it soared. Over the past two years, students have also increased their P-scores for animal bites. Additionally, this event has increased for the last three consecutive years in workers/municipal workers. The report noted that self-employment was one of the more sensible jobs, especially in the last year. There were increases in P-scores for other categories of jobs as well.
It also illustrates the local distribution of animal bite victims. In rural areas, this event decreased in the first year of the outbreak, but slightly increased two years later. Throughout the current three continuous years, animal bite victims have increased in both semi-urban and urban areas. However, people in urban areas have experienced worse conditions.
5. Discussion
This study examines the patterns of animal bite incidents spanning from April 2016 to March 2023, emphasizing notable differences before and during the COVID-19 pandemic by applying optimized predictive models tailored to each victim category. Dog bites constituted over 90% of new reported cases at the Anti-Rabies Clinic, consistent with findings from previous research indicating that trends in overall animal bite incidents largely reflect dog bite occurrences (16, 17).
From an immunological and pharmacological perspective, each animal bite represents a potential exposure event that demands a rapid and effective medical countermeasure: PEP. A pronounced downturn in bite cases was observed during the initial year of the COVID-19 outbreak, primarily due to government-imposed lockdowns limiting human mobility. However, this reduction may also reflect diminished access to these critical anti-rabies services amid broader disruptions in healthcare provision (5, 18, 19). This disruption has profound implications, as delays in administering PEP critically narrow the window of opportunity to prevent the fatal neuroinvasion of the RABV (1).
The subsequent resurgence in bite incidences as restrictions eased placed renewed strain on PEP delivery systems. The efficacy of this regimen relies on a two-pronged immunological strategy: The immediate provision of passive immunity via RIG to neutralize the virus at the wound site, and the induction of active, long-lasting immunity through a series of vaccinations that stimulate the production of RVNAs (3). The pandemic raised critical questions about potential immune interference; widespread SARS-CoV-2 infection and vaccination created a unique immunological landscape, with theoretical concerns that the systemic immune activation or dysregulation could alter the immunogenicity of concurrent vaccines (4). As restrictions eased, there was a moderate to sharp resurgence in bite incidences over the next two years, likely driven by increased movement and other pandemic-related factors, coupled with a rising dog population.
According to our study, the age, gender, region, and occupation of the victims clearly changed over time. The high-risk groups shifted towards children, women, the elderly, and urban areas and occupations that had lower statistics in the past. These transitions likely result from complex interactions involving changes in human and animal behavior, environmental conditions, healthcare access, and socio-economic factors during the pandemic. Notably, pet ownership — especially of dogs and cats — increased markedly during this period (20). Despite the upward trend in animal bites and escalating pet populations, studies specifically addressing this issue remain limited.
The COVID-19 pandemic has profoundly influenced both human and animal health (21), indirectly impacting veterinary services and disease control efforts due to economic instability and movement restrictions (12, 22). Coronaviruses can infect a range of animal species, including livestock and companion animals, causing respiratory and gastrointestinal disease, though there is no direct evidence linking infection to increased biting behavior (23-26).
Several factors may explain the observed rise in animal attacks during the pandemic. Stress induced by public health measures altered dog behavior, elevating bite risk, particularly amid lockdown conditions (22). Behavioral studies reported increased anxiety and attachment behaviors in dogs during the pandemic period, although results on interventions to mitigate these effects were inconclusive (23). Additionally, pathogen-induced sickness behavior in animals and humans — manifesting as sleep disturbances, anorexia, and cognitive impairment — could contribute to elevated aggression (23, 25).
Moreover, social distancing and movement restrictions have intensified emotional and economic stress within households, potentially amplifying family violence and indirectly affecting animal behavior (19, 26-28). Dogs, sensitive to their owners' emotional states, may respond to increased household tension with heightened aggression or biting incidents (26).
While most evidence regarding pandemic-related changes in animal bite epidemiology originates from countries with distinct cultural contexts, Iran has experienced a substantial rise in pet ownership, especially dogs and cats, although official data are scarce. This growth, while beneficial in some respects, raises concerns about zoonotic disease risks due to gaps in owner knowledge about appropriate pet care and hygiene, potentially increasing bite incidents and disease transmission.
The study provides valuable insight into how the COVID-19 pandemic influenced animal bite incidents, but certain limitations must be acknowledged. Since the research relied on data from a single health facility, it may not fully capture broader regional trends. A more extensive dataset covering multiple healthcare centers would offer a more comprehensive perspective. Furthermore, while the study suggests an indirect link between the pandemic and shifts in bite patterns, isolating specific causal factors remains challenging due to the complex interaction between human behavior, animal dynamics, and environmental influences. Additionally, although the findings indicate that the pandemic affected bite trends, definitive proof of causation is lacking, as local policies and socioeconomic conditions may have also contributed to observed changes.
Despite these limitations, the study has several notable strengths. The application of time-series analysis provides a rigorous method for evaluating patterns and trends in bite incidents over time. One of the key contributions is the identification of demographic and geographic shifts in bite cases, underscoring the pandemic’s broader implications on human-animal interactions. The research further highlights the necessity of considering indirect pandemic effects when shaping public health interventions. To address the multifaceted challenges posed by zoonotic diseases, the study reinforces the importance of a multi-sectoral One Health approach, emphasizing responsible pet ownership, community engagement, and collaborative efforts across health sectors.
In conclusion, our findings highlight significant demographic and behavioral shifts in animal bite victims, but more fundamentally, they reveal the fragility of our immunological defenses against a fatal zoonosis during a global crisis. The observed fluctuations in bite cases are not merely epidemiological curiosities; they directly reflect the population's exposure risk and the healthcare system's capacity to deliver a time-sensitive, life-saving immunological intervention. This underscores the urgent need for resilient prevention strategies, robust community education on PEP, and policies that ensure uninterrupted access to essential vaccines and immunoglobulins. Adopting a One Health framework — integrating human, animal, and environmental health perspectives — is crucial for the effective control of rabies and related zoonoses in this evolving context.