
1. Introduction
Gastric cancer (GC), a malignancy of the gastrointestinal system, is one of the principal contributors to cancer-related morbidity and mortality in Iran (1). Recent data estimate the mortality burden of GC in this region at approximately 8,000 cases per year. Therefore, identifying the molecular mechanisms and related targets involved in gastric tumor invasion and metastasis is important (2, 3). Early screening is also essential for improving the prognosis of GC (4).
Gastric cancer is characterized by the loss of glands and specialized cells in the stomach and remains a leading cause of cancer-related death worldwide (5). It can be diagnosed by histological examination of gastric biopsy specimens, measurement of maximal gastric acid production, or measurement of serum or plasma concentrations of proteins released by gastric cells (6). Pepsinogen, a proteinase mainly secreted by gastric cells, is divided into two main types: pepsinogen 1 (PG1) and pepsinogen 2 (PG2) (7). Serum PG1 is considered a functional index of gastric mucosal changes, including atrophic changes and inflammation, such as inflammation caused by H. pylori infection (8). Serum levels of PG1 and PG2 increase with the severity of gastric inflammation caused by H. pylori infection (9). However, serum PG1 levels decrease because of atrophic changes and loss of gastric cells, while serum PG2 levels remain constant or increase; therefore, the PG1/PG2 ratio decreases and is related to the severity of atrophy (10). A decreased PG1/PG2 ratio has been reported in many pathological gastric conditions, such as intestinal atrophy and atrophic gastritis, which are precancerous lesions of the stomach (11).
Many case-control and cohort studies have shown that serum PG levels have prognostic and screening value in GC (12, 13). However, few studies have evaluated the value of detecting pepsinogen gene expression as a marker for screening and early detection of gastric cancer. Therefore, the present study included patients with stomach cancer admitted to Dezful Grand Hospital from 2019 to 2021. We investigated PG gene expression in the tissues of patients with gastric cancer and healthy individuals. This study aimed to analyze the value of this gene in the screening, diagnosis, and evaluation of gastric cancer.
2. Methods
2.1. Ethics Statement
The study was conducted in accordance with the principles of the Declaration of Helsinki. All procedures were performed according to the ethical guidelines of the Faculty of Medical Sciences, Dezful University of Medical Sciences (IR.DUMS.REC.1396.15). All study participants received a full explanation of the study and provided written informed consent before inclusion.
2.2. Study Population
This cross-sectional study was conducted in the gastroenterology department of Dezful Hospital, Khuzestan, Iran. From March 2019 to March 2021, the GC case group and the gastric atrophy group were selected with the greatest possible similarity and homogeneity in demographic characteristics. According to previous studies in other regions, the number of GC patients in Dezful is limited, and the application of inclusion and exclusion criteria further reduced this number. Based on the central limit theorem, the minimum sample size in each group should be 20 individuals to maintain a normal distribution. Therefore, the census method was used to determine the sample size, and a total of 60 consecutive hospitalized patients with upper gastrointestinal symptoms were examined. The CONSORT diagram of the recruited subjects is shown in Figure 1. Exclusion criteria were as follows: (1) use of H2-receptor blockers or other drugs that could affect test results during the previous 2 weeks, or antibiotic use during the previous 1 month; (2) severe comorbidities, such as liver, kidney, nervous system, or heart dysfunction; (3) active upper gastrointestinal bleeding; and (4) a history of gastrointestinal surgery for gastric cancer, esophageal cancer, or gastric adenoma.
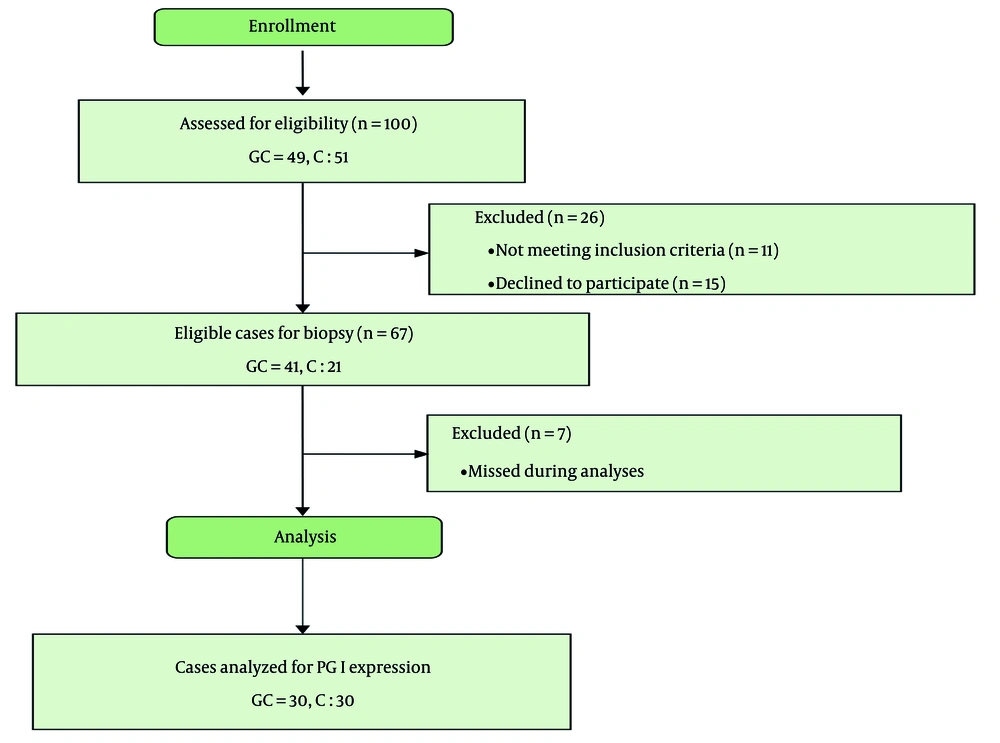
Figure 1.
The CONSORT diagram of the study shows the workflow (GC: Gastric cancer; C: Control).
2.3. Sampling of Stomach Tissue by Endoscopic Method
Gastric biopsy samples were obtained by a gastroenterology specialist using the reference method with special standard forceps (Therapeutic Video Gastroscope, Olympus GIF-Q160; Olympus Optical, Tokyo, Japan). For all tissue samples isolated from cancer patients, 1 tumor sample and 1 healthy sample were collected. Endoscopy patients from whom tissue samples were obtained, but in whom gastric cancer and gastric atrophy were not confirmed, were used as the control group.
2.4. RNA Extraction Steps
A GeneAll kit (GeneAll Biotechnology, Seoul, South Korea) was used for RNA extraction in this study. In brief, 100 mg of the examined tissue was homogenized using an ultrasonic device. Then, 1 mL of RiboExTM lysing solution was added to the lysed tissue, and after homogenization, the solution was kept at room temperature for 5 minutes. It was then centrifuged in a refrigerated centrifuge for 10 minutes at 12,000 g. Next, 200 µL of chloroform was added, and the solution was centrifuged at 4°C and 12,000 g for 15 minutes. Then, 700 µL of the supernatant was centrifuged at room temperature at 12,000 g for 30 seconds. To remove interfering particles and buffer liquid, centrifugation was repeated at room temperature at 12,000 g for 60 seconds. The mini-spin column was then transferred to a new microtube, and 60 µL of RNase-free water was added and kept at room temperature for 1 minute. The extracted RNA was stored at -70°C until cDNA synthesis.
2.5. cDNA Synthesis Method
Complementary DNA (cDNA) was synthesized from 1 µg of total RNA using the PrimeScript-RT Kit (Bioneer, Denmark) according to the manufacturer's protocol and stored at -20°C. In the kit, OligodT Primer, Random Primer, PrimeScript RT Enzyme, and 5X 1st Strand Synthesis Buffer were provided as lyophilized powder in separate strips ready for sample addition. Samples were added to each strip and then brought to a final volume of 10 µL with RNase-free and DNase-free water.
The materials in the microtube were mixed on ice and incubated at 37°C for 30 seconds. The resulting mixture was then incubated at 48°C for 4 minutes to synthesize the cDNA product. It was subsequently incubated at 55°C for 30 seconds and then at 95°C for 5 minutes to inactivate the enzyme. The resulting cDNA product was used for real-time PCR.
2.6. Real-time PCR Reaction Method
Expression analysis of target genes was performed by SYBR Green-based quantitative PCR in 20 µL reactions using Ampliqon SYBR Green Master Mix (Ampliqon, Denmark). For each run, a single master mix was prepared on ice, containing, per reaction, 10 µL of 2X SYBR Green Master Mix, 0.4 µL of forward primer (10 pmol/µL), 0.4 µL of reverse primer (10 pmol/µL), and nuclease-free water to a final volume of 18 µL. The master mix was gently vortexed, briefly centrifuged, and aliquoted into 0.2 mL PCR tubes (two technical replicates per sample plus a no-template control).
Critically, cDNA was added after the primers and master mix had been dispensed. Two microliters of diluted cDNA (corresponding to approximately 50 ng total RNA input) were pipetted into each aliquot, bringing the final reaction volume to 20 µL. Tubes were sealed, lightly vortexed, and spun down to eliminate bubbles.
Amplification was performed on a LightCycler 96 (Roche Life Science, Germany) under the following cycling conditions: 95°C for 5 minutes; 40 cycles of 95°C for 15 seconds and 60°C for 30 seconds, with fluorescence acquisition at 510 nm during each extension step (excitation, 470 nm). Specificity was confirmed by melt-curve analysis (65°C - 95°C, 0.1°C/s); a single sharp peak indicated the absence of nonspecific products or primer dimers.
2.7. Data Analysis Method
SPSS version 20 software was used for statistical analysis. Gene expression was analyzed using indicators such as mean and standard deviation. To compare the expression ratio of the mentioned gene between the 2 groups, data distribution was assessed using the Kolmogorov-Smirnov test. According to the distribution of the results, parametric and nonparametric tests (Mann-Whitney and Student t-test) were used. Because the data were abnormal, the Mann-Whitney test was used to compare the cancerous tissue group and the adjacent healthy tissue group. A P-value < 0.05 was considered statistically significant.
3. Results
3.1. Patients
The characteristics of the examined population were assessed based on the estimation of pepsinogen (PG) antibodies. In this assessment, 60 individuals were eligible for the study. The subjects were selected to have comparable demographic characteristics. The study group consisted of 33 men and 27 women, aged between 29 and 65 years. To compare the number of men and women in the 2 groups, the chi-square test was performed, and no significant difference was observed (P = 0.835). In addition, the t-test was used to compare the age of individuals in the study groups (P = 0.157). Therefore, sex and age were not intervention factors in this study. Finally, the patients were divided into 2 groups of 30 individuals: gastric atrophy and gastric cancer (Table 1).
Table 1.
Descriptive Data of People in Different Study Groups
| Variables | Gastric Cancer Group (n = 30) | Control Group (n = 30) |
|---|---|---|
| Sex | ||
| Male | 14 | 11 |
| Female | 16 | 19 |
| Age (y) | ||
| > 29 | 14 | 8 |
| 35 - 50 | 16 | 18 |
| > 50 | 7 | 3 |
3.2. Checking the Purity and Concentration of the Extracted Samples
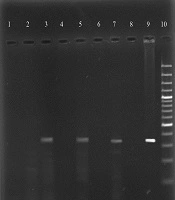
In this study, changes in PG1 gene expression were investigated using the real-time PCR technique in 2 groups: cancerous tissue and adjacent healthy tissue. The purity and concentration of extracted RNA were measured using a NanoDrop device, and the RNA product was also checked by 1% agarose gel electrophoresis. An example of the NanoDrop results is shown in.
3.3. Checking the Quality of the Primer
To assess primer quality, different dilutions of 1, 0.1, and 0.01 were prepared from the cDNA obtained for each gene, and a standard curve was drawn. The slope and efficiency results of the primers are shown in Table 2. Primers were designed and adjusted for exon-exon junctions in the mRNA sequences of target genes. Primer sequences showed that no interfering secondary structures, such as hairpin loops, primer dimers, or protruding loops, could be formed under the reaction conditions. The gradient of the standard curve of PCR results for GAPDH and PG1 genes was approximately -3.3250 and -3.4250, respectively. The efficiency for GAPDH/PG1 was calculated as 2 and 1.95, respectively. The results showed that the designed primers were of high quality. Table 3 shows the primer sequences used in the final qRT-PCR reaction.
Table 2.
Slope, R2, and Efficiency Results of Primers Based on 1, 0.1, and 0.01 Dilutions of cDNA
| Amplicon Name | Slope | Efficiency | R2 |
|---|---|---|---|
| GAPDH | -3.3250 | 2 | 1 |
| PG1 | -3.4250 | 1.95 | 0.98 |
Table 3.
Characteristics of Primers Used in qRT-PCR Reaction
3.4. PG1 Gene Expression Changes
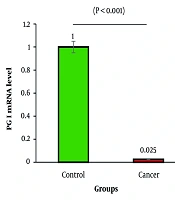
According to the Kolmogorov-Smirnov test, fold-change values related to PG1 gene expression had a non-normal distribution. Changes in PG1 gene expression were compared between groups. The results indicated that PG1 gene expression in the cancer tissue group was significantly lower than that in the control group (P < 0.001) (Figure 2).
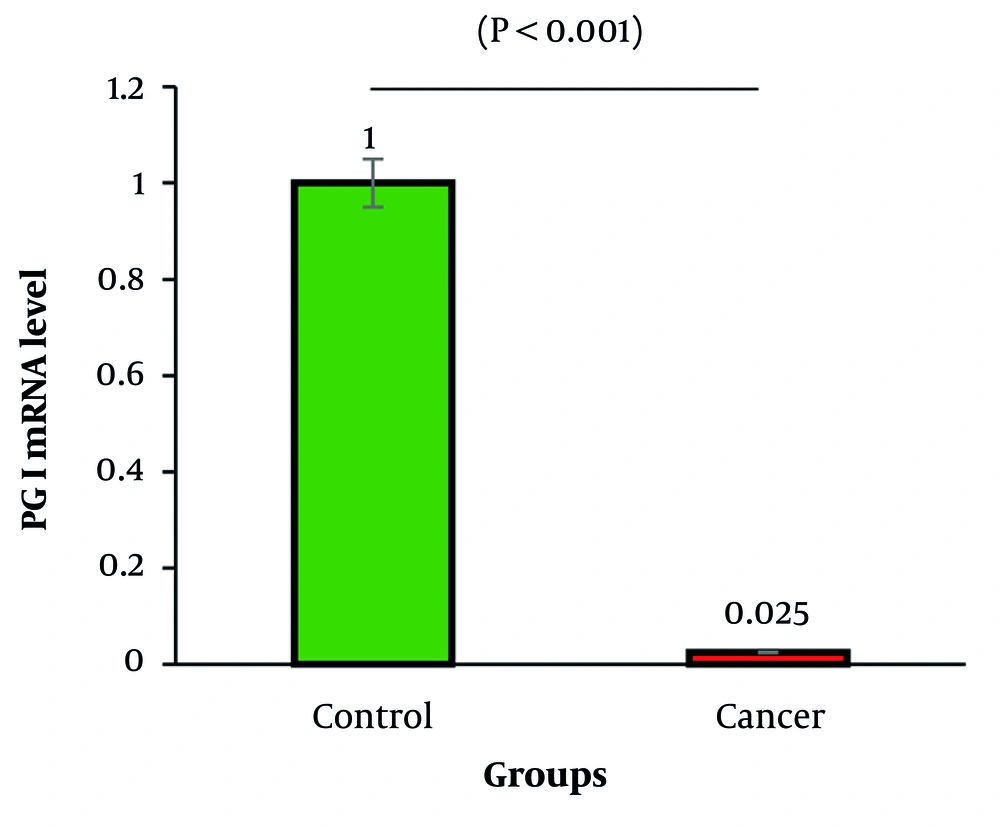
Figure 2.
Diagram of PG1 gene expression changes in cancerous and healthy tissue. The Mann-Whitney U test was applied for pairwise comparisons between groups. A P-value < 0.05 was considered statistically significant.
3.5. Technical Precision and Quality Control of the qPCR Assay
To evaluate the reproducibility of PGI gene expression measurements over time, 20 cancer tissue samples were analyzed over five consecutive days using real-time PCR. The coefficient of variation (CV%) and the mean ± standard deviation (SD) of Ct values were calculated for each day.
As shown in Table 4, the CVs for PGI Ct values ranged from 1.67% to 4.32% across the five-day period, all below the commonly accepted threshold of 5% for high-precision qPCR assays (15). The highest CV was observed on Day 1 (4.32%), likely reflecting initial instrument stabilization, whereas the lowest variability occurred on Day 5 (1.67%; mean Ct = 25.45 ± 0.45). Overall, Ct values remained stable (mean range, 25.45 - 27.78), confirming minimal technical drift.
These findings confirm that PGI expression measurements were highly consistent over time, and the low CV values (all below 5%) reflect the robustness of the qPCR protocol and RNA quality. The minimal day-to-day variation reinforces the reliability of PGI expression data for downstream comparative and diagnostic analyses (Table 4).
These results demonstrate the high technical precision of the qPCR protocol and the integrity of RNA preparations. The low inter-day CVs validate that the observed differences in PGI expression between tumor and control tissues (Section 3.2) reflect true biological variation rather than assay artifacts. This quality control assessment strengthens confidence in the comparative gene expression data presented herein.
Table 4.
Checking the Accuracy and Reproducibility of the Studied Genes
| Gene | Mean ± Standard Deviation | Coefficient of Variation |
|---|---|---|
| PGI | ||
| Day 1 | 26.04 ± 0.89 | 4.29 |
| Day 2 | 26.89 ± 1.20 | 3.45 |
| Day 3 | 27.78 ± 0.89 | 3.32 |
| Day 4 | 26.09 ± 0.95 | 3.34 |
| Day 5 | 25.45 ± 0.45 | 1.67 |
4. Discussion
Gastric cancer remains a major global health hazard, ranking fifth in incidence and third in cancer-related mortality worldwide (16, 17). Although the overall trend of GC has been declining globally, it continues to impose a heavy burden in high-risk areas, including Iran, where it reaches 12.6 per 100,000 population in parts of some provinces (18). Late presentation is the primary driver of poor local 5-year survival (19), underscoring the need for noninvasive biomarkers that can be used before symptoms appear.
Serum pepsinogen testing, especially the PGI/PGII ratio, is already used in some Asian screening programs, but its response during the emergence of malignancy is variable (20). Several large cohort and case-control studies conducted in Japan, China, and the United States have found absolute increases in circulating PGI levels or a relative reduction in the PGI/PGII ratio in cases of GC compared with gastritis controls (21). In contrast, studies of PGI transcription in resected tumors have consistently shown that PGI mRNA is downregulated (22). This apparent paradox may be biologically plausible because the lack of chief-cell differentiation in tumors lowers transcription, whereas exudation of pre-existing zymogen into the blood, stimulated in part by regional Helicobacter pylori prevalence and changes in acid output, can increase circulating protein. Clarifying this tissue-serum dichotomy is essential before PGI can be included in multistep diagnostic clinical algorithms (23).
The absence of PG1-producing chief cells indicates more than a histological change associated with atrophy; ultimately, it reflects substantial disruption of gastric mucosal immunity and tissue homeostasis (24). PG1 is secreted by chief cells and supports a tolerogenic yet immunocompetent immune environment through tightly regulated secretion of proteolytic enzymes and maintenance of epithelial barrier integrity (25). The loss of PG1-producing chief cells during the Correa cascade (chronic gastritis → atrophy → intestinal metaplasia) corresponds to a transition from controlled antimicrobial inflammation to a protumorigenic immune environment (26).
Downregulation of PG1 is associated with decreased expression of immune regulatory mediators (ie, TGF-β and IL-10) that would normally be secreted by the differentiated gastric epithelium, as well as infiltration of immunosuppressive cell populations, including M2-polarized macrophages, regulatory T cells (Tregs), and myeloid-derived suppressor cells (MDSCs) (27, 28). This imbalance between protective inflammation and tissue repair establishes a permissive environment for malignant transformation, in which persistent Helicobacter pylori-driven NF-κB activity occurs in parallel with deficient immune surveillance; these features are typical of gastric immuno-oncogenesis (29). Emerging studies using spatial transcriptomics reveal that areas of marked PG1 loss show elevated PD-L1 expression on tumor-associated macrophages and decreased CD8+ T-cell infiltration, suggesting that PG1 deficiency may represent a surrogate marker for an immunologically cold tumor microenvironment. Thus, PG1 downregulation not only indicates loss of cellular differentiation but also provides insight into the immuno-oncological mechanisms underlying gastric carcinogenesis (30).
This study directly assessed PGI gene expression in the gastric mucosa and investigated its association with clinicopathological features in an Iranian population. Our investigation in southwestern Iran, a region with a high incidence of gastric cancer, showed a 4.3-fold decrease in PGI mRNA levels in tumor tissues compared with healthy controls. These findings are consistent with previous reports, including a TCGA-based bioinformatics analysis (22) and an immunohistochemical study (23), both of which support the downregulation of PGI in gastric cancer.
Reduced PGI transcription may reflect epigenetic silencing of SOX2, a lineage-determining transcription factor for gastric chief cells (31). Hypermethylation of the SOX2 promoter has been documented in hematological malignancies and colorectal cancer and is emerging as a feature of GC (32). Given that SOX2 directly transactivates the PGC promoter, its downmodulation offers a parsimonious explanation for the coordinated loss of PGI mRNA and protein inside the tumor microenvironment (32, 33). It is important to note that loss of SOX2 may lead to increased immune dysregulation. For example, recent findings have suggested a role for SOX2-positive chief cells in regulating mucosal IL-22 responses; this cytokine is essential for both epithelial regeneration and immune protection against bacteria (34). Loss of these cells may disturb the balance between these processes, thereby increasing the likelihood that chronic inflammation will progress to neoplasia. Future work should integrate methylation profiling and single-cell expression to disentangle these relationships and determine whether reversal of SOX2 repression could restore PGI output and impede malignant progression.
Our findings complement the work of Furihata, who demonstrated a decrease in PG1 mRNA expression in gastric cancer tissue (35). Although their study focused on the protein level, the combined evidence suggests a likely decrease in PG1 expression at both the mRNA and protein levels during gastric cancer development. Importantly, because only a small fraction (1%) of stomach-produced pepsinogens enters the bloodstream (36), investigating PG1 expression directly in gastric tissue, as performed in this study, offers valuable insights beyond serum protein levels. Furthermore, this study included participants from Iran, contributing valuable data from a population with a higher prevalence of gastric cancer.
5. Conclusion
Our findings indicate that PGI gene expression is consistently downregulated in gastric cancer tissue from a high-risk Iranian cohort, complementing rather than contradicting reports of altered serum PGI dynamics elsewhere. By highlighting the layer-specific behavior of this biomarker, we provide a rationale for combining tissue transcriptional readouts with existing serological tests in future early-detection panels. Larger prospective studies are needed to validate the diagnostic performance of integrated PGI assays and explore their utility in resource-limited settings where endoscopy capacity is limited.