
1. Background
Cancer remains one of the world’s most pressing health concerns and continues to rank among the leading causes of mortality. According to recent estimates from the American Cancer Society, nearly 20 million individuals were newly diagnosed with cancer in 2022, and approximately 9.7 million people died from the disease during the same period (1). Future epidemiological models predict a marked rise in cancer incidence, with annual cases projected to surpass 34 million by 2070, an increase expected to weigh most heavily on developing countries (2, 3). This expanding burden reflects the complex biology of oncogenesis, which arises from disruptions in regulatory pathways that normally restrict uncontrolled cell proliferation (4, 5). Ultimately, metastatic spread—an advanced stage driven by coordinated molecular changes that enable tumor cells to invade and thrive in distant tissues—accounts for the vast majority of cancer-related deaths (6).
Breast cancer continues to be the most frequently diagnosed malignancy among women worldwide. Although genetic susceptibility contributes to disease onset, accumulating evidence suggests that environmental and lifestyle factors are implicated in 20% - 30% of cases (7). Within this spectrum, triple-negative breast cancer (TNBC) presents a major clinical challenge. The absence of hormone receptor and HER2 expression results in a subtype characterized by rapid progression, therapeutic resistance, and distinct microenvironmental features. In TNBC, interactions among malignant cells, immunosuppressive components, and a remodeled extracellular matrix collectively promote aggressive behavior and poor clinical outcomes (8-10).
Natural killer (NK) cells represent a central arm of innate immune defense against malignancies. Identified by their CD56+CD3- phenotype, these cells can detect and eliminate transformed or stressed cells without prior antigen priming (11-13). Their effector activity is governed by a balance of signals received through activating and inhibitory receptors, among which the C-type lectin-like receptor NKG2D plays a pivotal role (14, 15). This receptor recognizes stress-induced ligands, such as MICA/B and ULBP family members, which are frequently upregulated on tumor cells but largely absent from healthy tissues (16-18). However, tumors can evade NK-cell surveillance through mechanisms such as proteolytic shedding of these ligands, thereby reducing their surface availability and weakening immune activation (19, 20). Tumor-associated macrophages may also influence the efficacy of paclitaxel in brain metastases, which is pertinent to understanding its effects in breast cancer.
Paclitaxel (PTX), a microtubule-stabilizing taxane, remains an essential component of chemotherapy for several solid tumors, including breast cancer (21, 22). Although its cytotoxic action is primarily mediated by disruption of mitotic spindle formation, recent research has highlighted additional immunomodulatory properties that influence NK-cell function. Notably, these immune-related effects appear to vary with drug concentration and treatment duration, creating uncertainty regarding optimal dosing (23, 24). Balancing the potent antitumor activity of PTX with preservation of key immune functions is therefore an important consideration in modern oncology. The apoptotic effects of steviol glycoside on MCF-7 and A2780 cell lines have been examined, potentially linking these findings to immunological responses affected by paclitaxel treatment.
2. Objectives
In light of these complexities, this study investigated how clinically relevant concentrations of PTX (0.15 µM, 0.3 µM, and 0.6 µM) affect NKG2D receptor expression and the cytotoxic capacity of NK cells derived from breast cancer settings. By delineating dose-dependent trends, this work aimed to identify therapeutic windows that preserve immune competence while maximizing antitumor efficacy, an essential step toward optimizing combination treatment strategies.
3. Methods
3.1. Cell Lines
The MDA-MB-231 and SK-BR-3 human breast cancer cell lines used in this study were obtained from the American Type Culture Collection (ATCC, Manassas, VA, USA; ATCC numbers: HTB-26 and HTB-30, respectively). The cell lines were free of mycoplasma, bacteria, and fungi (25-27). MDA-MB-231 cells were maintained in RPMI-1640 medium (Gibco, Thermo Fisher Scientific, USA), whereas SKBR-3 cells were cultured in Dulbecco's Modified Eagle Medium (DMEM; Gibco). Each growth medium was supplemented with 10% fetal calf serum (FCS; Integro, The Netherlands), penicillin (100 U/mL), streptomycin (100 µg/mL), 0.3 mg/mL L-glutamine (Gibco), and 0.05 nM β-mercaptoethanol (Merck, USA). All cultures were incubated under standard conditions (37°C, 5% CO2) and were routinely monitored to ensure cell viability and contamination-free growth.
3.2. Peripheral Blood Mononuclear Cell Isolation and NK Cell Purification
Peripheral blood samples were collected from three patients with newly diagnosed breast cancer at Ganjavian Hospital (DUMSc, Dezful). None of the patients had received chemotherapy, radiotherapy, or hormonal treatment before sampling. The demographic and clinical characteristics of the participants are summarized in Table 1. The study protocol adhered to the ethical standards of the Declaration of Helsinki and was approved by the relevant ethics committee (IR.DUMS.REC.1403.006). All participants provided written informed consent before enrollment.
Table 1.
Baseline Clinical Characteristics of Breast Cancer Patients
| Patient | Age | Sex | BMI | ER/PR/HER2 Expression | Stage | Treatment |
|---|---|---|---|---|---|---|
| Patient 1 | 47 | Female | 27.6 | TNBC | II | No treatment |
| Patient 2 | 39 | Female | 25.2 | TNBC | II | No treatment |
| Patient 3 | 42 | Female | 29.3 | TNBC | II | No treatment |
PBMCs were isolated immediately after blood collection using Ficoll-Hypaque density-gradient centrifugation. NK cells were then enriched from PBMC suspensions by magnetic negative selection (Miltenyi Biotec, Germany; Cat. No. 130 - 092 - 657) according to the manufacturer's instructions (28). The purity of the isolated CD3-CD56+ NK population exceeded 95% based on flow cytometry. After separation, NK cells were cultured in RPMI-1640 supplemented with 10% FBS and recombinant human IL-2 (100 U/mL; Novartis, Switzerland) before functional evaluation.
3.3. Assessment of Paclitaxel Effects on Cell Viability and NK Cytotoxicity
To evaluate the influence of PTX on NK-cell cytotoxicity, NK cells were co-cultured with MDA-MB-231 or SKBR-3 target cells in sterile 96-well plates. Each well contained 2000 target cells and 100000 NK cells. Experimental groups were treated overnight with the designated PTX concentrations. The following day, culture supernatants were removed, and 100 µL of fresh medium was added to each well. Cell metabolic activity was quantified by adding 10 µL of AlamarBlue solution (29) to each well and incubating the plates for 4 hours at 37°C. Fluorescence was measured at excitation/emission wavelengths of 560/590 nm, and the percentage of cytotoxicity was calculated relative to untreated controls.
For viability assays, NK cells or tumor cell lines were seeded separately into 96-well plates (2000 target cells or 100000 NK cells per well) (30). Cells were exposed overnight to PTX doses of 2.5 µM, 1.25 µM, 0.6 µM, 0.3 µM, 0.15 µM, or 0.0 µM (control). After incubation, AlamarBlue reagent was added, and fluorescence was recorded as described above. Relative cell viability (%) was determined using the following formula: % Cell Viability = [(PTX treated cells) - (PTX media) / (Cells alone) – (media alone)] x 100%.
3.4. RNA Extraction and Quantitative Real-Time PCR
NK cells, either cultured alone or co-cultured with tumor cells, were treated with the PTX concentrations shown in Table 2 for 24 hours. Total RNA was isolated using TRIzol reagent (Invitrogen) (31), and cDNA was synthesized using the PrimeScript RT kit (TaKaRa, Japan). Quantitative PCR was performed on a Roche LightCycler 480 using SYBR Green Master Mix (Thermo Fisher Scientific). The NKG2D primers were as follows: forward, 5′-CCTCTCTGAGCAGGAATCC-3′; and reverse, 5′-GGACATCTTTGCTTTTGCC-3′. β-actin served as the internal housekeeping gene, with the following primers: forward, 5′-GAGCATCCCCCAAAGTTCAC-3′; and reverse, 5′-GGGACTTCCTGTAACAACGC-3′. Relative expression levels were calculated using the 2-ΔΔCt method. All PCR reactions were performed in triplicate, and mean fold changes with standard deviations were reported.
Table 2.
Paclitaxel-Treated Experimental Groups
| Group | Treatment |
|---|---|
| 1 | NK cell control |
| 2 | NK cell + 0.6 µM PTX |
| 3 | NK cell + 0.3 µM PTX |
| 4 | NK cell + 0.15 µM PTX |
| 5 | NK cell + MDA-MB-231 control |
| 6 | NK cell + MDA-MB-231 + 0.6 µM PTX |
| 7 | NK cell + MDA-MB-231 + 0.3 µM PTX |
| 8 | NK cell + MDA-MB-231 + 0.15 µM PTX |
| 9 | NK cell + SKBR-3 control |
| 10 | NK cell + SKBR-3 + 0.6 µM PTX |
| 11 | NK cell + SKBR-3 + 0.3 µM PTX |
| 12 | NK cell + SKBR-3 + 0.15 µM PTX |
3.5. Flow Cytometric Detection of Apoptosis and Necrosis
After 24-hour exposure to PTX, adherent tumor cells were detached using trypsin-EDTA, neutralized with complete medium, and collected by centrifugation (1000 g, 5 minutes). NK cells were washed and harvested similarly. Cell pellets were resuspended in Annexin V-FITC binding buffer, and staining was performed with 1 µL of Annexin V-FITC followed by 1 µL of propidium iodide (PI). Samples were incubated in the dark at room temperature and analyzed on an Attune NxT flow cytometer (Life Technologies, USA). All apoptosis assays were independently repeated three times.
3.6. Statistical Analysis
All experiments were performed in triplicate. Data were analyzed using SPSS version 26 and GraphPad Prism version 9.1.0 (GraphPad Software, USA). Results are expressed as mean ± standard error. Group differences were assessed using 1-way ANOVA with a Tukey multiple-comparison test. A P value < 0.05 was considered statistically significant.
4. Results
As shown in Figure 1, PTX exerted a dose-dependent cytotoxic effect on NK cells and the MDA-MB-231 and SKBR-3 cell lines. The difference in viability between untreated control cells and PTX-treated cells was statistically significant. PTX doses ≥ 0.6 µM reduced NK-cell viability by more than 50%. Therefore, because of their pronounced cytotoxic effects on NK cells, the 2.5 and 1.25 µM paclitaxel doses were excluded from subsequent experiments. Instead, 0.6, 0.3, and 0.15 µM doses were used to investigate the effects of the drug on NKG2D gene expression and other outcomes.
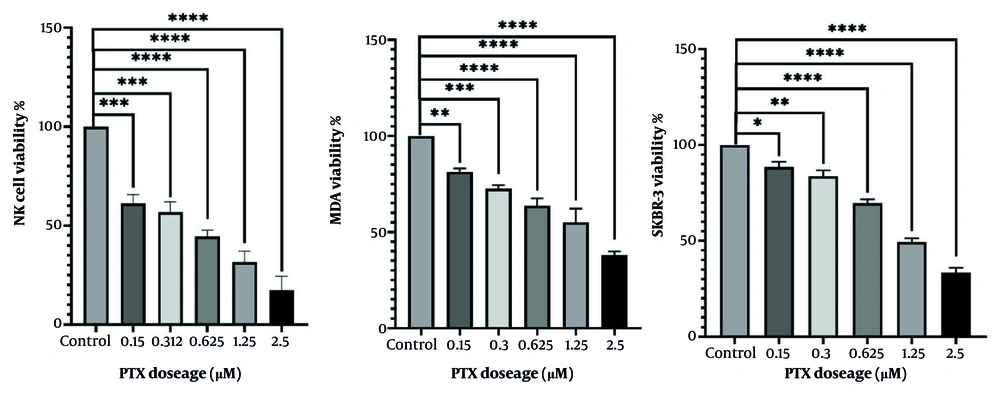
Figure 1.
The AlamarBlue colorimetric assay demonstrated the cytotoxic effect of PTX on NK cells, MDA-MB-231 cells, and SKBR-3 cells, resulting in a reduction in viable cells. Statistical analysis was performed using 1-way ANOVA with Tukey post hoc test in GraphPad Prism software to compare the treatment groups with the control. Data are presented as the mean ± SEM of 3 independent experiments performed in triplicate. * P < 0.05, ** P < 0.01, *** P < 0.001, **** P < 0.0001. Abbreviation: NS, nonsignificant.
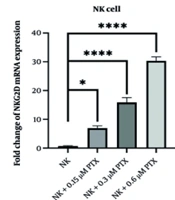
According to Table 2, NKG2D expression in NK cells was measured by real-time qPCR in three groups: the NK cells alone group, the NK + MDA-MB-231 group, and the NK + SKBR-3 group. As shown in Figure 2, NKG2D expression in PTX-treated NK cells increased significantly in a dose-dependent manner. The upregulation of NKG2D expression in the NK + MDA-MB-231 (P = 0.66) and NK + SKBR-3 (P = 0.827) groups was not significant between the 0.15 and 0.30 µM doses. However, it became statistically significant when the PTX dose was increased from 0.30 to 0.6 µM in the NK + MDA-MB-231 and NK + SKBR-3 groups (P = 0.0003 and P = 0.0001, respectively).
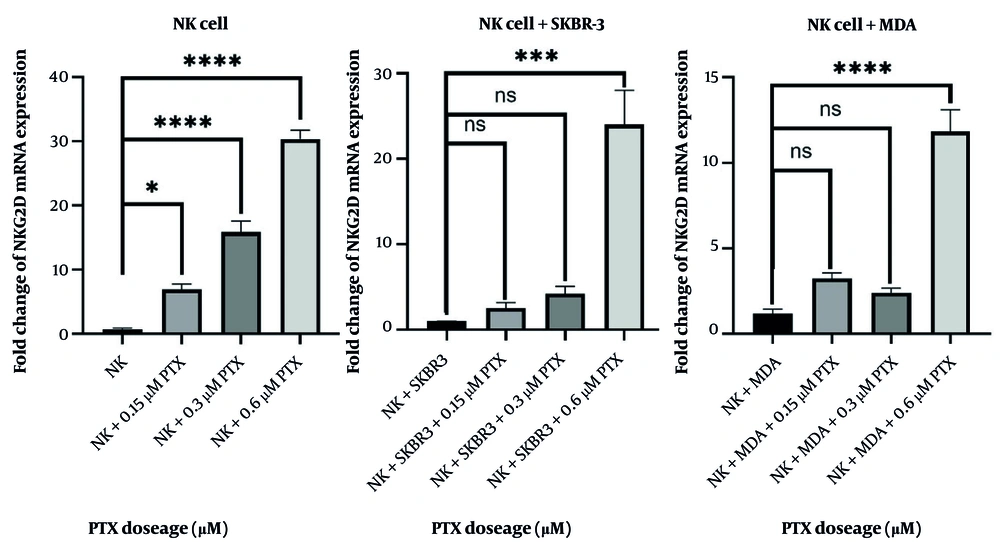
Figure 2.
Real-time qPCR analysis showed the effects of PTX treatment on NKG2D expression in NK cells. Statistical analysis was performed using 1-way ANOVA with Tukey post hoc test in GraphPad Prism software to compare the treatment groups with the control and to compare different treatment doses with each other. Data are presented as the mean ± SEM of 3 independent experiments performed in triplicate. * P < 0.05, *** P < 0.001, **** P < 0.0001. Abbreviation: NS, nonsignificant.
The effect of paclitaxel on cell death induction in the MDA-MB-231 and SKBR-3 cancer cell lines, as well as in NK cells, was investigated using flow cytometry with Annexin V-FITC and PI staining. Annexin V binds to phosphatidylserine exposed on the outer membrane of apoptotic cells, whereas PI enters cells and intercalates with DNA only after a loss of membrane integrity, indicating necrosis.
The data depicted in Figure 3 demonstrate that PTX significantly induced apoptosis in all three cell types in a dose-dependent manner, as evidenced by increased Annexin V+/PI- (early apoptosis) and Annexin V+/PI+ (late apoptosis or secondary necrosis) populations. Apoptosis induction at 0.6 µM was not significantly greater than that at 0.3 µM PTX, at least in the SKBR-3 cell line (P = 0.37). The difference in apoptosis induction between 0.15 and 0.3 µM PTX was not significant in NK cells (P = 0.074), MDA-MB-231 cells (P = 0.158), or SKBR-3 cells (P = 0.532). Therefore, the increase in NK-cell apoptosis with PTX doses from 0.15 to 0.3 µM is not a concern.
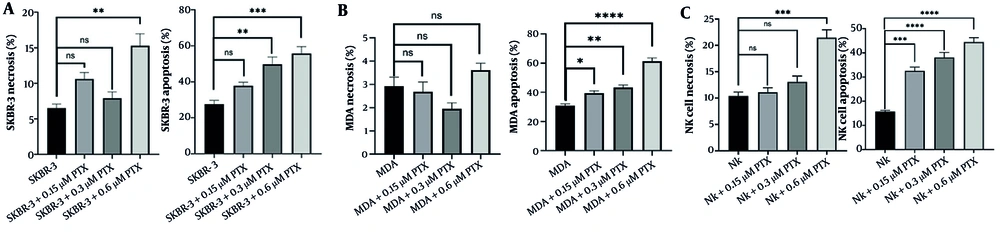
Figure 3.
The effect of different paclitaxel doses on apoptosis and necrosis in SKBR-3 (A), MDA-MB-231 (B), and NK (C) cell lines. The treatment period was 24 hours. Statistical analysis was performed using 1-way ANOVA with Tukey post hoc test in GraphPad Prism software to compare the treatment groups with the control and to compare different treatment doses with each other. Data are presented as the mean ± SEM of 3 independent experiments performed in triplicate. * P < 0.05, ** P < 0.01, *** P < 0.001, **** P < 0.0001. Abbreviation: NS, nonsignificant.
In contrast, the lowest necrosis rate (Annexin V-/PI+ population) in the MDA-MB-231 and SKBR-3 cell lines was observed at the 0.3 µM PTX dose. Furthermore, no significant difference in necrosis was detected in NK cells between the 0.3 and 0.15 µM PTX doses. The highest necrosis rate in both cell lines and NK cells occurred at the 0.6 µM PTX dose, which differed significantly from that at the 0.3 µM PTX dose.
These findings suggest that PTX primarily triggers cancer cell death through apoptotic pathways but may also lead to necrosis at higher concentrations or with prolonged exposure. The differential responses of MDA-MB-231, SKBR-3, and NK cells to PTX likely stem from variations in apoptosis-related gene expression and drug-resistance mechanisms among these cell types.
In the NK cytotoxicity assay against MDA-MB-231 and SKBR-3 targets, Figure 4 indicates that 0.15 µM PTX increased NK cytotoxicity to the highest level compared with the other doses. Although NK-cell cytotoxicity against MDA-MB-231 target cells at the 0.6 µM dose was higher than that in the control group without paclitaxel, it was the lowest compared with that at the 0.3 and 0.15 µM PTX doses.
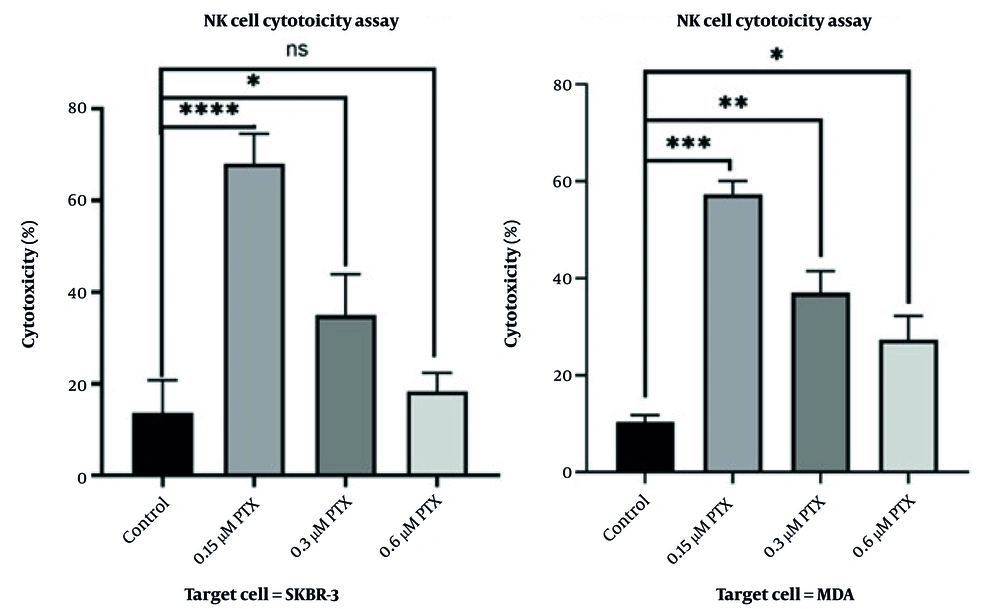
Figure 4.
The effect of different paclitaxel doses on NK-cell activity against MDA-MB-231 and SKBR-3 targets using the AlamarBlue method. Statistical analysis was performed using 1-way ANOVA with Tukey post hoc test in GraphPad Prism software to compare the treatment groups with the control. Data are presented as the mean ± SEM of 3 independent experiments performed in triplicate. * P < 0.05, ** P < 0.01, *** P < 0.001, **** P < 0.0001. Abbreviation: NS, nonsignificant.
5. Discussion
This study demonstrates a dose-dependent dual effect of PTX on natural killer cells and the breast cancer cell lines MDA-MB-231 and SKBR-3. MDA-MB-231 is widely recognized as a representative TNBC and highly invasive breast cancer cell line, whereas SKBR-3 is a standard model of HER2-positive breast cancer. These well-established and biologically distinct phenotypes were essential to the experimental design and scientific rationale of the present work.
Although higher concentrations of PTX (eg, 0.6 µM) effectively induced apoptosis in cancer cells, they also significantly compromised NK-cell viability and cytotoxicity. In contrast, the 0.3 µM dose of PTX provided a more favorable therapeutic window by maintaining relatively high NKG2D expression, preserving NK-cell cytotoxicity, and minimizing necrosis in both NK and cancer cells.
Our findings are consistent with previous reports indicating that PTX exerts immunomodulatory effects on NK cells (18). For instance, Kubo et al. (32) reported that low-dose PTX enhances NK-cell cytotoxicity and increases perforin secretion against the BT474 and K562 cell lines, supporting the concept of immunopotentiation at subtoxic doses. In addition, Hong et al. (33) developed TNBC preclinical models in athymic nude and NOD/SCID mice. They demonstrated that combining intratumoral NK-cell therapy with PTX chemotherapy produced additive effects, resulting in greater tumor growth inhibition and increased apoptosis.
Our observation of increased NKG2D expression at 0.3 µM PTX supports these findings and reinforces the concept that PTX, beyond its cytostatic function, may prime immune effector mechanisms when used at optimized concentrations. However, other studies have cautioned about the potential for paclitaxel-induced immunosuppression. For example, Markasz et al. (34) found that treatment of human NK cells with paclitaxel effectively inhibits NK-cell-mediated killing of K562 human erythroleukemia target cells in vitro without affecting NK-cell viability.
Consistently, we observed a significant decrease in NK-cell viability and an increase in NK-cell necrosis at 0.6 µM PTX, indicating a potential immunotoxic threshold. Furthermore, Samanta et al. (35) reported that paclitaxel at high doses may promote tumor immune escape by inducing regulatory T cells. They implanted 4T1 cells into the mammary fat pads of female BALB/c mice. The mice were then treated with PTX (10 mg/kg) every 5 days. Analysis of 4T1 orthotopic tumors 3 days after the final paclitaxel dose revealed a significantly higher percentage of regulatory T cells than in tumors from vehicle-treated control mice (35).
This dichotomy underscores the importance of optimizing chemotherapy dosage to balance direct cytotoxicity against tumor cells with the preservation of innate immune effectors. Our results suggest that 0.3 µM PTX may be a preferable concentration for ex vivo or combination immunotherapeutic protocols, maintaining NK function while exerting antitumor effects. These data are particularly relevant for TNBC, in which NK cells play a pivotal role in immune surveillance and the tumor microenvironment is often profoundly immunosuppressive (36).
5.1. Limitations
This study has several limitations. Although the in vitro co-culture system provides valuable insights, it cannot fully recapitulate the complexity of the tumor microenvironment. The use of a fixed effector-to-target ratio may not reflect physiological conditions, and a 24-hour treatment period captures only acute responses, leaving longer-term effects unexplored. To enhance translational relevance, future work should validate these findings in patient-derived organoids or in vivo models. In addition, extending the treatment duration and incorporating diverse immune cell populations, such as macrophages and T cells, would provide a more comprehensive understanding of how these interactions influence therapeutic outcomes.
5.2. Conclusions
These findings challenge the conventional "more is better" paradigm of chemotherapy, suggesting that dose de-escalation may improve treatment outcomes by harnessing innate immunity. Future studies should validate these results in animal models and explore synergistic combinations with NK-cell-boosting agents, such as IL-15 or checkpoint inhibitors. In addition, further investigation is needed to elucidate the molecular mechanisms through which paclitaxel modulates NK-cell phenotype and function, potentially involving the mTOR, JAK/STAT, or PI3K/AKT pathways. This refined dosing strategy could represent a significant advancement toward immunologically optimized cancer therapies.