1. Background
The proliferation of large-scale, electronic health record (EHR)-linked biobanks, such as the National Institutes of Health All of Us Research Program (1), has provided researchers with unprecedented opportunities to conduct highly powered epidemiological and genetic studies. However, although clinical outcomes can often be objectively defined using standardized billing codes, key lifestyle covariates such as alcohol consumption are predominantly captured through self-reported surveys. Instruments such as the Alcohol Use Disorders Identification Test-Consumption (AUDIT-C) (2) are widely used in these cohorts because of their validated clinical utility and low respondent burden. This is particularly relevant in military and veteran populations, in which the AUDIT-C is routinely administered across the Veterans Health Administration (VHA) and the Department of Defense (DoD) (3-5).
Despite their widespread use, surveys such as the AUDIT-C present a distinct methodological challenge for quantitative research because they capture continuous behaviors using categorical, range-based bins. For example, participants report drinking frequency (eg, "2 to 4 times a month") and typical drinking quantity (eg, "3 or 4 drinks") by selecting from predefined qualitative options. Although this categorical approach works well for its intended use as a primary screening tool (2), it creates a substantial challenge for researchers because of the ordinal, semiquantitative nature of the data.
Historically, researchers have addressed the limitations of categorical survey data using two primary analytical workarounds. The most common approach involves assigning arbitrary midpoints to categorical bins (eg, converting "3 or 4 drinks" to exactly 3.5) to enable calculation of a single continuous daily ethanol exposure metric (6, 7). However, this approach assigns exact values to range-based choices, generating implied precision that may exceed the survey's original design. Indeed, studies comparing the categorical AUDIT-C with continuous drinking measures have demonstrated that converting these categorical choices into exact continuous values obscures substantial variability in actual alcohol consumption (8). Alternatively, some investigators use regression mapping to map the aggregate ordinal AUDIT-C score 0 - 12 directly to a mean daily drinking estimate (9). Although highly effective for general screening, reliance on the aggregate score may not capture the full variation in underlying behaviors; an identical score, and therefore an identical daily volume estimate, can be generated by a frequent light drinker or an infrequent binge drinker.
To complement these established methods, this methodological report presents a structured approach for organizing, presenting, and contextualizing categorical AUDIT-C survey responses. Specifically, I describe two descriptive techniques: 1) a systematic bounding approach that applies time-interval correction factors to cross-tabulated survey responses, providing theoretical low and high estimates of average daily alcohol consumption to appropriately scale and contextualize the categorical bins; and 2) a standardized cross-tabulation matrix designed to clearly present cohort distributions and clinical outcome prevalences across intersecting behavioral strata. By detailing this presentation strategy, this report aims to provide researchers with additional tools to report alcohol-related survey data and summarize complex behavioral phenotypes within large-scale observational cohorts.
2. Objectives
The objective of this methodological report is to present and validate a structured, reproducible framework for organizing, presenting, and bounding categorical AUDIT-C survey responses in large-scale biobanks, and to demonstrate its utility across clinical, genetic, and demographic data.
3. Methods
3.1. Demonstration Cohorts
The methods described in this report were developed and applied to specific analytical subsets of the All of Us Research Program curated for primary epidemiological investigations (10). Rather than generating a new cohort, the use of these exact datasets provides a transparent methodological companion demonstrating how complex categorical exposure variables can be mapped and contextualized. To demonstrate the versatility of this framework, it was applied to three distinct domains:
Clinical phenotyping: Evaluation of generalized anxiety disorder (GAD) prevalence within a European ancestry (EUR) cohort (n = 104,893).
Genetic epidemiology: Mapping of the minor allele frequency (MAF) of the rs1229984 genetic variant across the same EUR cohort. This variant is a well-characterized missense mutation in the ADH1B gene. For this analysis, the sample size was restricted to 104,890 individuals; 3 participants were excluded because they carried a separate, very rare third allele at this locus.
Demographic assessment: Evaluation of alcohol consumption patterns based on self-reported active duty military service history (n = 104,893). Specifically, participants were classified based on their response to the survey question, "Have you ever served on active duty in the US Armed Forces?"
3.2. Bounding Estimation for Average Daily Consumption
To provide tangible, real-world context for the categorical AUDIT-C survey responses, a bounding approach was developed to estimate a theoretical range of average daily alcohol consumption. Rather than assigning a single arbitrary midpoint to each category, this method calculates lower and upper limits based on the cross-tabulation of reported drinking frequency and typical drinking quantity.
The standard AUDIT-C survey captures drinking frequency (f) and typical quantity (q) using categorical bins. For bounded categories (eg, frequency of "2 to 4 times a month" or quantity of "3 or 4 drinks"), the discrete numerical minimums (flow, qlow) and maximums (fhigh, qhigh) are extracted directly from the survey text. For open-ended categories (eg, frequency of "Monthly or less" or "4 or more times a week"), reasonable absolute limits must be defined by the investigator based on the study population (eg, anchoring "Monthly or less" to a frequency of exactly 1 time per month). In this manuscript, the following choices were used for open-ended categories: a frequency of exactly 1 time per month for both low and high estimates for "Monthly or less"; 4 and 7 times per week for the low and high estimates, respectively, for "4 or more times a week"; and 10 drinks for both the low and high quantity estimates for "10 or more" drinks.
Once the numerical limits for frequency and quantity are defined for a given cross-tabulated category, the estimated average daily consumption (E) is calculated by multiplying the frequency by the quantity and dividing by a time-interval correction factor (t). The correction factor normalizes the reported timeframe into a daily rate (eg, t = 7 for weekly frequencies and t = 30.4375 for monthly frequencies to account for the average length of a month over a 365.25-day year).
The lower and upper bounds of average daily consumption for any specific survey-response combination are computed using the following formulas:
For example, for participants reporting a frequency of "monthly or less" (flow = 1, fhigh = 1, t = 30.4375) and a typical quantity of "1 or 2 drinks" (qlow = 1, qhigh = 2), the estimated daily consumption range is calculated as 0.0329 (Elow) to 0.0657 (Ehigh) drinks per day. This limit-based calculation is systematically applied across all intersecting categories to generate a standardized matrix of consumption bounds.
3.3. Cross-Tabulation Mapping Matrix
To accurately map cohort distributions and clinical outcome prevalences across these complex behavioral phenotypes, a two-dimensional cross-tabulation matrix was used. This framework moves beyond unidimensional summaries to visualize the interactions between drinking frequency and quantity.
3.3.1. Matrix Construction
The matrix is structured with past-year drinking frequency as the rows and typical drinking quantity as the columns.
3.3.2. Handling Incomplete Data
An optional component of this matrix is the inclusion of an "Unspecified" or "Prefer Not to Answer" column. Because survey logic often permits participants to skip questions, restricting the analysis to complete cases could introduce selection bias. The "Unspecified" column retains these individuals in the denominator for frequency-level summary statistics. In the present analysis, data for individuals who did not complete the full survey were discarded.
3.3.3. Proportion Calculations
Within each intersecting cell of the matrix, the baseline prevalence (proportion) of a given clinical outcome is calculated by dividing the number of individuals with the target EHR diagnosis by the total number of individuals in that specific intersecting cell.
4. Results
To demonstrate the broad utility of this approach across diverse epidemiological domains, the cross-tabulation matrix and bounding algorithm were applied to three distinct analytical use cases.
4.1. Application 1: Clinical Phenotyping (Generalized Anxiety Disorder)
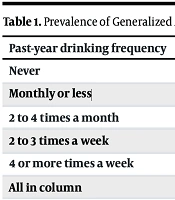
When mapping GAD prevalence within the EUR cohort (n = 104,893), the multidimensional matrix (Table 1) immediately highlights nuanced patterns that may be obscured by a single aggregate AUDIT-C score. The matrix shows that individuals reporting the highest drinking frequency ("4 or more times a week") combined with the highest quantity ("10 or more" drinks) had a GAD prevalence of 13.5%. Conversely, those reporting the same high frequency but a low quantity ("1 or 2" drinks) had a lower GAD prevalence of 5.8%. Two contrasting trends are apparent in the cross-tabulation matrix: a general trend toward higher anxiety rates among higher-volume drinkers and a general trend toward lower anxiety rates among higher-frequency drinkers.
Table 1.
Prevalence of Generalized Anxiety Disorder (GAD) Diagnoses by Cross-Tabulated AUDIT-C Behavioral Strata (N = 104,893) a
| Percent w/ Generalized Anxiety Disorder Diagnoses in EUR | “On a Typical Day When You Drink, How Many Drinks Do You Have?” | All in Row | |||||
|---|---|---|---|---|---|---|---|
| Quantity | 1 or 2 | 3 or 4 | 5 or 6 | 7 to 9 | 10 or More | ||
| “How often did you have a drink containing alcohol in the past year?” | |||||||
| Never | 0.095 | 0.095 | |||||
| Monthly or less | - | 0.093 | 0.118 | 0.101 | 0.122 | 0.088 | 0.095 |
| 2 to 4 times a month | - | 0.074 | 0.088 | 0.083 | 0.133 | 0.161 | 0.077 |
| 2 to 3 times a week | - | 0.069 | 0.090 | 0.105 | 0.119 | 0.069 | 0.075 |
| 4 or more times a week | - | 0.058 | 0.065 | 0.108 | 0.113 | 0.135 | 0.065 |
| All in column | 0.095 | 0.077 | 0.087 | 0.099 | 0.120 | 0.123 | 0.083 |
a Values represent the baseline prevalence, expressed as a proportion, of GAD diagnoses within the EUR cohort of the All of Us Research Program. The cohort is cross-tabulated across the two intersecting behavioral dimensions of the AUDIT-C: past-year drinking frequency (rows) and typical drinking quantity on a drinking day (columns). The multidimensional presentation preserves the interaction between drinking frequency and quantity, including the contrast between higher GAD prevalence in high-volume drinkers and lower prevalence in higher-frequency, low-quantity drinkers. The "Never" category represents participants who reported never consuming alcohol in the past year.
The bounding method estimates that individuals with a GAD diagnosis consumed between 0.299 (low estimate) and 0.730 (high estimate) drinks per day. Individuals without a GAD diagnosis consumed between 0.303 and 0.787 drinks per day. The ratio of average daily consumption among individuals with GAD versus those without GAD was 0.98 for the low estimate and 0.93 for the high estimate.
4.2. Application 2: Genetic Epidemiology (rs1229984)
Applying this framework to genetic data enables presentation of the suppressive effects of the rs1229984 minor allele on alcohol consumption. The cross-tabulation matrix for the rs1229984 genetic variant in the EUR cohort (n = 104,890; Table 2) shows a distinctly lower MAF at higher drinking frequencies and quantities, with an MAF of 0.010 in the highest frequency and quantity bin ("4 or more times a week" and "10 or more" drinks).
Table 2.
Minor Allele Frequency (MAF) of rs1229984 (ADH1B) by Cross-Tabulated AUDIT-C Behavioral Strata (N = 104,890) a
| rs1229984 Minor Allele Frequency in Europeans (EUR) | “On a Typical Day When You Drink, How Many Drinks Do You Have?” | All in Row | |||||
|---|---|---|---|---|---|---|---|
| Quantity | 1 or 2 | 3 or 4 | 5 or 6 | 7 to 9 | 10 or More | ||
| “How often did you have a drink containing alcohol in the past year?” | |||||||
| Never | 0.041 | 0.041 | |||||
| Monthly or less | - | 0.053 | 0.036 | 0.026 | 0.022 | 0.015 | 0.051 |
| 2 to 4 times a month | - | 0.047 | 0.035 | 0.030 | 0.022 | 0.011 | 0.045 |
| 2 to 3 times a week | - | 0.040 | 0.032 | 0.019 | 0.016 | 0.028 | 0.037 |
| 4 or more times a week | - | 0.033 | 0.020 | 0.021 | 0.011 | 0.010 | 0.029 |
| All in column | 0.041 | 0.046 | 0.030 | 0.024 | 0.016 | 0.013 | 0.042 |
a Values represent the minor allele frequency of rs1229984, a well-characterized missense variant in the alcohol dehydrogenase gene ADH1B, within the EUR cohort of the All of Us Research Program. The MAF is mapped across past-year drinking frequency (rows) and typical drinking quantity (columns). The matrix shows a dose-dependent genetic gradient, with the lowest MAF of 0.010 observed in the highest drinking frequency and quantity category ("4 or more times a week" and "10 or more" drinks). Abbreviations: ADH1B, alcohol dehydrogenase 1B; AUDIT-C, Alcohol Use Disorders Identification Test-Consumption; EUR, European ancestry.
The bounding algorithm yields dose-dependent estimates of daily alcohol exposure by genotype. Individuals harboring 0 copies of the minor allele had estimated consumption ranges of 0.311 to 0.803 drinks per day. This range decreased to 0.201 to 0.552 for those with 1 copy and 0.191 to 0.550 for those with 2 copies. This approach allows researchers to approximate the effectiveness of a genetic instrument. Individuals with 1 copy of the minor allele consumed 64.6%–68.7% as much alcohol as those with 0 copies, based on the low and high boundary estimates. Individuals with 2 copies of the minor allele consumed 61.5%–68.5% as much alcohol as those with 0 copies.
4.3. Application 3: Demographic Assessment (Active-Duty Military Service)
Finally, the matrix effectively isolates behavioral differences across demographic variables. Among participants answering the question regarding active-duty military service (n = 104,893; Table 3), the matrix highlights an elevated concentration of participants with active-duty military service in the highest-frequency drinking stratum ("4 or more times a week").
Table 3.
Proportion of Participants with Self-Reported Active-Duty Military Service by Cross-Tabulated AUDIT-C Behavioral Strata (N = 104,893) a
| Percent “Yes” on Active-Duty Question | “On a Typical Day When You Drink, How Many Drinks Do You Have?” | All in Row | |||||
|---|---|---|---|---|---|---|---|
| Quantity | 1 or 2 | 3 or 4 | 5 or 6 | 7 to 9 | 10 or More | ||
| “How often did you have a drink containing alcohol in the past year?” | |||||||
| Never | 0.159 | 0.159 | |||||
| Monthly or less | - | 0.105 | 0.092 | 0.090 | 0.096 | 0.103 | 0.103 |
| 2 to 4 times a month | - | 0.104 | 0.090 | 0.088 | 0.094 | 0.161 | 0.101 |
| 2 to 3 times a week | - | 0.106 | 0.104 | 0.103 | 0.135 | 0.069 | 0.106 |
| 4 or more times a week | - | 0.143 | 0.160 | 0.181 | 0.172 | 0.130 | 0.149 |
| All in column | 0.159 | 0.111 | 0.114 | 0.121 | 0.133 | 0.123 | 0.121 |
a Values represent the proportion of participants who self-reported a history of active-duty service in the US Armed Forces, cross-tabulated across past-year drinking frequency (rows) and typical drinking quantity (columns) using the AUDIT-C survey framework. The matrix shows an elevated concentration of participants with active-duty military service in the highest-frequency drinking stratum ("4 or more times a week"). Abbreviations: AUDIT-C, Alcohol Use Disorders Identification Test-Consumption.
The bounding algorithm confirms this shift in absolute volume, estimating that participants with active-duty experience had approximately 1.14 times the alcohol consumption, with an estimated daily consumption range of 0.339 to 0.875 drinks per day, compared with 0.297 to 0.770 drinks per day among those without active-duty experience.
5. Discussion
5.1. Novelty and Methodological Advantages
Although the fundamental calculation of multiplying drinking frequency by quantity is a cornerstone of alcohol epidemiology (11), the framework presented in this report offers an additional approach that complements current data-presentation practices. Its primary utility is the formalization of a two-dimensional descriptive mapping tool paired with a strict bounding algorithm, which together provide an additional method for analyzing alcohol consumption data from the AUDIT-C and similar ordinal, semiquantitative surveys.
Unlike regression-mapping approaches that rely on aggregate scores and may group distinct behaviors together, this cross-tabulation matrix explicitly preserves the critical interaction between frequency and quantity. Furthermore, by calculating strict absolute bounds (low and high estimates) rather than assigning arbitrary midpoints, this method transparently acknowledges and quantifies the uncertainty inherent in categorical survey instruments, rather than implying mathematical precision that the survey was not designed to capture. The matrix provides a universally interpretable, purely descriptive tool that clinicians and researchers can use without deconstructing an underlying statistical model. This transparency is particularly valuable for military medicine applications, allowing clinical administrators and researchers to visualize precise behavioral distributions among active duty and veteran populations.
5.2. Limitations
This proposed framework has several limitations. First, because the inputs rely on the AUDIT-C, the calculated bounds remain subject to standard self-report limitations and biases. Second, the bounding method requires investigators to make necessary assumptions when defining absolute limits for open-ended categories (eg, capping "10 or more drinks" at exactly 10). Although this provides a mathematical foundation for analysis, variation in how these open-ended limits are defined across studies could hinder direct cross-study comparability.
5.3. Conclusions
These methods offer important advantages for epidemiological and genetic research. By presenting consumption bounds rather than artificial point estimates, researchers can identify general trends and approximate daily alcohol consumption without overstating the precision inherent in the data. Furthermore, the cross-tabulation matrix ensures that critical subpopulations and trends in frequency and quantity can be evaluated. Ultimately, adopting this presentation strategy can improve the resolution, reproducibility, and interpretability of lifestyle exposure data in modern, large-scale biobanks.