


1. Background
2. Objectives
3. Methods
3.1. Data Sources, Normalization, and Differential Expression
3.2. Clinical Data Processing and Survival Testing
3.3. Co-expression Network and Pathways
3.4. Tissues Samples, RNA Isolation, cDNA Synthesis, and RT-qPCR
| Target Gene | Primer Name | Sequence |
|---|---|---|
| MIR17HG | Forward | 5’TCAGGAGTTCGAGACCAACC3’ |
| MIR17HG | Reverse | 5’TGCCTCAGCCTCCAGAGTAG3’ |
| GAPDH | Forward | 5’ACAGTCAGCCGCATCTTCT3’ |
| GAPDH | Reverse | 5’CCCAATACGACCAAATCC3’ |
3.5. Statistics and Software
4. Results
4.1. Expression Changes of MIR17HG by Escherichia coli K-12 in CRC
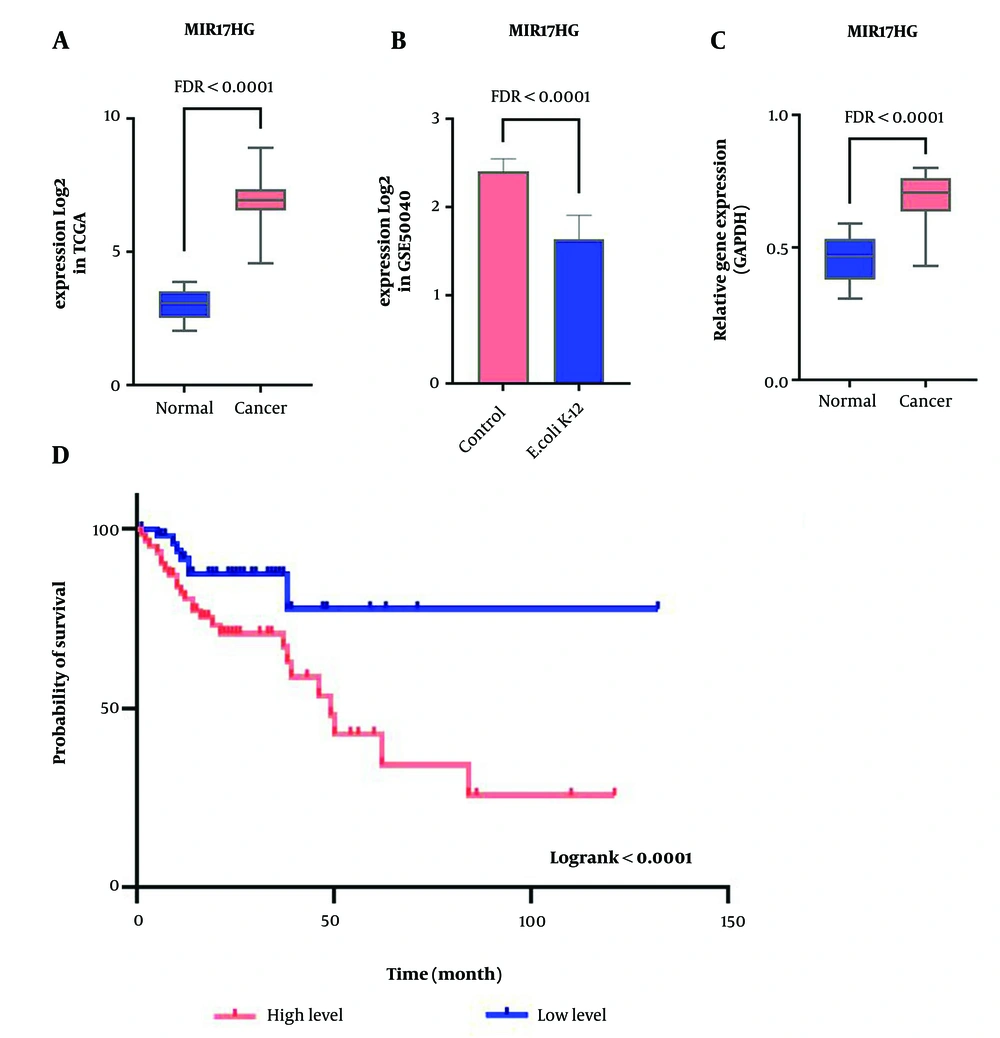
The high MIR17HG expression level as a poor prognosis biomarker downregulated by Escherichia coli K-12 in CRC. A, significant expression changes of MIR17HG in tumor samples compared to normal based on TCGA data; B, the E. coli K-12 impact on decreasing MIR17HG expression level; C, tthe RT-qPCR results for the expression of MIR17HG in forty CRC samples and adjacent normals; D, the association of MIR17HG expression with survival rate is shown through the Kaplan-Meier plot in CRC.
4.2. Relationship of MIR17HG and the Mortality Rate
4.3. Correlating of MIR17HG with Genes Related to the Main Pathways of Cancer
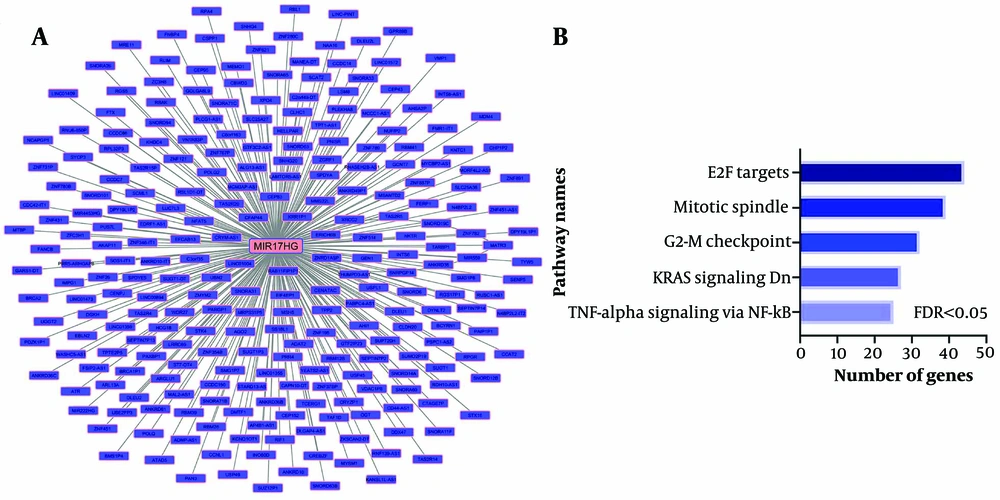
Co-expression of MIR17HG with genes related to cancer development pathways. A, the co-expression network of all genes that had an expression correlation with MIR17HG at R > 0.5 and P < 0.01. The Pearson correlation test was performed between MIR17HG expression and all genes in TCGA colorectal cancer samples; B, enrichment results of all correlated genes with MIR17HG demonstrate their significant role in cancer progression pathways.


