


1. Background
2. Objectives
3. Methods
3.1. Bacterial Strains
3.2. Designing Expression Vectors
3.3. Expression of E50-52 and Ib-AMP4
3.4. Protein Purification
3.5. Refolding Optimization
3.6. Protein Concentration
3.7. Standard Bacterial Inoculum Preparation
3.8. Minimum Inhibitory Concentration Antibacterial Assay
3.9. Assessment of Minimum Bactericidal Concentration
3.10. Synergy Assessment
3.11. Time-Kill Curves
3.12. Growth Curve
3.13. Scanning Electron Microscopy
3.14. Animal Assay
3.15. Systemic Infection
3.16. In Vivo Antibacterial Assay
4. Results
4.1. Protein Expression in Escherichia coli BL21
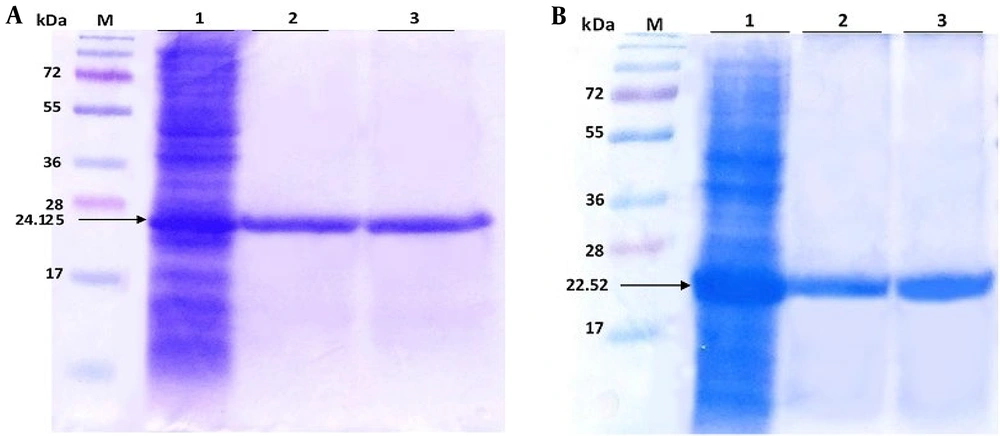
A, lane 1 expression of E50-52 in Escherichia coli BL21 (pLysS) total protein 4 hours after injection, lane 2 purified protein and lane 3 after the dialysis of protein E50-52; B, lane 1 expression of Ib-AMP4 in Escherichia coli BL21 DE3 total protein 4 hours after induction, lane 2 purified protein and lane 3 after the dialysis of protein Ib-AMP4.M: Size marker (5)
4.2. Purification and Refolding of Expressed Proteins
4.3. Antibacterial Assays
4.4. Assessment of Minimum Bactericidal Concentration
4.5. Synergic Effects of Recombinant Proteins
4.6. Time-Kill Curve
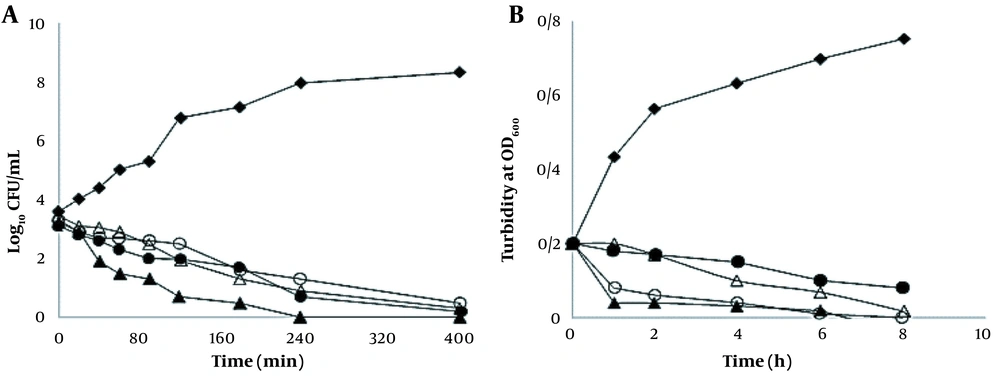
Bacterial-killing kinetics (A); and bacterial growth kinetics (B) of E50-52 and IbAMP4 antimicrobial peptides (AMPs) at 2 × minimum inhibitory concentration (MIC) against Acinetobacter baumannii. Control (♦), E50-52, 125 µg/mL (∆), and Ib-AMP4, 650 µg/mL (O), E50-52, 62 µg/mL and Ib-AMP4, 324 µg/mL (▲) colistin (●)
4.7. Growth Kinetic Curve
4.8. Scanning Electron Microscopy
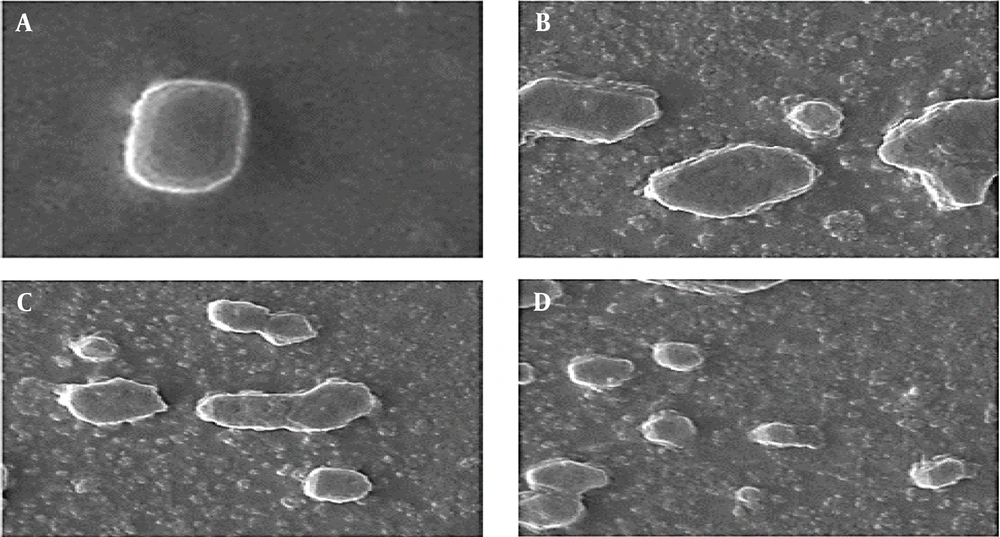
A, scanning electron microscopy micrographs of untreated Acinetobacter baumannii; B, Acinetobacter baumannii cell treated with Ib-AMP4 at fractional inhibitory concentration values; C, Acinetobacter baumannii cell treated with E50-52 at fractional inhibitory concentration values; D, Acinetobacter baumannii cell treated with E50-52 and Ib-AMP4 at fractional inhibitory concentration (FIC) values
4.9. The Effects of E50-52 and Ib-AMP4 on Systemic Infection
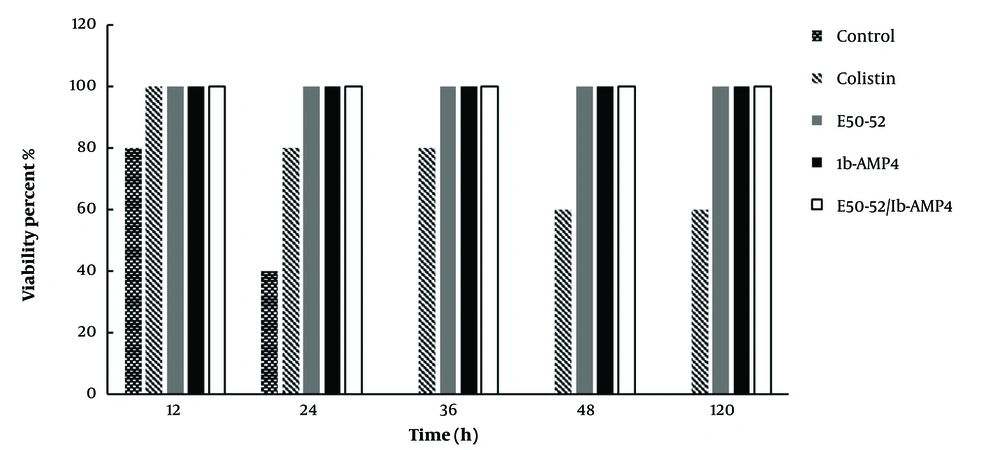
The effects of E50-52 and Ib-AMP4 antimicrobial peptides on the systemic infection graph


