


1. Background
The genus Aspergillus comprises more than 339 species of filamentous fungi, but only a few, including Aspergillus fumigatus, A. flavus, A. niger, A. terreus, and A. nidulans, are recognized as human pathogens (1, 2). Six species of the Aspergillus section Flavi, which are closely related both morphologically and phylogenetically, include A. flavus, A. parasiticus, A. nomius, A. oryzae, A. sojae, and A. tamarii (3, 4). The most common causative agent of aspergillosis is A. fumigatus; however, A. flavus is the second leading cause of invasive and non-invasive aspergillosis (5-9).
Aspergillus flavus can cause various clinical forms of infections, including otomycosis, keratitis, onychomycosis, sinusitis, bronchiectasis, and invasive aspergillosis (10). Whether specific isolates are preferentially associated with certain clinical manifestations of aspergillosis remains a critical unresolved question (11, 12). Molecular species typing methods, such as random amplification of polymorphic DNA (RAPD), restriction fragment length polymorphism (RFLP), amplified fragment length polymorphism (AFLP), and multiple-locus variable number tandem repeat analysis (MLVA), are effective tools in microbiology laboratories and for monitoring hospital infections to determine genetic diversity (12, 13). The MLVA method identifies closely related strains for analyzing disease outbreaks and provides data on genetic diversity profiles (11, 14).
In recent years, antifungal agents such as itraconazole (ITR), amphotericin B (AMB), voriconazole (VOR), posaconazole (POS), isavuconazole (ISA), and caspofungin (CAS) have been approved for the treatment of invasive and non-invasive aspergillosis (8, 15). However, triazole resistance is increasingly reported in clinical and environmental isolates of Aspergillus species worldwide (16). Luliconazole (LUL) and lanoconazole (LAN) are two new imidazole antifungals with broad-spectrum activity against common human fungal pathogens, including Malassezia spp., Trichophyton spp., Candida spp., and A. fumigatus (15). These antifungals have been approved by the US Food and Drug Administration (FDA) for the topical treatment of dermatophytosis (17). Antifungal susceptibility testing (AFST) procedures, following the guidelines of the European Committee on Antibiotic Susceptibility Testing (EUCAST) and the Clinical Laboratory Standards Institute (CLSI), are essential for detecting drug resistance and determining optimal therapies for invasive and non-invasive aspergillosis (8, 15).
2. Objectives
There is limited data on the genetic diversity and antifungal susceptibility profiles of clinical isolates of A. flavus from Iran. As a result the aim of the current study was to perform in vitro AFST and genotyping of clinical A. flavus strains using the MLVA method.
3. Methods
3.1. Sample Collection
This descriptive cross-sectional study was conducted over a period of 24 months (2021 - 2023). A total of 65 isolates of A. flavus were collected from clinical samples, including otomycosis (24 isolates, 36.92%), onychomycosis (17 isolates, 26.15%), bronchoalveolar lavage (BAL) (13 isolates, 20%), and sinus samples (11 isolates, 16.93%), from hospitals in Mazandaran and Tehran.
3.2. DNA Extraction
DNA extraction of A. flavus strains was performed using a glass bead and phenol:Chloroform:Isoamyl alcohol method (25:24:1, v/v) (Sigma-Aldrich, Germany). A fresh colony of A. flavus (2 - 5 days old, incubated at 35°C) was used. In each sterile microtube (1.5 mL), 200 microliters of lysis buffer (containing Triton X-100, 1% sodium dodecyl sulfate, 100 mM sodium chloride, 10 mM Tris-hydrochloric acid with pH = 8, 1 mM ethylenediaminetetraacetic acid (EDTA) with pH = 8) and 300 mg of glass beads (diameter 0.4 - 0.6 mm) were added.
A swab exposed to sterile distilled water was used to collect spores of A. flavus. The contents of the microtube were vortexed for 30 seconds and then incubated at 70°C for 30 minutes. Subsequently, 200 μL of the phenol:chloroform:isoamyl alcohol mixture was added. The microtube was incubated at 25°C for 5 minutes and centrifuged at 14,000 rpm for 10 minutes at 4°C. The optical density (OD) of the DNA samples (to measure the amount of DNA) was then determined using a spectrophotometric method. The extracted DNA was stored in a freezer at -20°C (18).
3.3. Strain Identification and PCR Sequencing
The strains were identified based on macroscopic and microscopic morphological features and confirmed through β-tubulin region sequence analysis, as described previously (19).
3.4. Multiple-Locus Variable Number Tandem Repeat Analysis Typing of Aspergillus flavus by Multiplex PCR Method
Multiple-locus variable number tandem repeat analysis typing was performed on all A. flavus strains using six VNTR markers (AFLA1, AFLA3, AFLA7, AFPM3, AFPM4, and AFPM7), as previously described by Hadrich et al. (11). The PCR amplification reaction, with a final volume of 25 µL, was prepared by combining 1 μL of extracted DNA, 1 μL of each primer at a concentration of 10 pmol/μL (Table 1), 12.5 μL of Taq DNA Polymerase 2x master mix red (Amplicon, Denmark), and 9.5 μL of distilled water.
Table 1.Characteristics of the Six Variable Number of Tandem Repeats Loci in the Aspergillus flavus Isolates
| VNTR Markers | Primer Sequences (5' to 3') | Repeat Unit | Range of Repeat Number | Fragment Size |
|---|---|---|---|---|
| AFLA1 | F:CGTTGGCATGTTATCGTCAC | AC | 14 | 180 - 290 |
| R:CTACTGAATGGCGGGACCTA | ||||
| AFLA3 | F:CTGAAAGGGTAAGGGGAAGG | TAGG | 11 | 164 - 272 |
| R:CACGCGAACTTATGGGACTT | ||||
| AFLA7 | F:GCGGACACTGGATGAATAGC | TAG | 13 | 121 - 293 |
| R:AACAAATCGGTGGTTGCTTC | ||||
| AFPM3 | F:CCTTTCGCACTCCGAGAC | (AT)6AAGGGCG(GA) | 10 | 188 - 274 |
| R:CACCACCAGTGATGAGGG | ||||
| AFPM4 | F:AGCGATACAGTTTTAACACC | CA | 7 | 184 - 210 |
| R:TCTTGCTATACATATCTTCACC | ||||
| AFPM7 | F:TTGAGGCTGCTGTGGAACGC | AC | 13 | 188 - 256 |
| R:CAAATACCAATTACGTCCAACAAGGG |
Abbreviations: VNTR, variable number of tandem repeats; F, forward; R, reverse.
The multiplex PCR reaction was carried out in a thermal cycler (Applied Biosystems Simpliamp, USA) following a specified thermal program: An initial denaturation at 94°C for 5 minutes, followed by 30 cycles of denaturation at 94°C for 30 seconds, annealing at 54°C for 30 seconds, and extension at 72°C for 30 seconds, with a final extension step at 72°C for 15 minutes. The PCR products were electrophoresed on a 1.5% agarose gel, and the resulting gel electrophoresis was photographed and recorded under UV light.
After identifying the VNTR loci of the A. flavus isolates, a dendrogram was created using PHYLOViZ version 2.0 software. The Simpson's Index of Diversity (SID) for each locus across all tested isolates was calculated using the Comparing Partitions online software (20).
3.5. Antifungal Susceptibility Testing
The broth microdilution method, as described by CLSI-M38A2, was used to determine the minimum inhibitory concentrations (MICs) of AMB, ITR, VOR, POS, ISA, luliconazole (LUL), and lanoconazole (LAN) (Sigma-Aldrich, USA) (21). The final concentrations of polyene and triazole antifungals were prepared in the range of 0.032 - 16 µg/mL. For flucytosine (5-FC), the concentration range was 0.125 - 64 µg/mL, and for LAN and LUL, it was 0.016 - 8 µg/mL.
Conidial suspensions were obtained from sporulated A. flavus grown on Sabouraud dextrose agar (SDA) culture (HiMedia, India). The turbidity of the conidia was adjusted spectrophotometrically to optical densities between 0.09 and 0.11 at 530 nm and diluted 1:50 in RPMI 1640 broth (Sigma-Aldrich, USA). In each well of a microplate, 100 µL of the final conidial suspension was added to 100 µL of each antifungal concentration.
The MIC was defined as the lowest drug concentration that inhibited growth by 100% after 48 hours, compared to the growth of the controls. Candida parapsilosis ATCC22019 and C. krusei ATCC6258 isolates were used as quality control strains (22).
4. Results
The mean age in the present study was 53.4 years (range: 27 - 79 years). Of the participants, 38 (58.46%) were male, and 27 (41.54%) were female. The β-tubulin gene sequences for all A. flavus strains were deposited in GenBank and registered under the National Center for Biotechnology Information (NCBI) accession numbers PQ415656, PQ415659–PQ415711 and PQ422102–PQ422113.
The results of AFST for eight antifungal drugs across all A. flavus strains are shown in Table 2. The geometric mean minimum inhibitory concentration (GM-MIC), from lowest to highest, was obtained as follows: LUL (0.020 μg/mL), LAN (0.021 μg/mL), POS (0.089 μg/mL), ISA (0.115 μg/mL), ITR (0.220 μg/mL), VOR (0.244 μg/mL), AMB (0.870 μg/mL), and 5-fluorocytosine (58.76 μg/mL) (Table 2).
Table 2.MIC50, MIC90, Geometric Mean Minimum Inhibitory Concentration, and MIC Ranges Values of 65 Clinical Aspergillus flavus Isolates to Eight Antifungal Agents
| Criteria | Antifungal Drugs | |||||||
|---|---|---|---|---|---|---|---|---|
| AMB | ITC | VRC | PSC | ISA | LUL | LAN | 5 - FC | |
| MIC50 (μg/mL) | 1 | 0.25 | 0.25 | 0.063 | 0.125 | 0.016 | 0.016 | 64 |
| MIC90 (μg/mL) | 2 | 0.5 | 0.5 | 0.25 | 0.25 | 0.032 | 0.032 | 64 |
| GM | 0.870 | 0.220 | 0.244 | 0.089 | 0.115 | 0.020 | 0.021 | 58.766 |
| MIC Range (μg/mL) | 0.125 - 4 | 0.032 - 0.5 | 0.063 - 0.5 | 0.032 - 0.25 | 0.032 - 0.5 | 0.016 - 0.25 | 0.016 - 0.25 | 64.0 - 64.0 |
Abbreviations: AMB, amphotericin B; ITC, itraconazole; VRC, voriconazole; PSC, posaconazole; ISA, isavuconazole; LUL, luliconazole; Lan, lanoconazole; 5-FC, 5-flucytosine; MIC, minimum inhibitory concentration; GM, geometric mean.
Multiple-locus variable number tandem repeat analysis analysis performed with PHYLOViZ software identified 65 genotypes (sequence types). None of the A. flavus isolates were identical in terms of allelic profiles (Figure 1). Based on a cut-off value of 1.5, 19 clusters and 4 singleton were determined for the 65 clinical isolates of A. flavus. According to the goeBURST phylogenetic tree, out of the 65 isolates, only 5 (7.7%) differed in 2 loci, while the remaining isolates differed in at least 3 or 4 loci.
Simpson's VNTR diversity index indicated that the AFPM7 marker, with SID = 0.901, was the most effective marker for differentiating among all strains.
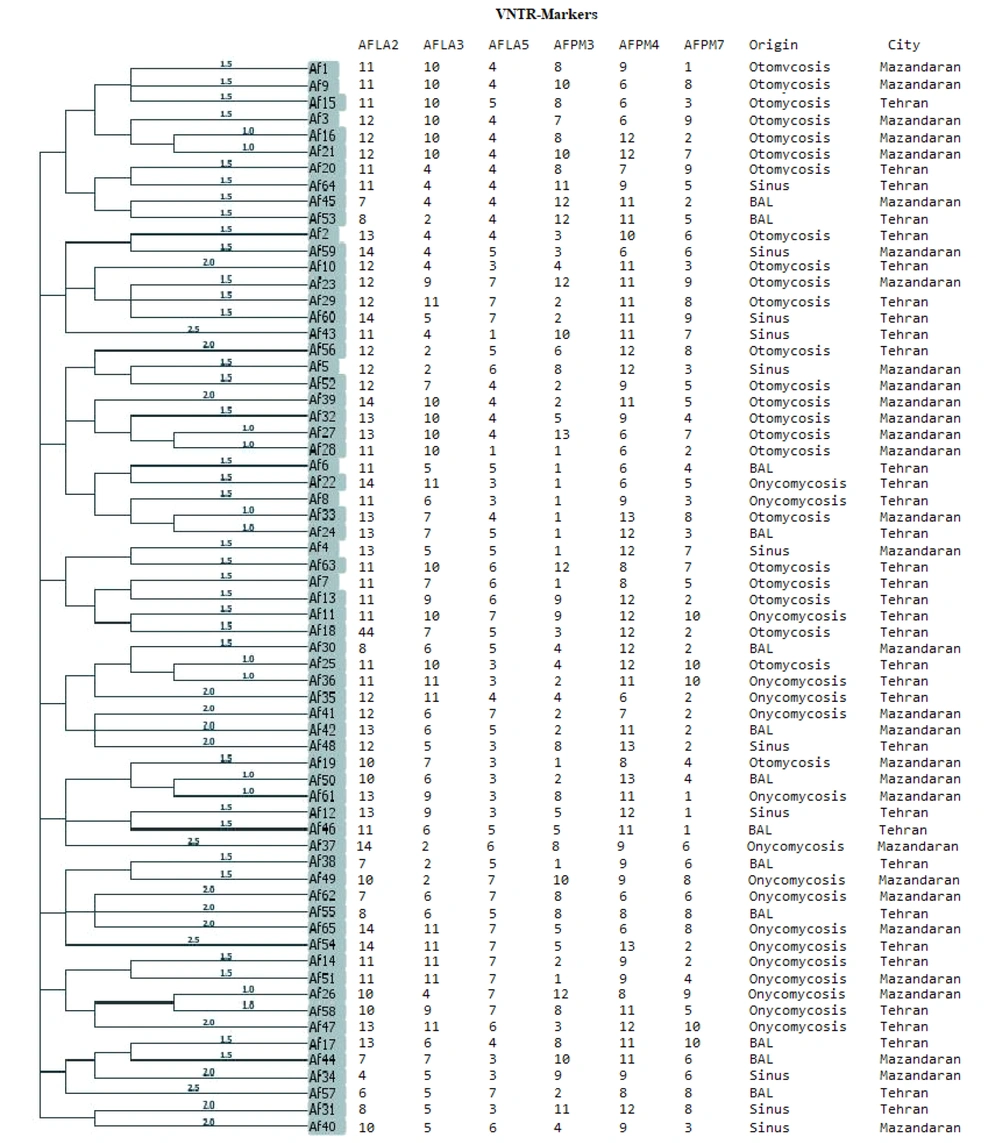
Figure 1.
Evolutionary phylogenetic tree creating from the analysis of six variable number tandem repeat (VNTR) marker gene loci of Aspergillus flavus isolates. In the tree, none of isolates has completely similar in Multiple locus variable-number tandem-repeat analysis (MVLA) patterns, as a result, these isolates are completely dissimilar.
5. Discussion
Epidemiologically, the prevalence of A. flavus is more frequently reported in countries with dry and semi-arid climates, such as India, Iran, Saudi Arabia, Qatar, and Sudan (10, 15, 23, 24). A retrospective study in Iran showed that the prevalence of A. flavus exceeds that of other Aspergillus species (10). Our results indicated that the MIC50 of 65 isolates of A. flavus was as follows: Amphotericin B (1 µg/mL), ITR (0.25 µg/mL), VOR (0.25 µg/mL), POS (0.063 µg/mL), ISA (0.125 µg/mL), luliconazole (0.016 µg/mL), lanoconazole (0.016 µg/mL), and 5-fluocytosine (64 µg/mL). The in vitro AFST data indicated that all the tested antifungals demonstrated good activity, except for AMB and 5-fluocytosine.
Gheith et al. reported MIC50 values for clinical isolates of A. flavus isolated from patients with hematologic malignancies in Tunisia as follows: Amphotericin B (6 μg/mL), ITR (0.5 μg/mL), VOR (0.19 μg/mL), POS (0.19 μg/mL), and CAS (0.64 μg/mL) (25). Pfaller et al. reported MIC50 values of ITR (0.5 μg/mL), POS (0.25 μg/mL), ravuconazole (0.5 μg/mL), and VOR (0.5 μg/mL) against 76 A. flavus isolates (26).
Shivaparkash et al. analyzed the AFST profiles of triazoles against 188 isolates of A. flavus collected from India using the CLSI method. Posaconazole exhibited the highest activity (GM MIC, 0.123 mg/L), followed by ITR (GM MIC, 0.177 mg/L), ISA (GM MIC, 0.697 mg/L), and VOR (GM MIC, 1.167 mg/L) (27). In the study by Vanathi et al., MICs against A. flavus were reported as follows: Amphotericin B (0.5 - 16 μg/mL), VOR (0.025 - 4 μg/mL), ITR (0.125 - 8 μg/mL), and POS (0.047 - 0.25 μg/mL) (28).
Although no drug susceptibility breakpoints exist for A. flavus, there is a consensus on the epidemiological cutoff values (ECVs) for A. flavus strains: Posaconazole 0.5 mg/L, ITR 1 mg/L, VOR 1 mg/L, ISA 1 mg/L, and AMB 4 mg/L (19). In the present study, all azoles tested showed good activity against all A. flavus strains, consistent with previous reports (29-32). Our AFST results indicated that luliconazole and lanoconazole demonstrated low MICs (GM = 0.020 μg/mL, with a range of MIC = 0.016 - 0.25 μg/mL) against all A. flavus strains. Similarly, in a study by Abastabar et al. (33), luliconazole and lanoconazole exhibited the lowest MICs against sensitive and resistant A. fumigatus isolates compared to those of other antifungal drugs. The analysis of our AFST data revealed that the GM MIC value of luliconazole was lower than that of lanoconazole against all tested strains.
Although no preparation for systemic administration of these antifungals is currently available, in vivo studies in animal models have demonstrated that these antifungals are highly effective for managing invasive aspergillosis compared to other drugs (34). Our results indicated that the MICs for AMB were higher than those for other antifungals, consistent with the study by Moslem and Zarei Mahmoudabadi, which reported MICs of AMB ≥ 8 μg/mL (35). These findings align with previous studies conducted in Europe (36, 37) and the Middle East (8, 38, 39). These differences may be attributed to variations in strains isolated from different specimens, the sample sizes of investigated strains, antifungal treatments, different AFST guidelines, and varying breakpoints applied for MIC determination.
In the present study, all clinical strains were found to be dissimilar, with distinctive genotype profiles. The strains were collected from different patients in two separate regions of Iran. Consistent with our findings, high genetic diversity in A. flavus has been observed in clinical isolates obtained from humans (9) and animal infections (40). Moreover, a prior study by Mohammadi et al. indicated that clinical and environmental A. fumigatus isolates clustered separately from each other (41). In line with the present study, Hadrich et al. used a suitable microsatellite marker for typing 63 isolates of A. flavus, employing a combination of 12 markers with a discriminatory power of 0.97, while a combination of 5 markers (AFM7, AFM3, AFLA7, AFLA3, AFLA1) showed a discriminatory power of 0.952 (42). Rudramurthy et al. genotyped 162 clinical isolates of A. flavus using 9 microsatellite markers, reporting a polymorphic rate of 33 alleles for these markers. The discriminatory power of each marker ranged from 0.954 to 0.657. Similar to the present study, their genotyping results did not show a significant relationship between the existing genotypes and different clinical forms (43).
Guarro et al., using the microsatellite technique for genotyping Aspergillus spp. from a hospital infection, reported 28 genotypes of A. fumigatus and 23 genotypes of A. flavus (44). Khodavaisy et al. reported the genotyping of 143 clinical and environmental isolates of A. flavus using nine microsatellite markers, identifying 118 different genotypes. The discriminatory power of these nine markers for all isolates ranged from 0.9457 to 0.4812 (9).
The differences between our results and those of other studies may be attributed to factors such as the type of strain, geographical region, source of samples, and the number and type of microsatellite markers used. A limitation of the present study is that AFST for echinocandin groups against A. flavus strains was not performed. Understanding the associations between the genotypes of strains and clinical disease (12)—which may vary across regions—and therapeutic modalities, including AFST patterns of causative agents against a panel of systemic drug compounds (45), is an important advantage for clinicians, mycology laboratories, and healthcare specialists. Such insights may help guide personalized treatment.
5.1. Conclusions
In conclusion, our results demonstrated that A. flavus isolates were highly sensitive to luliconazole, lanoconazole, and POS, whereas AMB did not exhibit strong activity against A. flavus. Typing of isolates collected from clinical samples revealed that A. flavus possesses a wide genetic diversity. The microsatellite typing method (MLVA assay) showed very high discriminatory power for studying the molecular epidemiology of clinical isolates of A. flavus. Additionally, no significant relationship was observed between the different genotypes of A. flavus and their AFST profiles.


