


1. Background
2. Objectives
3. Methods
3.1. Pseudomonas aeruginosa Clinical Isolates
3.2. Antibiotic Susceptibility
3.3. Quantification Biofilm Assay
3.4. Bacterial DNA Extraction
3.5. Polymerase Chain Reaction
3.6. Statistical Analysis
4. Results
4.1. Antibiotic Resistance
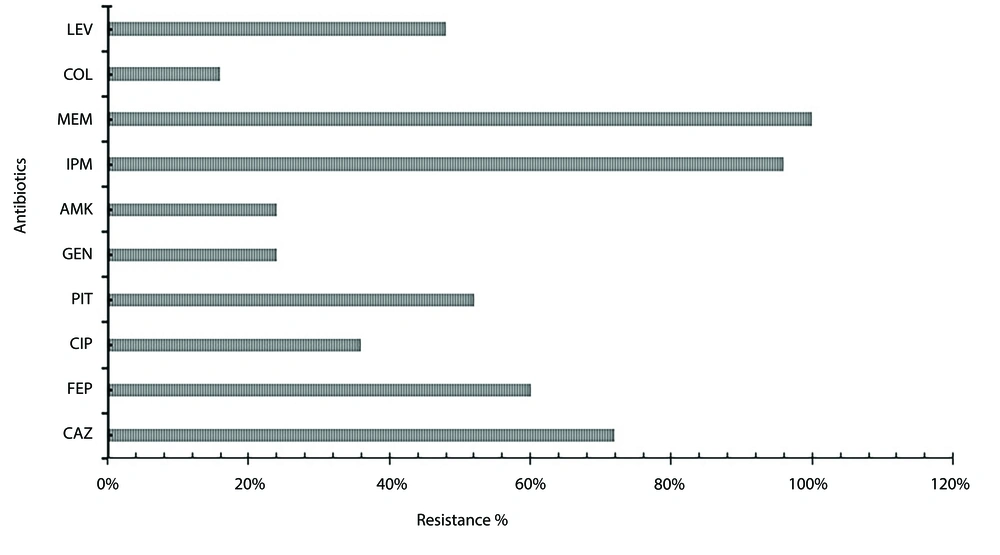
Antibiotic resistance percentage of Pseudomonas aeruginosa clinical isolates. Figure 1 represents the clinical isolates of P. aeruginosa, which showed the highest resistance with antibiotic meropenem (MEM) and imipenem (IPM) (96 - 100%), moderate resistance with antibiotics ceftazidime (CAZ), cefepime (FEP), piperacillin-tazobactam (PIT), and levofloxacin (LEV) (72 - 48%) and the least resistance were observed with antibiotics gentamicin (GEN), amikacin (AMK) and colistin (COL) (24 - 16%).
4.2. Demographics
| Variables | Strains (n = 25) | |||
|---|---|---|---|---|
| R | MDR | XDR | P-Value | |
| Age | 0.125 | |||
| 0 - 10 | 1 (4) | 0 (0) | 1 (4) | |
| 11 - 20 | 0 (0) | 0 (0) | 0 (0) | |
| 21 - 30 | 0 (0) | 2 (8) | 1 (4) | |
| 31 - 40 | 0 (0) | 0 (0) | 0 (0) | |
| 41 - 50 | 0 (0) | 0 (0) | 1 (4) | |
| 51 - 60 | 3 (12) | 0 (0) | 1 (4) | |
| 61 - 70 | 2 (8) | 3 (12) | 0 (0) | |
| 71 - 80 | 3 (12) | 1 (4) | 1 (4) | |
| 81 - 90 | 1 (4) | 4 (16) | 0 (0) | |
| Gender | 0.403 | |||
| Male | 7 (28) | 4 (16) | 2 (8) | |
| Female | 3 (12) | 6 (24) | 3 (12) | |
| Type of specimen | 0.679 | |||
| Sputum | 6 (24) | 6 (24) | 3 (12) | |
| Wound | 3 (12) | 4 (16) | 1 (4) | |
| Abdominal wall | 1 (4) | 0 (0) | 0 (0) | |
| Ear swab | 0 (0) | 0 (0) | 1 (4) | |
| Disease condition | 0.592 | |||
| Diabetes mellitus | 5 (20) | 2 (8) | 1 (4) | |
| Cardiopulmonary arrest | 1 (4) | 0 (0) | 0 (0) | |
| Encephalitis | 0 (0) | 1 (4) | 0 (0) | |
| Immunodeficiency | 0 (0) | 0 (0) | 1 (4) | |
| Ovarian mass | 0 (0) | 1 (4) | 0 (0) | |
| Pneumothorax | 0 (0) | 1 (4) | 0 (0) | |
| Sepsis | 4 (16) | 4 (16) | 2 (8) | |
| Traumatic brain injury | 0 (0) | 1 (4) | 1 (4) | |
| Biofilm formation genes positive | 0.721 | |||
| algD | 9 (36) | 8 (32) | 5 (20) | |
| pelF | 4 (16) | 10 (40) | 3 (12) | |
| pslD | 9 (36) | 10 (40) | 5 (20) | |
| Biofilm formation strains | 0.502 | |||
| Strong biofilm formation | 3 (12) | 5 (20) | 3 (12) | |
| Moderate biofilm formation | 7 (28) | 4 (16) | 2 (8) | |
| Weak biofilm formation | 0 (0) | 1 (4) | 0 (0) | |
Abbreviations: R, resistant; MRD, multidrug resistance; XDR, extensively drug resistance.
4.3. Specimen and Disease Condition
4.4. Biofilm Formation Genes
| Pseudomonas aeruginosa Strains | algD | pelF | pslD | Resistant Phenotype |
|---|---|---|---|---|
| PA1 | + | + | + | MDR |
| PA2 | + | + | + | R |
| PA3 | - | + | + | MDR |
| PA4 | + | + | + | XDR |
| PA5 | + | - | + | R |
| PA6 | + | - | + | XDR |
| PA7 | + | - | + | XDR |
| PA8 | + | - | + | R |
| PA9 | - | - | + | R |
| PA10 | + | + | + | R |
| PA11 | + | + | + | MDR |
| PA12 | + | + | + | MDR |
| PA13 | + | + | + | MDR |
| PA14 | + | + | + | MDR |
| PA15 | + | + | + | MDR |
| PA16 | + | + | + | R |
| PA17 | + | - | + | R |
| PA18 | + | + | + | XDR |
| PA19 | + | + | + | XDR |
| PA20 | + | + | + | MDR |
| PA21 | + | - | + | R |
| PA22 | - | + | + | MDR |
| PA23 | + | - | + | R |
| PA24 | + | + | + | MDR |
| PA25 | + | + | - | R |
| PAO1 | + | - | + | R |
Abbreviations: R, resistant; MRD, multidrug resistance; XDR, extensively drug resistance.
a Correlation analysis of algD in comparison with resistance phenotype r = 0.065, P ≤ 0.755; correlation analysis of pelF in comparison with resistance phenotype r = 0.275, P ≤ 0.183; correlation analysis in comparison with resistance phenotype r = 0.218; P ≤ 0.295.
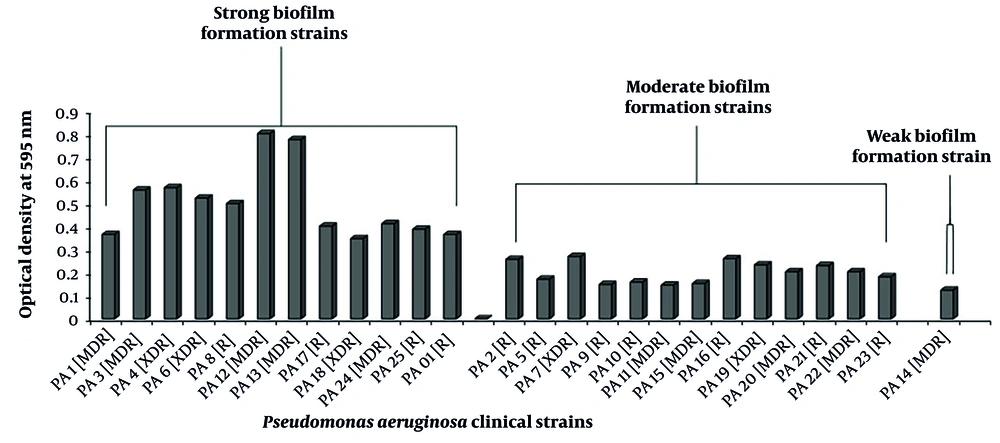
Evaluation of biofilm formation capacity in Pseudomonas aeruginosa clinical isolates. R, resistant; MDR, multidrug resistance; XDR, extensively drug resistance. Correlation analysis in comparison with resistance phenotype r = 0.188, P ≤ 0.366 (OD ≤ 0.071 non-biofilm; OD ≤ 0.071 - 0.142 wk; OD ≤ 0.142 - 0.284 moderate; OD ≤ 0.284 high).


