


1. Background
2. Objectives
3. Methods
3.1. Patients
3.1.1 Inclusion Criteria
3.1.2. Exclusion Criteria
3.2. Clinical Data Collection
3.3. Pediatric Early Warning Score
3.4. Video Electroencephalogram Monitoring
3.5. Measurement of Serum Neuron-Specific Enolase
3.6. Prognostic Assessment
3.7. Statistical Analyses
4. Results
4.1. Pediatric Early Warning Score and Serum Neuron-Specific Enolase Levels in Children with Viral Encephalitis
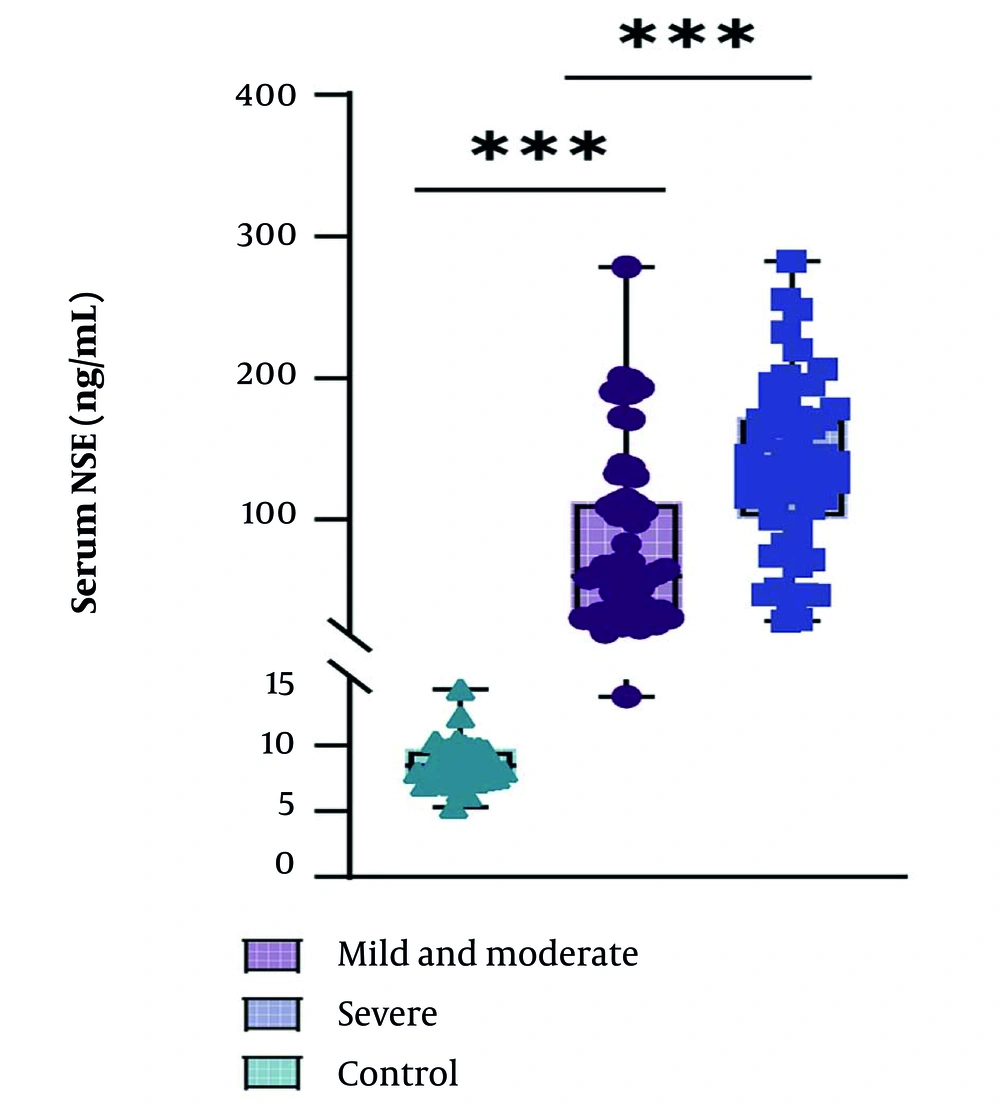
Serum neuron-specific enolase (NSE) levels in children with mild-moderate symptoms and severe symptoms (*** P < 0.001).
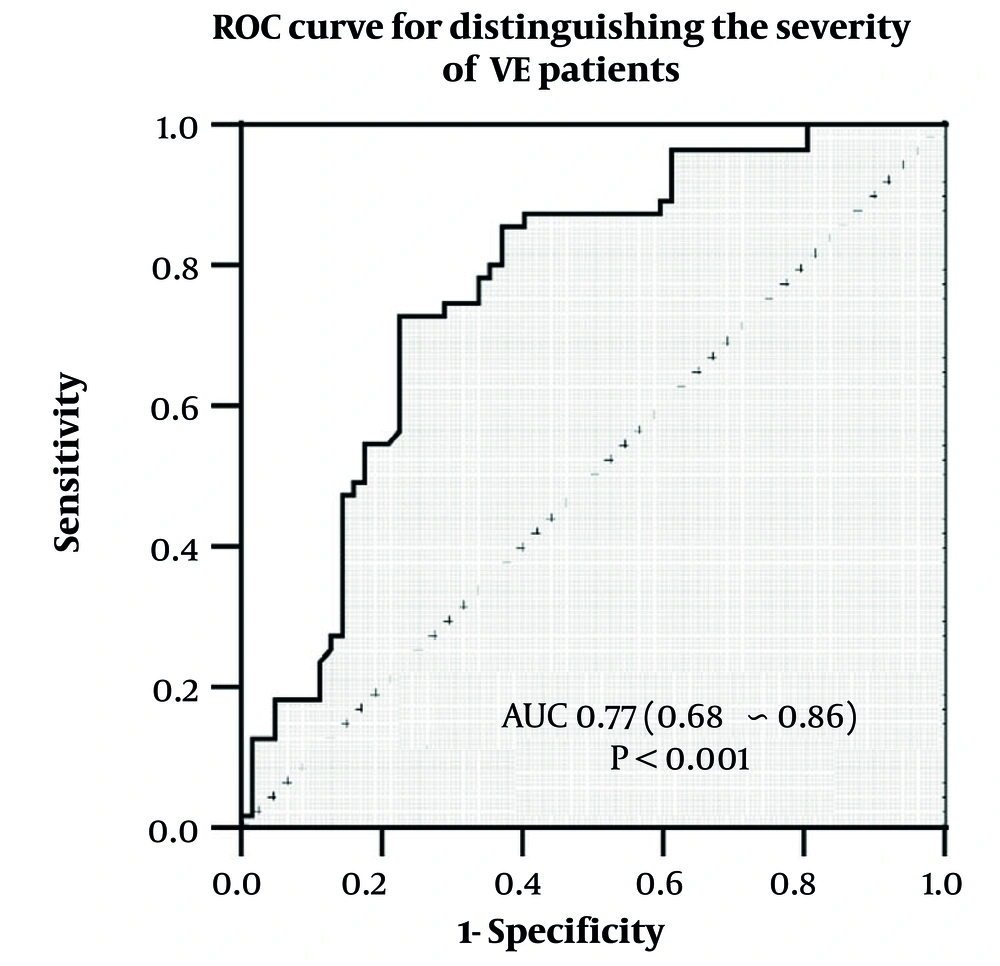
Receiver operating characteristic (ROC) curves to assess the potency of serum neuron-specific enolase (NSE) levels to differentiate between patients with different degrees of viral encephalitis (VE) (Abbreviation: AUC, area under the ROC curve).
4.2. Prognosis and Clinical Characteristics of Children with Viral Encephalitis
| Variables | Poor Prognosis (N = 32) | Good Prognosis (N = 85) | P-Value d |
|---|---|---|---|
| Gender | 0.892 | ||
| Male | 14 (43.75) | 36 (42.35) | |
| Female | 18 (56.25) | 49 (57.64) | |
| Age (y) | 6.46 ± 1.14 | 6.06 ± 1.04 | 0.071 |
| Fever (> 39°C) | 18 (56.25) | 32 (37.65) | 0.07 |
| Vomiting | 7 (21.88) | 20 (23.53) | 0.85 |
| Headache | 12 (37.50) | 29 (34.11) | 0.732 |
| Disturbance of consciousness | 7 (21.88) | 7 (8.23) | 0.043 |
| Convulsion | 20 (62.5) | 30 (35.29) | 0.008 |
| Convulsion time (min) | |||
| < 5 | 11 (84.62, 11.13) | 26 (96.30, 26.29) | 0.189 |
| > 5, < 30 | 2 (15.38, 2.13) | 1 (3.70, 1.27) | |
| Movement disorder | 6 (18.75) | 12 (14.11) | 0.57 |
| Mental disorder | 1 (3.13) | 0 (0.00) | 0.274 |
| VEEG | < 0.001 | ||
| Mild abnormality | 7 (21.88) | 50 (58.82) | |
| Moderate abnormality | 13 (40.62) | 25 (29.41) | |
| Severe abnormality | 12 (37.50) | 10 (11.76) | |
| Hyponatremia | 11 (34.38) | 15 (17.65) | 0.052 |
| Hypokalemia | 4 (12.50) | 9 (10.59) | 0.749 |
| White blood cell count (× 109/L) | 12.13 ± 2.47 | 11.85 ± 2.14 | 0.558 |
| CRP (mg/dL) | 7.50 ± 3.20 | 5.60 ± 2.47 | 0.001 |
| PCT (μg/L) | 6.25 ± 2.3 | 4.36 | 0.47 |
| PEWS | 3 [2, 4] | 1 [1, 3] | < 0.001 |
| NSE (ng/mL) | 129.38 [65.20, 197.46] | 102.75 [36.96, 137.3] | < 0.001 |
Abbreviations: VEEG, video electroencephalogram; CRP, C-reactive protein; PCT, procalcitonin; PEWS, pediatric early warning score; NSE, neuron-specific enolase.
a Values are expressed as No. (%), mean ± standard deviation (SD), or median [IQR].
b Categorical values were compared using the chi-square test or Fisher's exact test.
c Student's t-test or Mann-Whitney test was used to assess the difference between the two groups of continuous values.
d P-value < 0.05 was statistically significant.
4.3. A Clinical Model for Poor Prognosis in Children with Viral Encephalitis Based on Pediatric Early Warning Score and Serum Neuron-Specific Enolase
| Variables | Model 1 b | Model 2 c | Model 3 d | ||||||
|---|---|---|---|---|---|---|---|---|---|
| β | P | OR (95% CI) | β | P | OR (95% CI) | β | P | OR (95% CI) | |
| Intercept | -3.79 | < 0.001 | 0.09 (0.06 - 0.25) | -3.99 | < 0.001 | 0.06 (0.01 - 0.15) | -4.91 | < 0.001 | 0.03 (0.01 - 0.09) |
| Disturbance of consciousness | |||||||||
| 0 | - | - | 1.00 (reference) | - | - | 1.00 (reference) | - | - | 1.00 (reference) |
| 1 | 0.16 | 0.859 | 1.17 (0.20 - 6.79) | 0.09 | 0.916 | 1.10 (0.19 - 6.18) | 0.5 | 0.906 | 1.05 (0.23 - 5.71) |
| Disturbance of consciousness | |||||||||
| 0 | - | - | 1.00 (reference) | - | - | 1.00 (reference) | - | - | 1.00 (reference) |
| 1 | 0.74 | 0.469 | 2.09 (0.28 - 15.42) | 1.07 | 0.296 | 3.22 (0.36 - 29.03) | 0.98 | 0.249 | 2.66 (0.50 - 3.64) |
| Hyponatremia | |||||||||
| 0 | - | - | 1.00 (reference) | - | - | 1.00 (reference) | - | - | 1.00 (reference) |
| 1 | 0.57 | 0.422 | 1.77 (0.44 - 7.14) | 0.32 | 0.666 | 1.38 (0.32 - 5.88) | 0.14 | 0.818 | 1.15 (0.36 - 3.64) |
| VEEG | |||||||||
| 1 | - | - | 1.00 (reference) | - | - | 1.00 (reference) | - | - | - |
| 2 | 0.07 | 0.166 | 1.07 (0.78 - 6.47) | 0.7 | 0.31 | 0.78 (0.58 - 5.52) | 0.23 | 0.425 | 0.80 (0.60 - 6.12) |
| 3 | -0.66 | 0.0.062 | 0.94 (0.90 - 8.27) | - 0.76 | 0.192 | 0.88 (0.75 - 6.27) | - 0.95 | 0.105 | 0.88 (0.72 - 5.98) |
| CRP | 0.39 | 0.04 | 1.48 (1.14 - 1.93) | 0.31 | 0.035 | 1.56 (1.04 - 1.92) | 0.43 | 0.023 | 1.48 (1.06 - 2.07) |
| PEWS | - | - | - | 0.09 | 0.044 | 1.40 (1.01 - 1.52) | 0.02 | 0.066 | 1.82 (0.98 - 2.82) |
| Serum NSE | - | - | - | - | - | - | 0.01 | 0.001 | 1.05 (1.01 - 1.02) |
Abbreviations: OR, odd ratio; VEEG, video electroencephalogram; CRP, C-reactive protein; PEWS, pediatric early warning score; NSE, neuron-specific enolase.
a Values are expressed as 95% confidence interval (CI).
b Clinical factors (disturbance of consciousness, disturbance of consciousness, hyponatremia, VEEG, and CRP).
c Incorporation of PEWS score based on base model.
d Incorporation of serum NSE based on model 2.
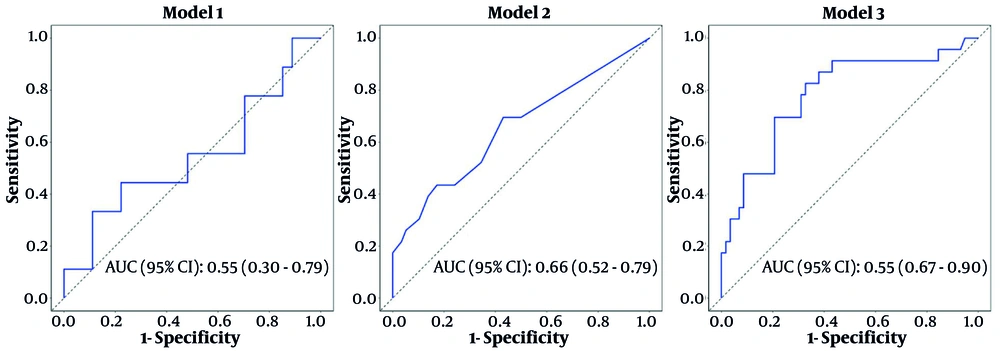
Model-based receiver operating characteristic (ROC) curves to assess the predictive value of the model (abbreviation: 95% CI, 95% confidence interval).
| Models | Cut-off | AUC | Accuracy | Sensitivity | Specificity | PPV | NPV |
|---|---|---|---|---|---|---|---|
| Model 1 b | 0.232 | 0.55 (0.30 - 0.79) | 0.50 (0.33 - 0.67) | 0.52 (0.33 - 0.71) | 0.44 (0.12 - 0.77) | 0.74 (0.54 - 0.93) | 0.24 (0.03 - 0.44) |
| Model 2 c | 0.26 | 0.66 (0.52 - 0.79) | 0.60 (0.49 - 0.71) | 0.57 (0.44 - 0.70) | 0.70 (0.51 - 0.88) | 0.82 (0.71 - 0.94) | 0.39 (0.24 - 0.54) |
| Model 3 d | 0.217 | 0.78 (0.67 - 0.90) | 0.72 (0.60 - 0.81) | 0.67 (0.55 - 0.79) | 0.83 (0.67 - 0.98) | 0.91 (0.82 - 0.99) | 0.50 (0.34 - 0.66) |
Abbreviations: AUC, area under the receiver operating characteristic (ROC) curve; PPV, positive predictive value; NPV, negative predictive value.
a Values are expressed as 95% confidence interval (CI).
b Clinical factors (disturbance of consciousness, disturbance of consciousness, hyponatremia, VEEG, and CRP).
c Incorporation of pediatric early warning score (PEWS) based on base model.
d Incorporation of serum neuron-specific enolase (NSE) based on model 2.


