
1. Background
Malaria, a vector-borne disease caused by Plasmodium parasites, remains a pressing global health challenge, with approximately 247 million cases and 619,000 deaths reported in 2021 (WHO, 2022). Despite advancements in prevention and treatment, the disease persists as a significant burden, underscoring the need for context-specific strategies to achieve control and elimination (1, 2). Climate change has amplified concerns about the spread of vector-borne diseases, with rising temperatures, humidity, and rainfall influencing mosquito breeding and malaria transmission (3). In Chabahar, southeastern Iran, monsoon patterns and temperatures of 25 - 35°C create ideal conditions for Anopheles mosquito proliferation, exacerbating malaria transmission in both urban and rural areas. Cross-border migration from malaria-endemic countries like Pakistan and Afghanistan further complicates the situation.
2. Objectives
The present study aims to analyze malaria trends in Chabahar and its surrounding areas from 2019 to 2024, focusing on the impact of climatic factors, cross-border migration, and demographic determinants. By identifying key challenges and contributing factors, this research seeks to inform targeted strategies for malaria control and elimination in southeastern Iran. The prevalence of Plasmodium vivax in the region, combined with genetic factors like G6PD deficiency and thalassemia, further adds to the complexity of malaria management (4, 5).
3. Methods
3.1. Study Areas
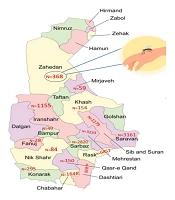
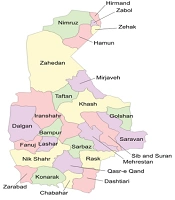
Chabahar, located in the Sistan-Baluchistan province of southeastern Iran, was selected as the study area due to its high malaria burden and unique ecological and demographic characteristics (Figure 1). The district comprises three urban centers and six rural districts (Pirsohrab, Kambed-e Soleyman, Nowbandian-e Payyan, Bahoukalat, Sand-e-Mirsuban, and Polan), encompassing 446 inhabited villages. Situated on the northern coast of the Oman Sea, Chabahar’s warm and humid climate provides ideal conditions for Anopheles species, the primary vectors of malaria in the region (6). The majority of the population is ethnic Baloch, with Balochi and Persian being the predominant languages, reflecting the area’s cultural and linguistic diversity (7).
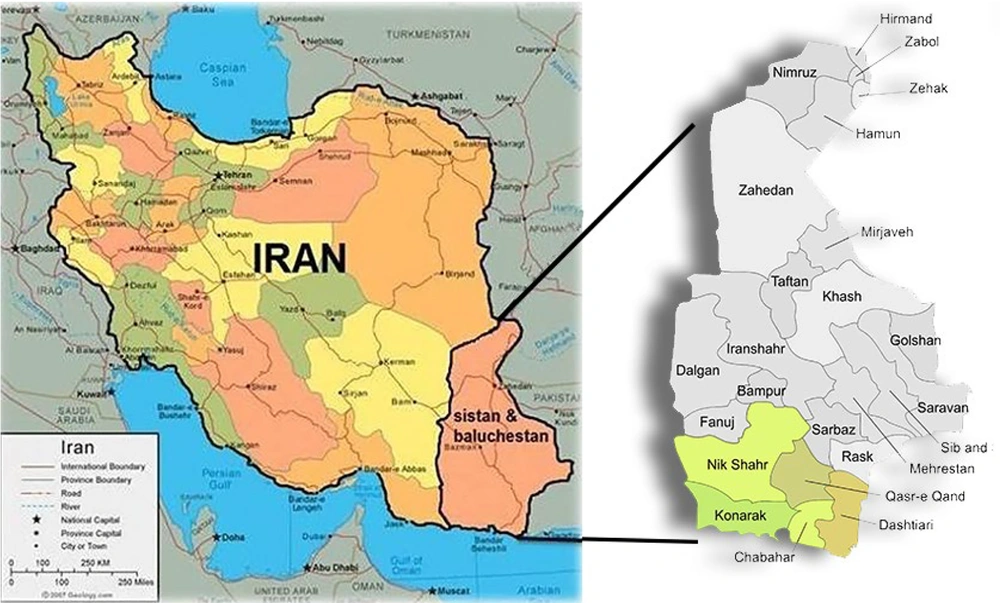
Figure 1.
The geographical location of Chabahar city and its suburbs (Konarak, Qasr-e Qand, Nik Shahr, Dashtiari) on the map is shown at the bottom of the map.
3.2. Study Design and Data Collection
This retrospective, cross-sectional study analyzed malaria cases in Chabahar and its surrounding areas from 2019 to 2024. Blood samples were collected from individuals presenting with malaria-like symptoms at health centers across the district. Malaria diagnosis was confirmed using Giemsa-stained blood smears and rapid diagnostic tests (RDTs) targeting Plasmodium-specific antigens (pLDH/HRP2). A standardized questionnaire was administered to collect demographic data, including age, sex, nationality, and travel history. Comprehensive malaria diagnoses were performed in multiple laboratories across Chabahar and its suburbs, with data gathered through a computerized system. Demographic data, including gender, age, and occupation, were recorded annually based on census data. Meteorological data, including maximum temperature, minimum temperature, average temperature, humidity, and precipitation, were sourced from local weather stations and cross-verified with national meteorological agencies to ensure reliability. All data were aligned temporally and spatially to match the study region and period, ensuring accurate analysis of the relationship between malaria incidence, weather patterns, and demographic factors. Missing data were handled using multiple imputation techniques, and quality control measures such as outlier analysis and data validation were implemented to ensure data accuracy and integrity.
3.3. Statistical Analysis
The statistical analysis explored the relationship between parasite type and various factors, including month and average temperature. Data were analyzed using the statistical package for the social sciences (SPSS), version 26.0. An analysis of variance (ANOVA) was performed to determine significant differences between groups, followed by Spearman’s correlation coefficients between environmental variables and type of parasitology to identify specific group differences. Results were reported as means ± standard deviations to accurately convey the data distribution. To compare seroprevalence rates across different groups, chi-square and Fisher’s exact tests were employed. A P-value of less than 0.05 was considered statistically significant, indicating a strong likelihood that the observed differences were not due to chance. This rigorous statistical approach ensured the validity and reliability of the findings, allowing for meaningful interpretations of the data in relation to the study’s objectives.
4. Results
Over the six-year study period from 2019 to 2024, a total of 3,393 malaria cases were documented in Chabahar, Iran, representing one of the highest burdens in the Sistan-Baluchistan province. The number of infections peaked significantly in 2023, with 1,272 reported cases, likely due to favorable climatic conditions for mosquito breeding and increased cross-border migration (Figure 2). Figure 2 illustrates the distribution of malaria cases by species and year, highlighting the dominance of P. vivax in 2023 - 2024.
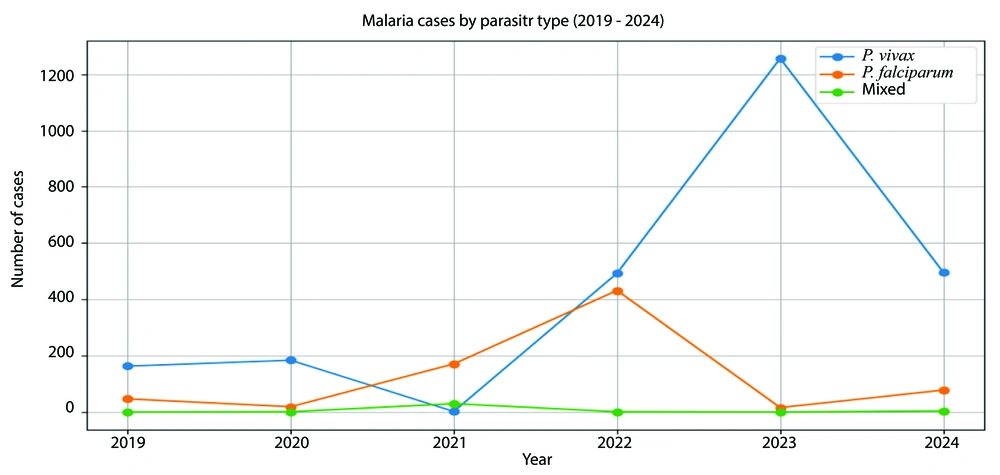
Figure 2.
Distribution of malaria cases by species of malaria and years in Chabahar city and its suburbs
4.1. Annual Trends and Demographics
Over the six-year study period, malaria incidence varied significantly, with the lowest number of cases (199) recorded in 2021 and a marked peak in 2023 (1,272 cases). The annual parasite incidence (API), a key metric for malaria prevalence, reached its highest in 2023 at 5.32 per 1,000 population before declining to 0.72 in 2024 (Table 1). The mean age of malaria patients fluctuated significantly, with a notable increase in 2022 to 29.42 years (P < 0.001). Gender distribution also varied, with male patients consistently comprising the majority, peaking at 81.6% in 2023 (Table 1).
Table 1.
Malaria Epidemiologic Indices and Demographic Variables in Chabahar City of Sistan-Baluchistan Province in the Years 2019 - 2024 a
| Indices | 2019 | 2020 | 2021 | 2022 | 2023 | 2024 | P-Value |
|---|---|---|---|---|---|---|---|
| Age | 26.45 ± 14.16 | 30.46 ± 14.32 | 25.87 ± 15.17 | 29.42 ± 17.46 | 26.77 ± 14.87 | 25.62 ± 14.73 | < 0.001 |
| Gender | < 0.001 | ||||||
| Male | 180 (85.7) | 178 (87.3) | 148 (72.9) | 678 (73.2) | 1038 (81.6) | 437 (75.6) | |
| Female | 30 (14.3) | 26 (12.7) | 55 (27.1) | 248 (26.8) | 234 (18.4) | 141 (24.4) | |
| Total population | 216295 | 222985 | 228703 | 233785 | 238867 | 241949 | - |
| API b | 0.97 | 0.91 | 0.87 | 3.96 | 5.32 | 0.72 | - |
| Parasites | < 0.001 | ||||||
| Plasmodiumvivax | 163 (77.6) | 184 (90.2) | 2 (1.0) | 493 (53.2) | 1256 (98.7) | 496 (85.8) | |
| Plasmodiumfalciparum | 47 (22.4) | 19 (9.3) | 171 (84.2) | 432 (46.7) | 16 (1.3) | 78 (13.5) | |
| Mixed | 0 (0) | 1 (0.5) | 30 (14.8) | 1 (0.1) | 0 (0.0 ) | 4 (0.7) |
Abbreviation: API, the annual parasite incidence.
a Values are expressed as No. (%) or mean ± SD.
b The annual parasite incidence is a crucial metric that illustrates the prevalence of malaria by indicating the number of cases per 1,000 population.
4.2. Parasite Distribution
There was a notable shift in the prevalence of Plasmodium species. Plasmodium vivax dominated in 2023 (98.7%) and 2024 (85.8%), while P. falciparum was predominant in 2021 (84.9%). Mixed infections were rare but showed a significant association with higher temperatures (P < 0.001) (Table 1).
4.3. Changes in Parasite Species
4.3.1. Species Distribution
There was a notable shift in the prevalence of Plasmodium species. Plasmodium vivax dominated in 2023 (98.7%) and 2024 (85.8%), while P. falciparum was predominant in 2021 (84.9%). This change was statistically significant (P < 0.001), indicating a shifting epidemiological landscape (Table 1).
4.3.2. Temperature Effects
Analysis revealed significant correlations between temperature and malaria transmission. Higher temperatures were strongly associated with increased incidence, particularly for mixed infections (P < 0.001). Mean temperatures for mixed infections were notably higher (33.631°C) compared to P. falciparum (31.563°C) and P. vivax (31.723°C), suggesting a robust association between temperature fluctuations and transmission dynamics (Figure 2).
4.4. Analysis of Meteorological Variables by Malaria Type
Figure 3 provides descriptive statistics and P-values for various meteorological variables across different types of malaria, including P. falciparum, P. vivax, and mixed infections. An analysis of key climatic factors — maximum temperature, minimum temperature, average temperature, average humidity, and precipitation — is presented across four groups: Mixed infections, P. falciparum, P. vivax, and total cases. For each variable, we report the sample size (n = 2), mean values, standard deviations, 95% confidence intervals (CIs) for the means, and associated P-values (Table 2).
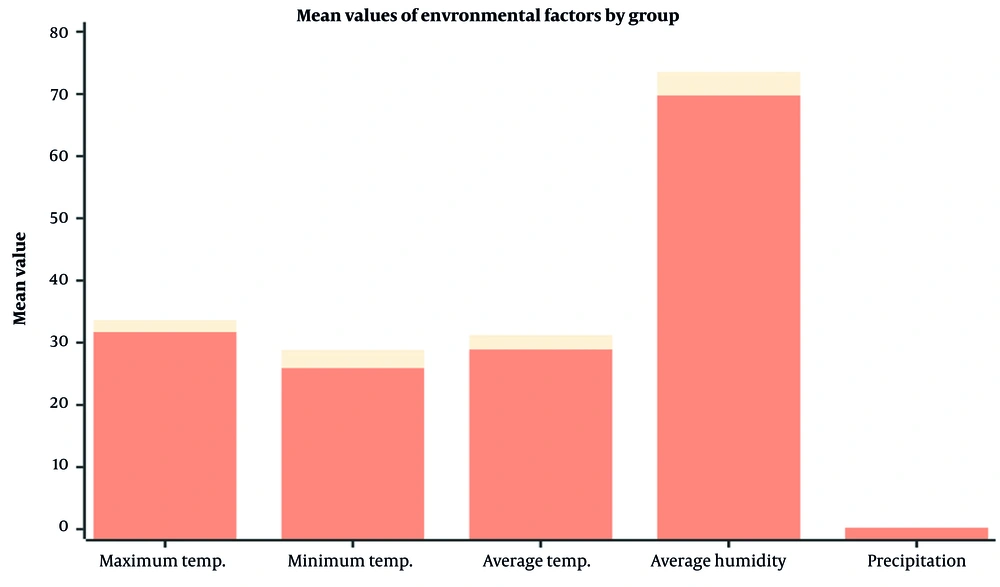
Figure 3.
Comparison of environmental factors (temperature, humidity, and precipitation) across malaria parasite groups (mix, Plasmodium falciparum, and Plasmodiumvivax)
Table 2.
Spearman’s Correlation Coefficients Between Environmental Variables and Type of Parasite, Chabahar City
| Factors | Correlation Coefficient | Significance (2-tailed) | N |
|---|---|---|---|
| Max. temperature | 0.024 | 0.163 | 3393 |
| Min. temperature | 0.048 a | 0.005 | 3393 |
| Average temperature | 0.039 b | 0.024 | 3393 |
| Average humidity (%) | 0.024 | 0.156 | 3393 |
| The amount of precipitation | 0.025 | 0.139 | 3393 |
a Correlation is significant at the 0.05 level (2-tailed).
b Correlation is significant at the 0.01 level (2-tailed).
4.4.1. Humidity and Precipitation
Average humidity and precipitation showed no significant impact on malaria transmission (P = 0.19 and P = 0.50, respectively), indicating that temperature is the primary climatic driver of malaria incidence in Chabahar (Figure 3).
4.4.2. Temperature Measurements
Significant statistical differences in maximum, minimum, and average temperatures were observed in the mixed infections group, as all reported P-values were < 0.001. This finding underscores a robust association between higher temperature levels and increased malaria incidence. This suggests that fluctuations in temperature could critically influence malaria transmission dynamics. Conversely, the data for P. falciparum and P. vivax exhibit no significant temperature relationships, indicating potential differences in the ecological or biological responses to climatic variations.
4.5. Key Implications
4.5.1. Temperature
Higher temperatures are strongly associated with mixed malaria infections, suggesting temperature fluctuations critically influence transmission dynamics.
4.5.2. Variability
Mixed infections exhibited more consistent exposure to higher temperatures (lower standard deviations) compared to P. vivax, potentially affecting transmission patterns.
4.5.3. Public Health
Temperature monitoring should be prioritized in malaria control strategies, as humidity and precipitation showed minimal impact. Predictive models based on temperature data could enhance proactive interventions.
4.5.4. Research Needs
Further studies are needed to explore the ecological and biological responses of P. falciparum and P. vivax to temperature variations, particularly threshold effects on parasite lifecycles.
In conclusion, temperature is a key climatic factor driving malaria transmission in Chabahar, with mixed infections showing distinct responses. Public health strategies should focus on temperature-based predictive models and interventions, while further research is needed to understand species-specific climatic adaptations.
4.5.5. Gender
Over time, there were fluctuations in the proportion of male and female malaria patients. Male patients fluctuated between 72.9% in 2021 and 81.6% in 2023, while female patients fluctuated between 12.7% in 2020 and 27.1% in 2021. The P-value for the gender variable is P < 0.001, indicating a statistically significant variation in the gender distribution of malaria patients across different years (Figure 4).
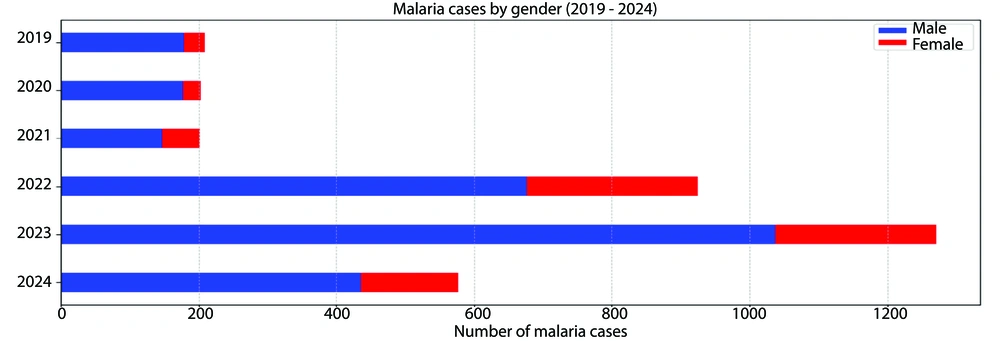
Figure 4.
Distribution of malaria cases by genus and year
4.6. Malaria Cases by Job Type and Type of Parasite
This document presents a bar chart that illustrates the distribution of malaria cases by job type and type of parasite. The data reflect different categories of employment and the prevalence of P. falciparum, P. vivax, and mixed infections. The total number of cases for each job category is also shown to provide context. Figure 5 provides information about the distribution of occupational categories among people who tested positive for the parasitic species of malaria.
Plasmodium falciparum shows the highest count in autumn, with a significant increase compared to spring and summer. The count remains high in winter (Figure 6). Plasmodium vivax exhibits a similar pattern to P. falciparum, increasing from spring to autumn. It remains consistently high in winter as well, with very similar numbers in autumn. Mixed infections occur less frequently across all seasons, peaking in summer with a noticeable drop in other seasons.
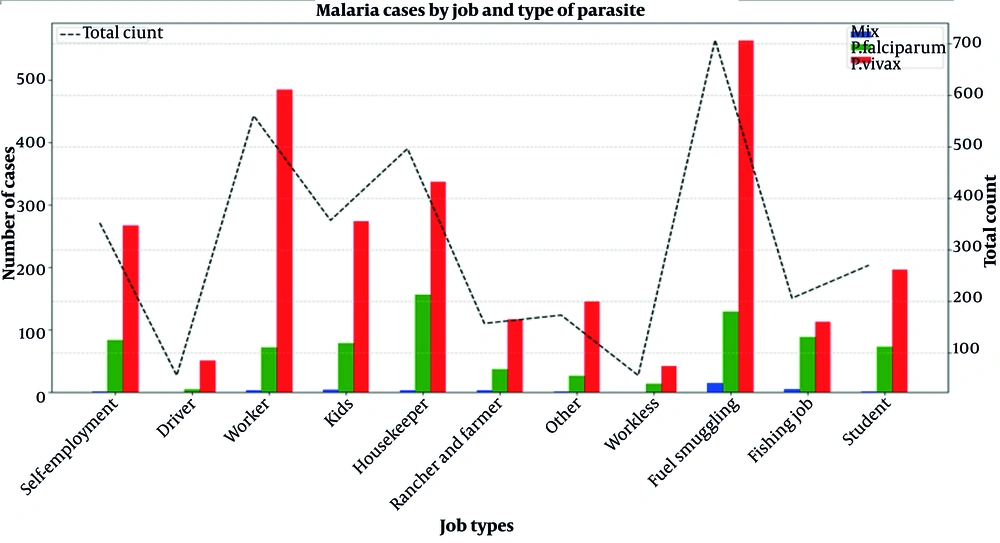
Figure 5.
Distribution of job categories among individuals testing positive for malaria parasites
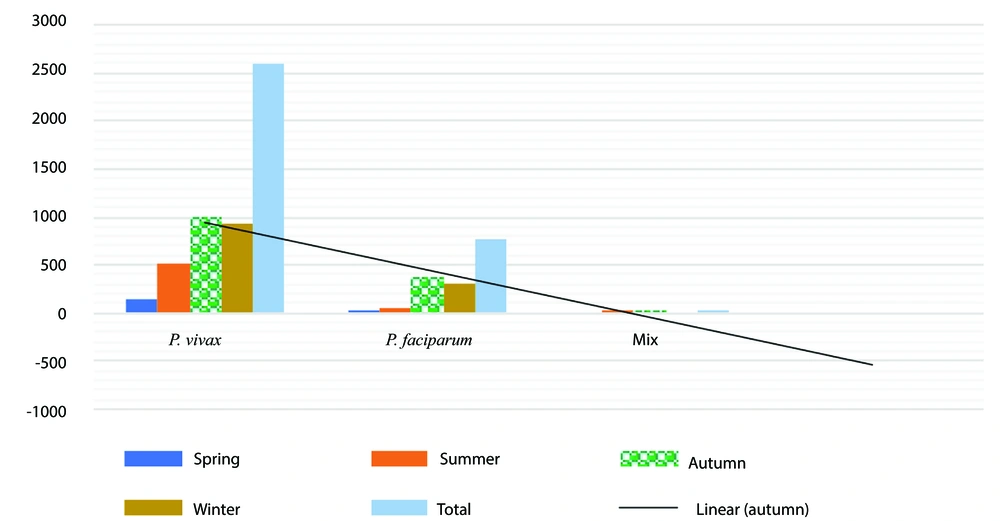
Figure 6.
Distribution of malaria cases by species of malaria and season
4.7. Analysis of Parasite Types by Nationality
In our study, we conducted a crosstabulation of malaria parasite types with the nationality of infected individuals. The data reveal significant differences in the prevalence of specific malaria parasites among Iranian, Pakistani, and Afghan populations.
4.7.1. Total Cases
The total number of malaria cases recorded in this study was 3,393, with the majority of infections identified as P. vivax (2,594 cases), followed by P. falciparum (763 cases) and mixed infections (36 cases).
4.7.2. Iranian Nationals
Among the Iranian population, P. vivax was the most prevalent type, with 1,677 cases. This indicates the enduring transmission dynamics of this species in Iran, which is often associated with relapsing malaria. Plasmodium falciparum cases were also significant, totaling 510, suggesting that severe malaria remains a concern in certain regions.
4.7.3. Pakistani Nationals
The data for Pakistani nationals show a considerable incidence of both P. falciparum (235 cases) and P. vivax (804 cases), indicating a diverse burden of malaria infections. The presence of mixed infections (12 cases) among this group also raises concerns regarding the complexities of treatment and potential resistance issues.
4.7.4. Afghan Nationals
The Afghan population showed the lowest total count, with 135 cases. The distribution revealed a stark predominance of P. vivax (113 cases) compared to P. falciparum (18 cases), which may reflect geographical factors influencing malaria transmission in Afghanistan.
Figure 7 shows the chart depicting the variations in malaria cases by different parasite types — trophozoite, schizont, gametocyte, and mixed infections — which is a crucial tool for understanding the epidemiological landscape of malaria in Chabahar city over five years. By categorizing the data into specific stages of the parasite lifecycle, the graph allows for a detailed analysis of the prevalence and distribution of P. vivax and P. falciparum, the two primary malaria-causing parasites in the region.
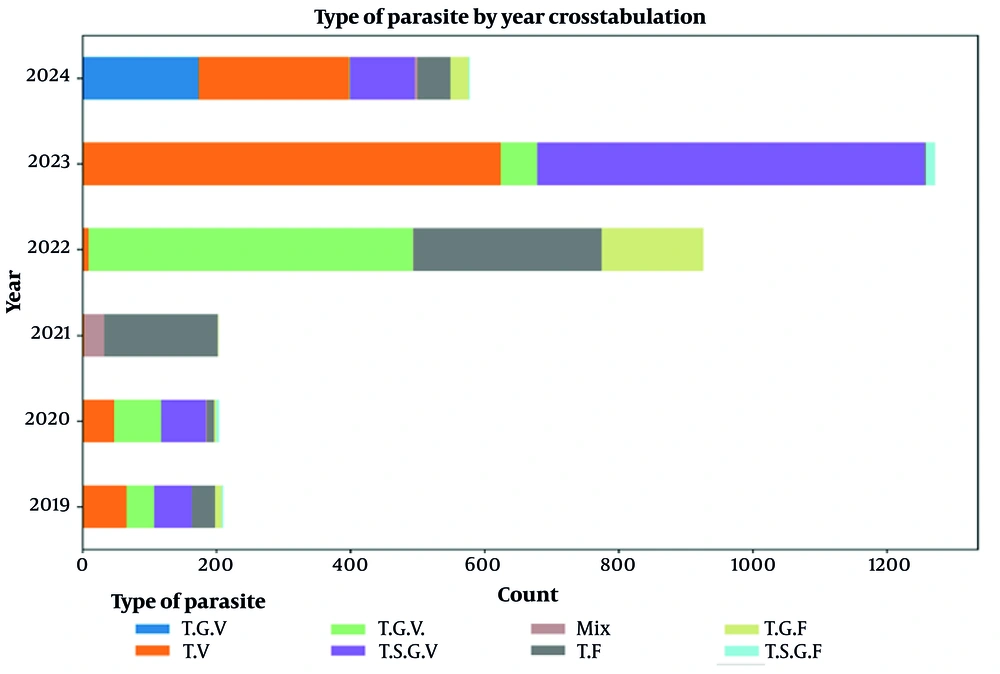
Figure 7.
Parasite stages of malaria seen in microscopic examination in Chabahar (2019 - 2024). This graph illustrates the variation in malaria cases by different parasite types (trophozoite, schizont, gametocyte, and mixed infections) observed during microscopic examinations from 2019 to 2024. The data highlights the temporal trends of Plasmodium vivax and Plasmodiumfalciparum infections over these six years. The abbreviations used for the stages of the parasite are T, trophozoite; V, P. vivax; S, schizont; G, gametocyte; F, P. falciparum, and mix: Infection of both P. vivax and P. falciparum; T.V: The trophozoite P. vivax parasitic stage.
Table 3 illustrates the distribution and percentage of different parasite types (mix, P. falciparum, and P. vivax) among collected samples based on age, nationality, previous history of malaria, and travel destination (no travel, inside the country, and abroad). The data shows the highest percentage of P. vivax parasites among those who traveled abroad (35.8%), while the lowest is for the mixed type in domestic travelers (0.1%).
Table 3.
Distribution and Percentage of Different Parasite Types
| Categories | Type of Parasite | Total | P-Value | ||
|---|---|---|---|---|---|
| Mix | Plasmodium falciparum | Plasmodium vivax | |||
| Travel | < 0.001 | ||||
| No | 3 (8.3) | 230 (30.1) | 594 (36.8) | 1187 (35.0) | |
| Inside the country | 3 (8.3) | 128 (16.8) | 425 (16.4) | 3 (8.3) | |
| Abroad | 30 (83.4) | 405 (53.1) | 1215 (46.8) | 1650 (48.6) | |
| Nationality | 0.021 | ||||
| Iranian | 20 (55.6) | 510 (66.8) | 1677 (64.6) | 2207 (65.0) | |
| Pakistani | 12 (33.3) | 235 (30.8) | 804 (31.0) | 1051 (31.0) | |
| Afghan | 4 (11.1) | 18 (2.4) | 113 (4.4) | 135 (4.0) | |
| Previous history of malaria | 0.32 | ||||
| No | 35 (97.2) | 731 (95.8) | 2453 (94.6) | 3219 (94.9) | |
| Yes | 1 (2.8) | 32 (4.2) | 141 (5.4) | 174 (5.1) | |
| Total | 36 (100.0) | 763 (100.0) | 2594 (100.0) | 3393 (100.0) | |
4.7.5. Inside the Country
Plasmodium vivax is predominant at 12.5%, but there is also a notable presence of P. falciparum. Plasmodium vivax remains the highest at 35.8%, with significant P. falciparum presence. Plasmodium vivax is consistently the most prevalent type across all travel categories. Traveling abroad shows the highest total count and percentage for all parasite types, indicating perhaps a higher risk or exposure during international travel.
5. Discussion
The epidemiological trends observed in Chabahar reflect a dynamic interplay of climatic, demographic, and cross-border factors that drive malaria transmission in southeastern Iran. The resurgence of P. vivax in 2023 - 2024 (98.7% and 85.8% of cases, respectively; (Table 1) contrasts starkly with the predominance of P. falciparum in 2021 (84.9%), underscoring ecological and operational influences. The dominance of P. vivax may stem from its ability to form hypnozoites, which enable relapses even during suboptimal transmission periods (8). This challenge is exacerbated by limited access to primaquine — a critical hypnozoitocidal drug — in Sistan-Baluchistan, where G6PD deficiency affects approximately 15% of the population (3). Conversely, the decline in P. falciparum after 2022 likely reflects the success of artemisinin-based combination therapies (ACTs), which disproportionately target P. falciparum due to its shorter extrinsic incubation period (1).
The robust association between temperature and malaria incidence, particularly for mixed infections (mean: 33.6°C; P < 0.001; (Figure 3), aligns with Paaijmans et al. (9), who demonstrated that warmer temperatures accelerate Plasmodium development in Anopheles vectors. However, the lack of humidity and precipitation effects diverges from tropical studies (10), where rainfall sustains breeding sites. In Chabahar’s arid monsoon climate, ephemeral water bodies from irregular rainfall may desiccate before sustaining larvae, rendering temperature the dominant driver. The interplay between ephemeral water bodies and temperature plays a crucial role in the survival and development of aquatic larvae. Irregular rainfall patterns lead to the formation of temporary water bodies that may desiccate before larvae can complete their life cycles, making temperature a critical factor influencing their survival (11, 12).
However, the variability in rainfall patterns can lead to prolonged periods of drought, resulting in the formation of ephemeral water bodies. These water bodies are temporary habitats that form after rainfall events but are subject to rapid desiccation due to high temperatures and evaporation rates (13). Ephemeral water bodies are crucial habitats for various aquatic organisms, including insect larvae, amphibian larvae, and crustacean larvae. These habitats provide breeding grounds and resources for larval development. However, the transient nature of these water bodies poses a significant challenge to the survival of larvae. If the water body dries up before the larvae reach a certain developmental stage, they may not survive (14).
Gender disparities, with males constituting 72.9 - 81.6% of cases (Table 1), mirror trends in agrarian communities where occupational exposure (e.g., outdoor labor, fishing) elevates bite risk. Similar patterns were observed by Raasti et al. in Baluchistan, where socio-cultural norms limit female outdoor activity (15). However, the rise in female cases in 2021 (27.1%) may reflect increased indoor transmission during COVID-19 lockdowns, a phenomenon documented in sub-Saharan Africa (16).
Cross-border migration emerged as a critical driver of transmission, with Afghan nationals disproportionately affected by P. vivax (83% of cases; Table 3). This aligns with another study which identified migration routes from Afghanistan as hotspots for P. vivax reintroduction. The high P. falciparum burden among Pakistani travelers (235 cases) likely reflects chloroquine resistance in Pakistan’s Sindh province (8), underscoring the WHO’s call for cross-border collaboration to disrupt parasite reservoirs (1).
The predominance of trophozoite-stage P.vivax in microscopic analyses (Figure 6) highlights challenges in diagnosing relapsing malaria. Hypnozoite activation often evades routine surveillance, perpetuating transmission (17). Despite this, the low recurrence rate (5.1% with prior malaria history; (Table 3) suggests either underdiagnosis or effective radical cure adherence, warranting pharmacovigilance (18).
5.1. Conclusions
Chabahar’s malaria landscape is shaped by temperature-driven transmission, gendered exposure, and cross-border migration. Elimination requires climate-informed strategies, gender-sensitive interventions, and regional partnerships.
5.2. Limitations and Future Directions
While this study provides critical insights, passive surveillance likely underestimates asymptomatic carriers, who account for approximately 80% of transmissions in endemic regions. The absence of molecular data on parasite resistance (e.g., dhfr/dhps mutations) limits insights into treatment efficacy. Future studies should integrate genomic surveillance, as demonstrated in Southeast Asia, to track resistance and hypnozoite reservoirs.