1. Background
Lung cancer, characterized by uncontrolled cell proliferation in lung tissues, remains a significant public health challenge globally (1, 2). The high mortality rate associated with lung cancer is primarily due to its often late diagnosis and the limited effectiveness of current treatment options (3). Consequently, there is a critical need for new therapeutic targets to enhance treatment efficacy and improve patient survival. Respiratory syncytial virus (RSV), a common respiratory pathogen, has recently garnered attention for its potential role in modulating cellular signaling pathways implicated in cancer (4). Recent studies have highlighted that RSV not only contributes to respiratory infections but also may have an oncogenic role through its ability to alter cellular signaling mechanisms (5, 6). Despite its widespread prevalence and significant impact on human health, the role of RSV in cancer biology remains poorly understood, necessitating further investigation. The RSV infection has been reported to affect critical molecular cascades, including those involved in cell proliferation and apoptosis, creating a unique environment that may either promote or suppress oncogenesis depending on the context (7). However, its role in lung cancer remains underexplored, particularly in relation to the Wnt/β-catenin signaling network and sirtuin 2 (SIRT2) activity.
By exploring the effects of RSV on cellular processes, the present study seeks to uncover its contribution to the molecular etiology of lung cancer. One of the key molecular pathways implicated in cancer is the Wnt/β-catenin signaling network. This pathway plays a crucial role in various cellular processes, including cell growth, differentiation, and viability (8). The Wnt/β-catenin pathway is activated when Wnt proteins interact with cell surface receptors, resulting in the stabilization and accumulation of β-catenin within the cytoplasm (9). The accumulated β-catenin subsequently translocates to the nucleus, where it regulates the expression of target genes essential for cell growth and survival (9, 10). Dysregulation of this pathway, often through mutations or aberrant activation, has been strongly associated with the initiation and progression of various cancers, including lung cancer (7).
The SIRT2, a NAD+-dependent deacetylase, is another crucial regulator of cellular functions. Sirtuins are known for their role in longevity and metabolic regulation (11). The SIRT2 has been specifically linked to the regulation of the cell cycle, apoptosis, and metabolic processes (11, 12). It acts by deacetylating key proteins involved in these processes, thus influencing their activity and stability (11, 12). However, the role of SIRT2 in cancer is multifaceted and context-dependent, with research indicating that it can either promote or suppress tumor development depending on the type of cancer and the specific cellular environment (13). Although previous studies have described the independent roles of the Wnt/β-catenin pathway and SIRT2 in cancer, the interplay between these pathways during RSV infection remains under-investigated (5, 6). This gap in knowledge forms the basis of our study, which aims to elucidate the molecular mechanisms by which RSV influences these critical pathways to drive lung cancer progression.
Emerging evidence suggests a potential interplay between RSV infection, Wnt/β-catenin signaling, and SIRT2 in the context of lung cancer. Our study demonstrates that RSV infection significantly alters the expression and localization of key signaling molecules, including β-catenin and SIRT2, within lung cancer cells. The RSV-induced upregulation of SIRT2 and β-catenin was further modulated by the activation or inhibition of the Wnt/β-catenin pathway. Notably, SIRT2 overexpression amplified oncogenic markers such as cyclin D1, c-Myc, and Bcl-2, while suppressing apoptotic markers like cleaved caspase-3 and cleaved PARP, highlighting its tumor-promoting role. Conversely, SIRT2 knockdown counteracted these effects, enhancing apoptosis and reducing oncogenic marker expression. These findings underscore the critical role of the RSV-Wnt/β-catenin-SIRT2 axis in promoting lung cancer cell proliferation and survival, suggesting that therapeutic strategies targeting this interplay could disrupt tumor progression and provide novel approaches for lung cancer treatment.
2. Objectives
The present study explores the regulation of SIRT2 expression by Wnt/β-catenin signaling and RSV infection, and their roles in lung cancer progression.
3. Methods
3.1. Cell Culture and Respiratory Syncytial Virus Infection
The RSV strain A2 was used to infect MRC-5 and A549 cells at a multiplicity of infection (MOI) of 1. Cells were incubated with the virus in serum-free Dulbecco’s Modified Eagle medium (DMEM) for 2 hours at 37°C, followed by the addition of fresh medium containing 2% fetal bovine serum (FBS). Cell culture was conducted as previously described (14).
3.2. Time-Course Sampling
Infected cells were harvested at 0, 6, 12, 24, 48, and 72 hours post-infection (hpi). At each time point, cells were washed with cold phosphate-buffered saline (PBS) and lysed using radioimmunoprecipitation assay (RIPA) buffer containing protease and phosphatase inhibitors. Lysates were clarified by centrifugation at 14,000 × g for 15 minutes at 4°C, and supernatants were collected for protein analysis.
3.3. Wnt/β-Catenin Pathway Activation/Inhibition
Cells were treated with Wnt3a or XAV939 to activate or inhibit the Wnt/β-catenin pathway, respectively, as described earlier (15).
3.4. Sirtuin 2 Manipulation
The SIRT2 expression in A549 cells was manipulated via overexpression or knockdown. For overexpression, cells were transfected with the pCMV-SIRT2 plasmid using Lipofectamine 2000. For knockdown, cells were transfected with siRNA targeting SIRT2 (Santa Cruz Biotechnology, sc-40988) using Lipofectamine RNAiMAX. After 6 hours, the transfection media were replaced with RPMI-1640 containing 10% FBS, and cells were cultured for 48 hours before analysis (15).
3.5. Western Blot Analysis
3.6. Real-time PCR
3.7. Immunofluorescence and Confocal Microscopy
A549 cells, both RSV-infected and uninfected controls, were fixed with 4% paraformaldehyde and permeabilized using 0.1% Triton X-100. Cells were stained with primary antibodies against SIRT2, β-catenin, and RSV, followed by incubation with Alexa Fluor 350-, FITC-, or TRITC-conjugated secondary antibodies. Images were acquired using a Zeiss LSM 880 confocal microscope at 63x magnification with a pinhole setting of 1 Airy unit. Colocalization analysis was performed using Pearson’s correlation coefficient (17).
3.8. Cell Proliferation Assay
MTT assays were conducted to evaluate cell viability. A549 cells, transfected with SIRT2 plasmid or siRNA, were infected with RSV (MOI = 1). After incubation with RSV, cells were cultured for 48 hours. Formazan crystals were solubilized with dimethyl sulfoxide (DMSO), and absorbance at 570 nm was measured to assess viability (14-17).
3.9. Apoptosis Assay
3.10. Statistical Analysis
Data are presented as mean ± SD from at least three independent experiments. Statistical significance was determined using: (1) Student’s t-test (for comparisons between two groups), (2) one-way ANOVA followed by Tukey’s post hoc test (for comparisons between multiple groups), (3) all analyses were performed using GraphPad Prism 7.0. Significance levels were defined as * P < 0.05, ** P < 0.005, *** P < 0.0005.
4. Results
4.1. Regulation of Sirtuin 2 Expression by the Wnt/β-Catenin Pathway and Respiratory Syncytial Virus Infection in Lung Cells
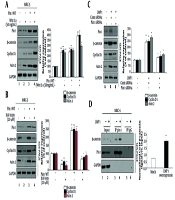
The Wnt/β-catenin pathway plays a dynamic role in various cellular processes. Dysregulation of this pathway has been implicated in various cancers, including lung cancer. The SIRT2 has recently emerged as a potential downstream target of the Wnt/β-catenin cascade in cancer cells. We initially observed significantly lower expression levels of SIRT2 and β-catenin in MRC5 cells compared to A549 cells (Figure 1 lane 1 vs. lane 2). This difference underscores the suitability of A549 cells as an ideal model for studying lung cancer, given their higher expression of these key proteins.
![A, western blot analysis of sirtuin 2 (SIRT2) and β-catenin expression in MRC-5 and A549 cells. Lanes: 1 (untreated MRC-5); 2 (untreated A549); 3 (Wnt3a-treated MRC-5); 4 (Wnt3a-treated A549). Cells were treated with Wnt3a (100 ng/mL) for 24 hours before protein extraction. Blots were quantified using ImageJ, normalized to GAPDH, and presented as fold changes relative to controls (mean ± SD, n = 3); B, effect of XAV939 on SIRT2 and β-catenin expression in MRC-5 and A549 cells. Lanes: 1 (untreated MRC-5), 2 (untreated A549), 3 (XAV939-treated MRC-5), 4 (XAV939-treated A549). Cells were treated with XAV939 (10 µM) for 24 hours before harvesting; C, SIRT2 and β-catenin expression in A549 cells under various conditions: Lane 1 (mock); 2 [respiratory syncytial virus (RSV)-infected]; 3 (RSV + Wnt3a); 4 (RSV + XAV939). The RSV infection was performed at an multiplicity of infection (MOI) of 1.0 for 24 hours. Lower panel: Real-time PCR of SIRT2 mRNA. RNA was extracted using TRIzol, cDNA was synthesized using a high-capacity cDNA reverse transcription kit, and gene expression analyzed via 2<sup>-ΔΔCt</sup> using GAPDH as the housekeeping gene. Error bars represent mean ± SD from three independent experiments, with each sample run in triplicate. Statistical significance: * P < 0.05, ** P < 0.005, * P < 0.0005 (one-way ANOVA); D, A549 cells were infected with RSV at a MOI of 1.0 and harvested at 0, 6, 12, 24, 48, and 72 hours post-infection (hpi). Protein levels of SIRT2 and β-catenin were assessed by Western blot analysis. Densitometric quantification was performed using ImageJ software, with protein expression levels normalized to GAPDH and presented as percentages relative to the 0-hour time point. Data represent the mean ± SD from three independent experiments. Statistical significance was determined using one-way ANOVA with Tukey’s post hoc test; ** P < 0.01, *** P < 0.001 compared to the 0-hour time point.](https://brieflands.com/journals/jjm/articles/158800/figures/jjm-158800-i001-F1-preview.webp "A, western blot analysis of sirtuin 2 (SIRT2) and β-catenin expression in MRC-5 and A549 cells. Lanes: 1 (untreated MRC-5); 2 (untreated A549); 3 (Wnt3a-treated MRC-5); 4 (Wnt3a-treated A549). Cells were treated with Wnt3a (100 ng/mL) for 24 hours before protein extraction. Blots were quantified using ImageJ, normalized to GAPDH, and presented as fold changes relative to controls (mean ± SD, n = 3); B, effect of XAV939 on SIRT2 and β-catenin expression in MRC-5 and A549 cells. Lanes: 1 (untreated MRC-5), 2 (untreated A549), 3 (XAV939-treated MRC-5), 4 (XAV939-treated A549). Cells were treated with XAV939 (10 µM) for 24 hours before harvesting; C, SIRT2 and β-catenin expression in A549 cells under various conditions: Lane 1 (mock); 2 [respiratory syncytial virus (RSV)-infected]; 3 (RSV + Wnt3a); 4 (RSV + XAV939). The RSV infection was performed at an multiplicity of infection (MOI) of 1.0 for 24 hours. Lower panel: Real-time PCR of SIRT2 mRNA. RNA was extracted using TRIzol, cDNA was synthesized using a high-capacity cDNA reverse transcription kit, and gene expression analyzed via 2<sup>-ΔΔCt</sup> using GAPDH as the housekeeping gene. Error bars represent mean ± SD from three independent experiments, with each sample run in triplicate. Statistical significance: * P < 0.05, ** P < 0.005, * P < 0.0005 (one-way ANOVA); D, A549 cells were infected with RSV at a MOI of 1.0 and harvested at 0, 6, 12, 24, 48, and 72 hours post-infection (hpi). Protein levels of SIRT2 and β-catenin were assessed by Western blot analysis. Densitometric quantification was performed using ImageJ software, with protein expression levels normalized to GAPDH and presented as percentages relative to the 0-hour time point. Data represent the mean ± SD from three independent experiments. Statistical significance was determined using one-way ANOVA with Tukey’s post hoc test; ** P < 0.01, *** P < 0.001 compared to the 0-hour time point.")
Figure 1.
A, western blot analysis of sirtuin 2 (SIRT2) and β-catenin expression in MRC-5 and A549 cells. Lanes: 1 (untreated MRC-5); 2 (untreated A549); 3 (Wnt3a-treated MRC-5); 4 (Wnt3a-treated A549). Cells were treated with Wnt3a (100 ng/mL) for 24 hours before protein extraction. Blots were quantified using ImageJ, normalized to GAPDH, and presented as fold changes relative to controls (mean ± SD, n = 3); B, effect of XAV939 on SIRT2 and β-catenin expression in MRC-5 and A549 cells. Lanes: 1 (untreated MRC-5), 2 (untreated A549), 3 (XAV939-treated MRC-5), 4 (XAV939-treated A549). Cells were treated with XAV939 (10 µM) for 24 hours before harvesting; C, SIRT2 and β-catenin expression in A549 cells under various conditions: Lane 1 (mock); 2 [respiratory syncytial virus (RSV)-infected]; 3 (RSV + Wnt3a); 4 (RSV + XAV939). The RSV infection was performed at an multiplicity of infection (MOI) of 1.0 for 24 hours. Lower panel: Real-time PCR of SIRT2 mRNA. RNA was extracted using TRIzol, cDNA was synthesized using a high-capacity cDNA reverse transcription kit, and gene expression analyzed via 2-ΔΔCt using GAPDH as the housekeeping gene. Error bars represent mean ± SD from three independent experiments, with each sample run in triplicate. Statistical significance: * P < 0.05, ** P < 0.005, * P < 0.0005 (one-way ANOVA); D, A549 cells were infected with RSV at a MOI of 1.0 and harvested at 0, 6, 12, 24, 48, and 72 hours post-infection (hpi). Protein levels of SIRT2 and β-catenin were assessed by Western blot analysis. Densitometric quantification was performed using ImageJ software, with protein expression levels normalized to GAPDH and presented as percentages relative to the 0-hour time point. Data represent the mean ± SD from three independent experiments. Statistical significance was determined using one-way ANOVA with Tukey’s post hoc test; ** P < 0.01, *** P < 0.001 compared to the 0-hour time point.
Upon treatment with Wnt3a, a potent activator of the Wnt/β-catenin pathway, both β-catenin and SIRT2 protein levels increased notably in A549 cells compared to MRC5 cells (Figure 1 lanes 1 vs. 3 and lane 2 vs. 4). This observation suggests that activation of the Wnt/β-catenin pathway promotes the expression of SIRT2 in lung cancer cells. Real-time PCR analysis (lower panel of Figure 1A) further supported these findings by demonstrating a significant upregulation of SIRT2 mRNA levels following Wnt3a treatment in A549 cells. Gene expression was normalized to GAPDH, which was used as the housekeeping control. This transcriptional upregulation correlates with the increased protein expression observed, indicating that Wnt/β-catenin signaling regulates SIRT2 at the transcriptional level.
To confirm the specificity of the Wnt/β-catenin pathway in regulating SIRT2 expression, we utilized XAV939, a Wnt signaling inhibitor (Figure 1B). Treatment with XAV939 resulted in decreased expression of both SIRT2 and β-catenin in both MRC5 and A549 cells (Figure 1 lane 1 vs. 3 and lane 2 vs. 4). This reduction in protein levels further supports our hypothesis that SIRT2 expression is dependent on Wnt/β-catenin signal transduction activity in lung cells. Consistent with our protein data, real-time PCR analysis (lower panel of Figure 1B) showed a significant downregulation of SIRT2 mRNA levels upon inhibition of Wnt/β-catenin with XAV939 in both cell lines. This confirms that the observed changes in SIRT2 expression are not merely post-translational but involve transcriptional regulation mediated by the Wnt/β-catenin pathway.
To investigate the impact of RSV infection and its interaction with the Wnt/β-catenin pathway, we analyzed SIRT2 and β-catenin expression under various conditions in A549 cells. In the mock condition, baseline levels of SIRT2 and β-catenin were observed (Figure 1 lane 1). Upon RSV infection alone, SIRT2 and β-catenin expression increased significantly (Figure 1 lane 1 vs. 2). When RSV infection was combined with Wnt3a treatment, SIRT2 and β-catenin expression were further enhanced (Figure 1 lanes 1 and 2 vs. 3), indicating a synergistic effect of RSV and Wnt3a in promoting their expression. However, in the presence of XAV939, both SIRT2 and β-catenin levels were dramatically reduced (Figure 1 lanes 1 and 2 vs. 4), even under RSV infection conditions, confirming that the Wnt/β-catenin pathway is critical for RSV-mediated upregulation of SIRT2. In the lower panel, real-time PCR analysis revealed a similar pattern for SIRT2 mRNA levels. The RSV infection increased SIRT2 mRNA significantly, which was further amplified with RSV plus Wnt3a treatment. Conversely, RSV combined with XAV939 led to a sharp decrease in SIRT2 mRNA levels, further corroborating that SIRT2 transcriptional regulation by RSV is mediated through the Wnt/β-catenin pathway.
To assess the impact of RSV infection on the expression levels of SIRT2 and β-catenin, A549 cells were infected with RSV at an MOI of 1 and harvested at specified time points up to 72 hpi (Figure 1D). Western blot analysis revealed a time-dependent increase in the expression of both SIRT2 and β-catenin proteins. At 0 hpi, baseline levels of SIRT2 and β-catenin were observed. By 6 hours, SIRT2 expression increased to 120% of the baseline, and β-catenin levels rose to 130%. At 12 hours, SIRT2 and β-catenin levels reached 180% and 190%, respectively. The upward trend continued, with SIRT2 reaching 244% and β-catenin 220% at 24 hours. The peak expression was observed at 48 hours, with SIRT2 at 290% and β-catenin at 310% of baseline levels. At 72 hours, SIRT2 expression slightly decreased to 280%, while β-catenin levels remained elevated at 312%. These findings indicate that RSV infection induces a significant, time-dependent upregulation of both SIRT2 and β-catenin in A549 cells, suggesting a potential role for these proteins in the cellular response to RSV infection.
These findings collectively suggest that RSV infection may activate the Wnt/β-catenin pathway to upregulate SIRT2 expression in lung cancer cells, with Wnt3a amplifying this effect and XAV939 effectively inhibiting it. However, these findings are based on in vitro models, and further validation in in vivo systems is necessary.
4.2. Enhancement of Sirtuin 2 and β-Catenin Localization and Expression in A549 Cells by Respiratory Syncytial Virus Infection
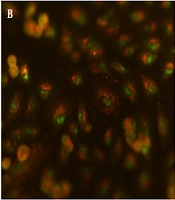
We investigated the subcellular localization of SIRT2 and β-catenin in RSV-infected A549 cells using confocal microscopy. The RSV infection induced a distinct granular-like cytoplasmic pattern for SIRT2 and β-catenin, suggesting their involvement in RSV-induced cytoplasmic structures (Figure 2A). In contrast, uninfected A549 cells exhibited both nuclear and cytoplasmic localization of SIRT2 and β-catenin, indicating that RSV infection triggers their redistribution primarily to the cytoplasm.
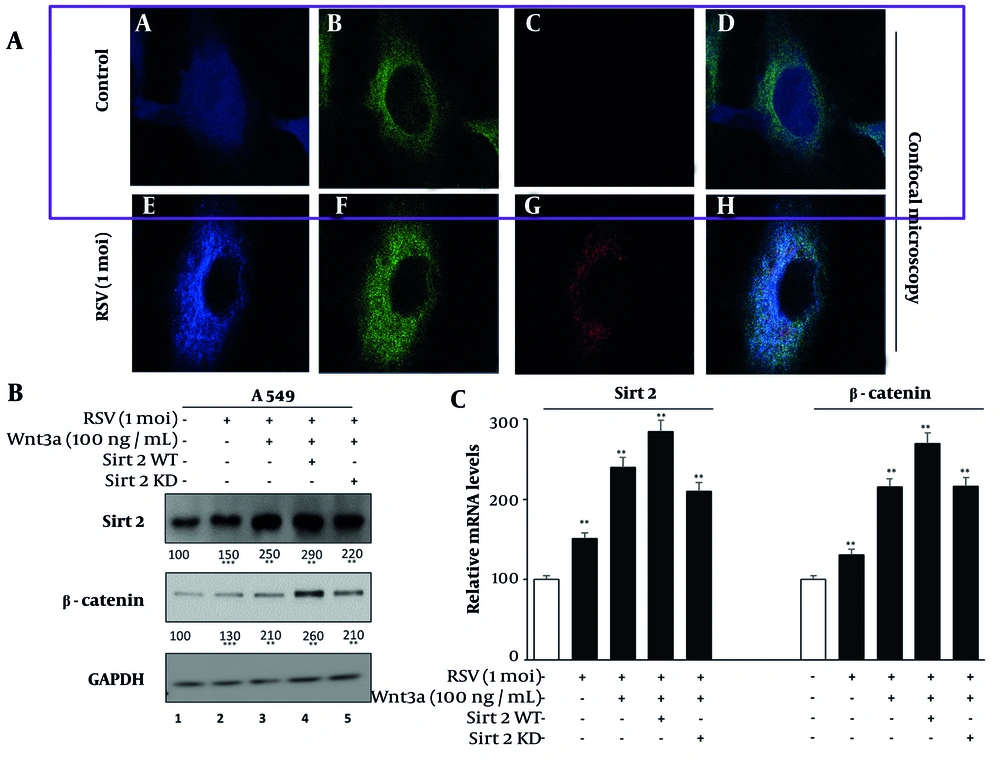
Figure 2.
A, confocal microscopy images showing subcellular localizations of sirtuin 2 (SIRT2), β-catenin, and respiratory syncytial virus (RSV) localization in A549 cells. A and E, SIRT2 (Alexa Fluor 350), (B and F) β-catenin (FITC), (C and G) RSV (TRITC), (D and H) merged. Images were acquired using a Zeiss LSM 880 confocal microscope at 63x magnification with a pinhole setting of 1 Airy unit. Colocalization analysis was performed using Pearson’s correlation coefficient (mean ± SD, n = 3); B, western blot and real-time PCR of SIRT2 and β-catenin in A549 cells: Lane 1 (mock); 2 (RSV-infected); 3 (RSV + Wnt3a); 4 (RSV + Wnt3a + SIRT2 overexpression); 5 (RSV + Wnt3a + SIRT2 knockdown). Significance levels: * P < 0.05, ** P < 0.005, *** P < 0.0005.
We then analyzed the effects of RSV infection and Wnt/β-catenin pathway modulation on the expression of SIRT2 and β-catenin via Western blotting and mRNA analysis (Figure 2B). Western blot data revealed that RSV infection alone moderately increased SIRT2 and β-catenin protein levels compared to the mock condition (Figure 2 lane 1 vs. 2). The combination of RSV and Wnt3a further amplified this expression, indicating a synergistic effect of the Wnt/β-catenin pathway (Figure 2 lanes 1 and 2 vs. 3).
The SIRT2 overexpression in the presence of RSV and Wnt3a led to the highest protein levels (Figure 2 lanes 1, 2, and 3 vs. 4), whereas SIRT2 knockdown in the same condition attenuated the upregulation. The mRNA levels of SIRT2 and β-catenin, assessed via real-time PCR (Figure 2B), mirrored the protein-level findings. Gene expression was normalized to GAPDH, which was validated for stable expression across experimental conditions. The RSV infection increased SIRT2 and β-catenin mRNA levels, which were further enhanced by Wnt3a. The SIRT2 overexpression amplified this upregulation, while SIRT2 knockdown diminished it, confirming transcriptional regulation of these proteins.
The efficiency of SIRT2 knockdown was validated by Western blot analysis in mock-treated, non-specific siRNA-treated, and SIRT2 siRNA-treated A549 cells, confirming effective silencing at the protein level. The knockdown efficiency was calculated to be approximately 20% (Appendix 1 in Supplementary File). These findings demonstrate that RSV infection not only alters SIRT2 and β-catenin localization but also modulates their expression, with the Wnt/β-catenin pathway playing a pivotal role.
4.3. Augmentation of Lung Cancer Cell Proliferation and Cyclin D1 Expression by Sirtuin 2 in Response to Respiratory Syncytial Virus
We investigated the impact of SIRT2 on cell proliferation using MTT assays and Western blotting for cyclin D1, a proliferation marker. Treatment with Wnt3a significantly enhanced cell proliferation, as evidenced by increased MTT assay absorbance (Figure 3 bar 1 vs. 2). Overexpression of SIRT2 further augmented this effect, demonstrating significantly higher proliferation compared to Wnt3a treatment alone (Figure 3 bar 3 vs. 4). Conversely, knockdown of SIRT2 using specific siRNA (Figure 3B) resulted in reduced cell proliferation, indicating a critical role for SIRT2 in promoting cellular growth. Western blot analysis (lower panels of Figure 3A and B) confirmed these observations, showing increased expression of cyclin D1 in response to Wnt3a treatment and even higher levels with SIRT2 overexpression. Conversely, knockdown of SIRT2 led to decreased cyclin D1 expression, aligning with the observed changes in cell proliferation.
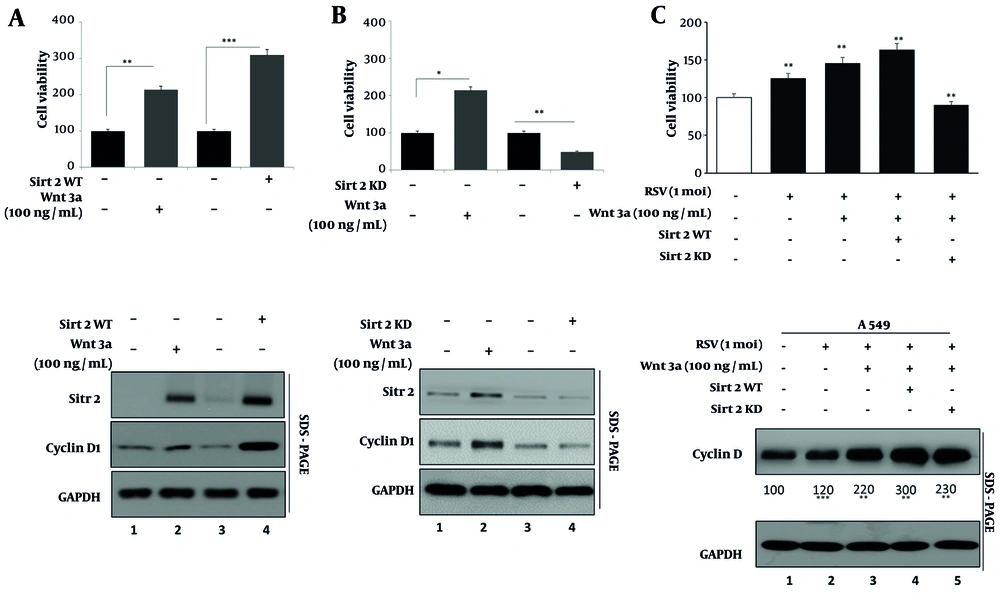
Figure 3.
A, MTT assay showing A549 cell proliferation under Wnt3a treatment and sirtuin 2 (SIRT2) overexpression. Cells were seeded at a density of 5 × 10³ cells/well in 96-well plates and treated with Wnt3a (100 ng/mL) for 48 hours. Absorbance at 570 nm was measured using a BioTek Synergy H1 microplate reader. Data are presented as mean ± SD (n = 5 wells per condition, repeated in triplicate); B, MTT assay showing the effect of SIRT2 knockdown on cell proliferation; C, MTT assay of respiratory syncytial virus (RSV), Wnt3a, and SIRT2 modulation on A549 cell proliferation. Bars represent mock, RSV, RSV + Wnt3a, RSV + Wnt3a + SIRT2 overexpression, and RSV + Wnt3a + SIRT2 knockdown. Western blot (lower panels) shows cyclin D1 and SIRT2 expression. Significance levels: * P < 0.05, ** P < 0.005, *** P < 0.0005.
To further explore the role of SIRT2 in RSV-induced lung cancer cell proliferation, we analyzed the effects of RSV infection and Wnt3a modulation on cell growth and cyclin D1 expression. MTT assay results (Figure 3C, upper panel) revealed that RSV infection alone modestly increased cell proliferation compared to the mock condition. The addition of Wnt3a further enhanced proliferation, while SIRT2 overexpression in the presence of RSV and Wnt3a led to the highest proliferation levels. In contrast, knockdown of SIRT2 significantly diminished the RSV and Wnt3a-induced proliferation, underscoring the critical role of SIRT2 in this process.
Western blot analysis of cyclin D1 expression (Figure 3C, lower panel) corroborated the MTT findings. The RSV infection alone increased cyclin D1 levels (lane 1 vs. 2), and this upregulation was amplified by Wnt3a treatment (lane 3). The combination of RSV, Wnt3a, and SIRT2 overexpression resulted in the highest cyclin D1 expression, aligning with the proliferation results (lane 4). However, SIRT2 knockdown reduced cyclin D1 levels significantly, despite the presence of RSV and Wnt3a (lane 5). These findings confirm that SIRT2 is a key mediator of RSV-induced lung cancer cell proliferation, acting through the modulation of cyclin D1 expression. The synergistic effects of Wnt3a and SIRT2 overexpression highlight the interplay between RSV infection, Wnt/β-catenin signaling, and SIRT2 in driving lung cancer cell growth.
4.4. Synergistic Enhancement of Oncogenic Markers by Sirtuin 2 and Wnt/β-Catenin Signaling in Respiratory Syncytial Virus-Infected Cells
We evaluated the impact of RSV infection, Wnt3a treatment, and SIRT2 modulation on the expression of oncogenic markers Ki-67, Snail, and c-Myc to elucidate their role in lung cancer progression (Figure 4). Western blot analysis (Figure 4, upper panel) revealed that RSV infection alone modestly increased the protein levels of these markers compared to the mock condition (lane 1 vs. 2). Wnt3a treatment further enhanced their expression (lane 2 vs. 3), and SIRT2 overexpression in the presence of RSV and Wnt3a led to the highest levels of Ki-67, Snail, and c-Myc (lane 3 vs. 4), indicating a synergistic effect of SIRT2 and Wnt/β-catenin activation. Conversely, SIRT2 knockdown in the presence of RSV and Wnt3a significantly reduced the expression of these oncogenic markers (lane 4 vs. 5). The lower panel of Figure 4B shows the quantification of protein expression. These results highlight the potential synergistic interaction between SIRT2 and Wnt/β-catenin signaling in regulating lung cancer progression by upregulating Ki-67, Snail, and c-Myc at translational levels. Further in vivo studies are required to establish the clinical relevance of these findings.
![A, western blot of c-Myc, Ki67, and SNAIL in A549 cells: Lane 1 (mock); 2 [respiratory syncytial virus (RSV)-infected]; 3 (RSV + Wnt3a); 4 [RSV + Wnt3a + sirtuin 2 (SIRT2) overexpression]; 5 (RSV + Wnt3a + SIRT2 knockdown). Blots were normalized to GAPDH and analyzed using ImageJ (mean ± SD, n = 3); B, quantification of protein levels from A, using ImageJ. Significance levels: * P < 0.05, ** P < 0.005, *** P < 0.0005.](https://brieflands.com/journals/jjm/articles/158800/figures/jjm-158800-i004-F4-preview.webp "A, western blot of c-Myc, Ki67, and SNAIL in A549 cells: Lane 1 (mock); 2 [respiratory syncytial virus (RSV)-infected]; 3 (RSV + Wnt3a); 4 [RSV + Wnt3a + sirtuin 2 (SIRT2) overexpression]; 5 (RSV + Wnt3a + SIRT2 knockdown). Blots were normalized to GAPDH and analyzed using ImageJ (mean ± SD, n = 3); B, quantification of protein levels from A, using ImageJ. Significance levels: * P < 0.05, ** P < 0.005, *** P < 0.0005.")
Figure 4.
A, western blot of c-Myc, Ki67, and SNAIL in A549 cells: Lane 1 (mock); 2 [respiratory syncytial virus (RSV)-infected]; 3 (RSV + Wnt3a); 4 [RSV + Wnt3a + sirtuin 2 (SIRT2) overexpression]; 5 (RSV + Wnt3a + SIRT2 knockdown). Blots were normalized to GAPDH and analyzed using ImageJ (mean ± SD, n = 3); B, quantification of protein levels from A, using ImageJ. Significance levels: * P < 0.05, ** P < 0.005, *** P < 0.0005.
4.5. Modulation of Apoptosis in Lung Cancer Cells by Sirtuin 2 During Respiratory Syncytial Virus Infection
To investigate the effects of SIRT2 modulation and Wnt/β-catenin activation on apoptosis in RSV-infected lung cancer cells, we assessed the levels of Bcl-2 (an anti-apoptotic marker), cleaved caspase-3, and cleaved PARP (pro-apoptotic markers) under different experimental conditions (Figure 5). Western blot analysis (Figure 5, right panel) showed that RSV infection alone resulted in a modest increase in Bcl-2 levels and a slight reduction in cleaved caspase-3 and cleaved PARP levels compared to mock-treated cells, indicating a pro-survival effect of RSV (lane 1 vs. 2). Wnt3a treatment in RSV-infected cells further elevated Bcl-2 expression and decreased cleaved caspase-3 and cleaved PARP levels (lane 2 vs. 3), suggesting that activation of the Wnt/β-catenin pathway promotes cell survival.
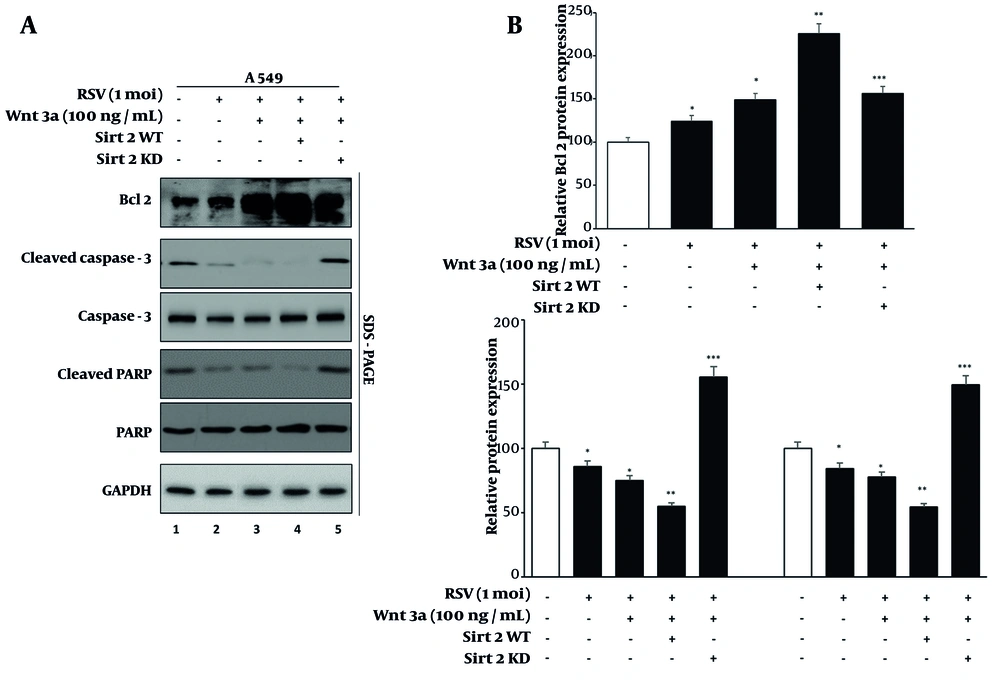
Figure 5.
A, western blot of apoptotic markers (Bcl-2, cleaved caspase-3, cleaved PARP) in A549 cells under sirtuin 2 (SIRT2) modulation. Lanes as in Figure 4; B, quantification of apoptotic marker levels using ImageJ. Data represent means from three experiments. Significance levels: * P < 0.05, ** P < 0.005, *** P < 0.0005.
Overexpression of SIRT2 in the presence of RSV and Wnt3a showed the highest levels of Bcl-2 and the lowest levels of cleaved caspase-3 and cleaved PARP, indicating enhanced anti-apoptotic activity (lane 3 vs. 4). Conversely, knockdown of SIRT2 in RSV-infected cells treated with Wnt3a significantly reduced Bcl-2 levels and markedly increased the levels of cleaved caspase-3 and cleaved PARP (lane 4 vs. 5), highlighting the pro-apoptotic effect of SIRT2 inhibition. Quantification of Bcl-2, cleaved and total caspase-3, and PARP levels is shown in Figure 5, left panel.
These findings suggest that SIRT2 and Wnt/β-catenin signaling collaborate to inhibit apoptosis and promote cell survival in RSV-infected lung cancer cells. Targeting SIRT2 could be explored as a potential strategy to counteract the anti-apoptotic effects of RSV and Wnt/β-catenin signaling. However, additional preclinical and clinical validation is required before considering therapeutic implications.
5. Discussion
Cancer remains a significant global burden (21-24), (25-30), and the economic impact of COVID-19 has exacerbated the challenges faced in healthcare (31-37). This dual strain highlights the urgent need for innovative approaches in treating lung cancer. The present study investigates the interplay between the Wnt/β-catenin network and SIRT2 in lung cancer, revealing novel insights into their regulatory mechanisms and functional roles in cancer progression.
Our outcomes validate that activation of the Wnt/β-catenin cascade raises SIRT2 expression at both protein and mRNA levels in A549 lung cancer cell lines, while inhibition of this pathway reduces SIRT2 expression. This suggests that SIRT2 is a downstream target of Wnt/β-catenin, as further illustrated in Appendix 2 in Supplementary File. Supporting this, other studies have shown similar regulatory mechanisms; for instance, Chen et al. reported that Wnt/β-catenin signal transduction upregulates SIRT2 in hepatocellular carcinoma, enhancing tumor growth and metastasis (36). This suggests that SIRT2 may serve as a key mediator of Wnt/β-catenin signaling in lung cancer, and similar mechanisms could apply to other cancers.
The study also explores the effects of RSV infection, which has been shown to modulate the Wnt/β-catenin pathway. The RSV infection alone led to a significant increase in SIRT2 expression, supporting the idea that RSV infection can enhance Wnt/β-catenin signaling. Moreover, when combined with Wnt3a, a Wnt agonist, RSV infection further augmented SIRT2 expression, indicating a synergistic effect. This enhancement underscores the potential for combining RSV and Wnt3a as therapeutic strategies to regulate SIRT2 expression in lung cancer.
One of the major findings of our study is that SIRT2 promotes lung cancer cell proliferation. This was evidenced by increased MTT assay absorbance and elevated cyclin D1 expression upon SIRT2 overexpression. Conversely, SIRT2 knockdown resulted in decreased cell proliferation and cyclin D1 levels. Our findings are consistent with those of Kim et al., who demonstrated that SIRT2 enhances cell cycle progression by regulating cyclin D1 expression in breast cancer (37). Moreover, we observed a synergistic enhancement of oncogenic markers, such as cyclin D1 and c-Myc, when SIRT2 and Wnt/β-catenin were co-activated. This combined effect further highlights the role of SIRT2 in driving oncogenesis, consistent with Zhang et al., who reported that SIRT2 enhances Wnt/β-catenin signaling in colorectal cancer, contributing to tumor progression (38).
Beyond its role in cell proliferation, our study also reveals that SIRT2 inhibits apoptosis in lung cancer cells. This is evident from the increased levels of cleaved caspase-3 and PARP following SIRT2 inhibition. However, SIRT2 overexpression diminished this apoptotic effect, suggesting that SIRT2 plays an anti-apoptotic role in lung cancer cells. This finding is consistent with previous studies showing that SIRT2 protects cancer cells, such as in pancreatic cancer, by deacetylating key apoptotic proteins (39-41). These results suggest that SIRT2 may not only promote cell survival and proliferation but also act as a potential target for therapeutic strategies aimed at inducing apoptosis in lung cancer.
Our study suggests that SIRT2 may play a central role in lung cancer progression by enhancing cell proliferation and inhibiting apoptosis. The dual regulation of SIRT2 by Wnt/β-catenin and RSV infection may create an oncogenic environment that fosters tumor growth. The upregulation of cyclin D1, Ki-67, and Bcl-2, along with downregulation of cleaved caspase-3 and PARP, suggests that SIRT2 may influence key cell cycle and apoptosis regulators, which are pivotal in cancer progression. These findings propose SIRT2 as a potential therapeutic target for lung cancer treatment, with its inhibition offering a route to promote tumor cell apoptosis and suppress proliferation.
The translational potential of our findings lies in identifying novel therapeutic strategies targeting SIRT2 in lung cancer. While our study offers promising insights, transitioning from laboratory findings to clinical applications requires further steps. First, the optimization of SIRT2 inhibitors and their integration with existing therapies must be explored in preclinical in vivo models. Such models could better simulate the tumor microenvironment (TME) and the effects of combination treatments, providing a clearer picture of their clinical viability. Additionally, exploring the use of RSV and Wnt3a as potential adjunct therapies in clinical settings may yield significant benefits, particularly in targeting specific oncogenic pathways like Wnt/β-catenin. Ultimately, clinical trials will be essential to evaluate the safety, efficacy, and pharmacokinetics of these strategies in diverse patient populations. These steps are crucial to bridging the gap between experimental models and real-world clinical applications, ultimately enhancing the therapeutic options available for lung cancer patients.
While this study offers valuable insights into the regulatory mechanisms governing SIRT2 in lung cancer, several areas require further investigation. One key limitation is the reliance on in vitro models using the A549 lung cancer cell line. Although these findings offer valuable mechanistic insights, validation in in vivo models or patient-derived tissues would be necessary to fully understand the clinical relevance of SIRT2 in lung cancer. Additionally, our study does not address potential variations in SIRT2 regulation across different lung cancer subtypes or patient demographics. Future research should explore how genetic, epigenetic, and environmental factors influence SIRT2 expression and its role in lung cancer progression.
Targeting SIRT2 for lung cancer therapy may pose challenges due to its involvement in various cellular processes, potentially leading to off-target effects in normal tissues. Developing tissue-specific inhibitors or delivery systems is essential to minimize these risks and ensure the safety of SIRT2-based therapies. Furthermore, identifying the specific transcription factors or co-regulators involved in β-catenin-mediated SIRT2 upregulation could enhance our understanding of this pathway and its therapeutic implications.
Additionally, our study does not fully consider the influence of the TME on SIRT2-mediated lung cancer progression. The TME consists of immune cells, fibroblasts, extracellular matrix components, and angiogenic factors that interact dynamically with tumor cells. Since our study utilized a 2D monolayer culture system, it does not completely capture these complex interactions. Future studies incorporating 3D spheroid models, co-culture systems with stromal and immune cells, or patient-derived xenografts (PDX) could provide a more physiologically relevant understanding of SIRT2’s role in lung cancer progression. Exploring how SIRT2 functions within an immune-rich microenvironment may further reveal its potential as a therapeutic target.
5.1. Conclusions
The present study underscores the critical role of the Wnt/β-catenin signaling pathway in regulating SIRT2 expression in lung cancer cells, demonstrating how RSV infection and Wnt3a activation synergistically enhance SIRT2 levels. Additionally, we provide evidence that SIRT2 promotes lung cancer cell proliferation while inhibiting apoptosis, suggesting that targeting SIRT2 may serve as a viable therapeutic approach for lung cancer treatment. However, further in vivo and clinical studies are necessary to validate these findings and determine the potential of SIRT2-targeted therapies in personalized medicine.