


1. Background
2. Objectives
3. Methods
3.1. Overview of Research Methodology and Ethics Approval Process
3.2. Sample Collection and Bacterial Identification
3.3. Antimicrobial Susceptibility Testing
3.4. Detection of Carbapenemase, Virulence Factors, and blaOXA-51 Genes Using Multiplex PCR Technique
3.4.1. Bacterial DNA Extraction
3.5. Detection of Carbapenemase Genes
| Reaction; Primer Names | Sequence | Length | Reference |
|---|---|---|---|
| I | |||
| blaOXA-51 | F: 5'- TAATGCTTTGATCGGCCTTG-3'; R: 5'- TGGATTGCACTTCATCTTGG-3' | 353 | (8) |
| blaOXA-58 | F: 5'- AAGTATTGGGGCTTGTGCTG-3'; R: 5'- CCCCTCTGCGCTCTACATAC-3' | 599 | (8) |
| blaOXA-24 | F: 5'- GGTTAGTTGGCCCCCTTAAA-3'; R: 5'- AGTTGAGCGAAAAGGGGATT-3' | 249 | (8) |
| II | |||
| VIM | F: 5'- GATGGTGTTTGGTCGCATA-3'; R: 5'- CGAATGCGCAGCACCAG-3' | 390 | (8) |
| KPC | F: 5'- CGTCTAGTTCTGCTGTCTTG-3'; R: 5'- CTTGTCATCCTTGTTAGGCG-3' | 798 | (9) |
| NDM | F: 5'- GGTTTGGCGATCTGGTTTTC-3'; R: 5'- CGGAATGGCTCATCACGATC-3' | 621 | (9) |
| SIM | F: 5’-TACAAGGGATTCGGCATCG-3’; R: 5’-TAATGGCCTGTTCCCATGTG-3’ | 271 | (8) |
| III | |||
| surA | F: 5'- GATGCGATTGCACCTGGAAC -3'; R: 5'- TTGACGTGCCATACGCTCTT -3' | 822 | (10) |
| pld | F: 5'- GCTGTGGCTTTGACAGGTTG -3'; R: 5'- TAGCGCAAACGGTGTTGTTG -3' | 695 | (10) |
| basD | F: 5'- TGCTGTTCGTTCTTTTGGCG -3'; R: 5'- GTTGAGTTTGAGCGCCGATG -3' | 517 | (10) |
| csuA | F: 5'- TGGTGAAGCTACCACAGGTT -3'; R: 5'- ACGACTACCATCATGGGCTG -3' | 322 | (10) |
| lipA | F: 5'- ATCTGAACCTGGACGCATCG -3'; R: 5'- TTGGACCCTGATGAACCACG -3' | 300 | This study |
| bap | F: 5'- TGAAAGTGGCTGCCAGTGAT -3'; R: 5'- TCTGCGTCAGCGTCACTATC -3' | 223 | (10) |
| bfmR | F: 5'- ACCGATGGTAACCGTGCAAT -3'; R: 5'- TCTGCACCCATTTCCAGACC -3' | 194 | (10) |
| recA | F: 5'- CACGCCCTAGACCCTCAATA -3'; R: 5'- CGATTAAATCAATTGCGCCT -3' | 136 | (11) |
| IV | |||
| ompA | F: 5'- GCTGGTGTTGGTGCTTTCTG -3'; R: 5'- TCGGTTGATCCCAAGCGAAA -3' | 490 | (10) |
| abeD | F: 5'- TTGGCTTGCCAAATGACGTG -3'; R: 5'- TCTTGACGACTAACCGCACC -3' | 247 | (11) |
| pbpG | F: 5'- TGGATGCGCAAACAGGTGAA -3'; R: 5'- GGTCGGTGTGGTTGAGAACT -3' | 467 | (10) |
| Reaction | Master Mix | Template DNA | Primer Forward | Primer Reverse | Total Volume |
|---|---|---|---|---|---|
| I - IV | 2X (12.5 μL) | 50 ng (25 μL) | 10 pmol (3.3 μL) | 10 pmol (3.3 μL) | 25 μL |
| ERIC-PCR | 2X (10 μL) | 50 ng (3 μL) | 10 pmol (0.5 μL) | 10 pmol (0.5 μL) | 20 μL |
| Variables | Permutability | Denaturation | Annealing | Extension | Cycle Number | Re-extension |
|---|---|---|---|---|---|---|
| Reaction | 94℃, 10 min | 94℃, 30 s | 72℃, 30 s | 35 | 72℃, 10 min | |
| I | 59℃, 60 s | |||||
| II | 57℃, 60 s | |||||
| III | 59℃, 60 s | |||||
| IV | 57℃, 60 s | |||||
| ERIC-PCR | 94℃, 10 min | 94℃, 60 s | 56℃, 60 s | 72℃, 60 s | 35 | 72℃, 10 min |
Abbreviation: ERIC, enterobacterial repetitive intergenic consensus.
3.6. Detection of Virulence Genes
3.7. Sequencing
3.8. Enterobacterial Repetitive Intergenic Consensus PCR Genotyping
3.9. Statistical Analysis
4. Results
4.1. Antibiotic Resistance of Isolates
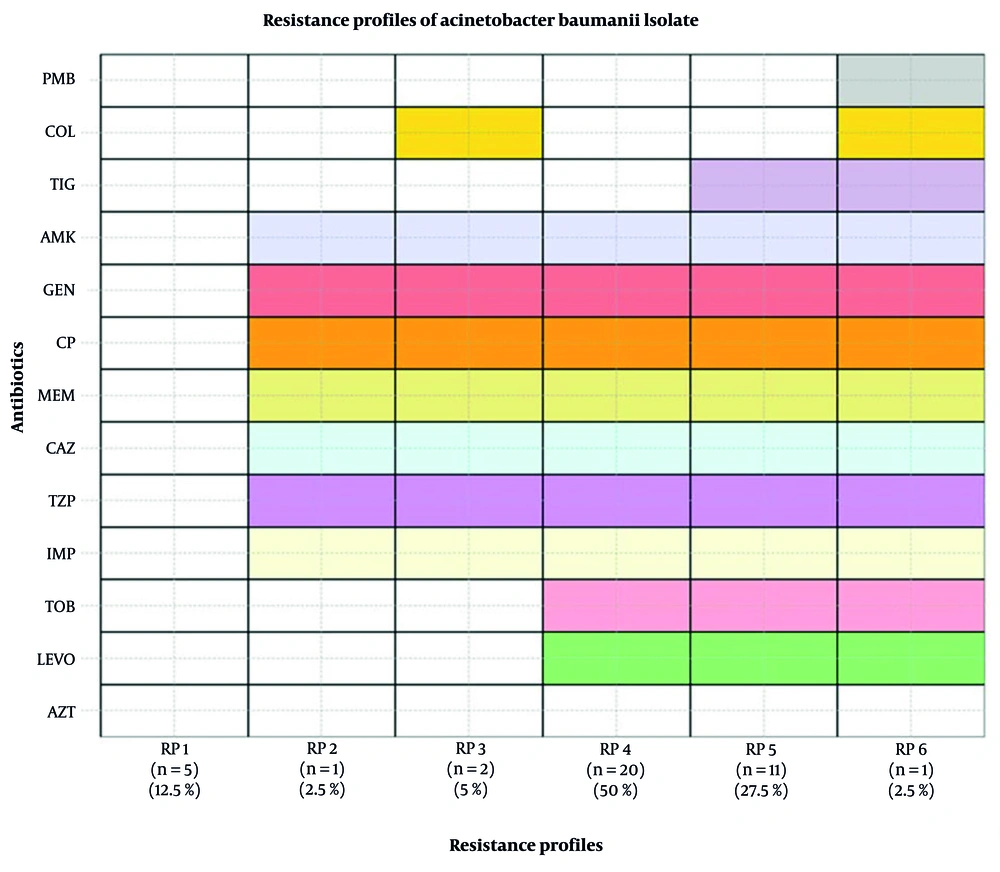
Resistance profiles of Acinetobacter baumannii isolates against tested antibiotics: The heatmap displays resistance patterns of 40 clinical A. baumannii isolates grouped into six distinct resistance profiles (RP1–RP6). Rows represent antibiotics tested: Polymyxin B (PMB), colistin (COL), tigecycline (TIG), amikacin (AMK), gentamicin (GEN), ciprofloxacin (CP), meropenem (MEM), ceftazidime (CAZ), piperacillin/tazobactam (TZP), imipenem (IMP), tobramycin (TOB), levofloxacin (LEV), and aztreonam (AZT). Columns correspond to resistance profiles, with the number of isolates (n) and percentage of total isolates shown below each profile. RP1 (n = 5, 12.5%): Isolates susceptible to all tested antibiotics. RP2 (n = 1, 2.5%): Resistant to IMP, TZP, CAZ, MEM, CP, GEN, and AMK. RP3 (n = 2, 5%): Resistant to IMP, TZP, CAZ, MEM, CP, GEN, AMK, and COL. RP4 (n = 20, 50%): Multidrug-resistant (MDR) isolates showing resistance to LEV, TOB, IMP, TZP, CAZ, MEM, CP, GEN, and AMK. RP5 (n = 11, 27.5%): Resistance to LEV, TOB, IMP, TZP, CAZ, MEM, CP, GEN, AMK, and TIG. RP6 (n = 1, 2.5%): Resistance to LEV, TOB, IMP, TZP, CAZ, MEM, CP, GEN, AMK, TIG, COL, and PMB. Colors indicate resistance status per antibiotic per profile; shaded cells represent resistance, and white cells indicate susceptibility (total isolates: N = 40).
4.2. The Presence of Carbapenemase and Virulence Genes
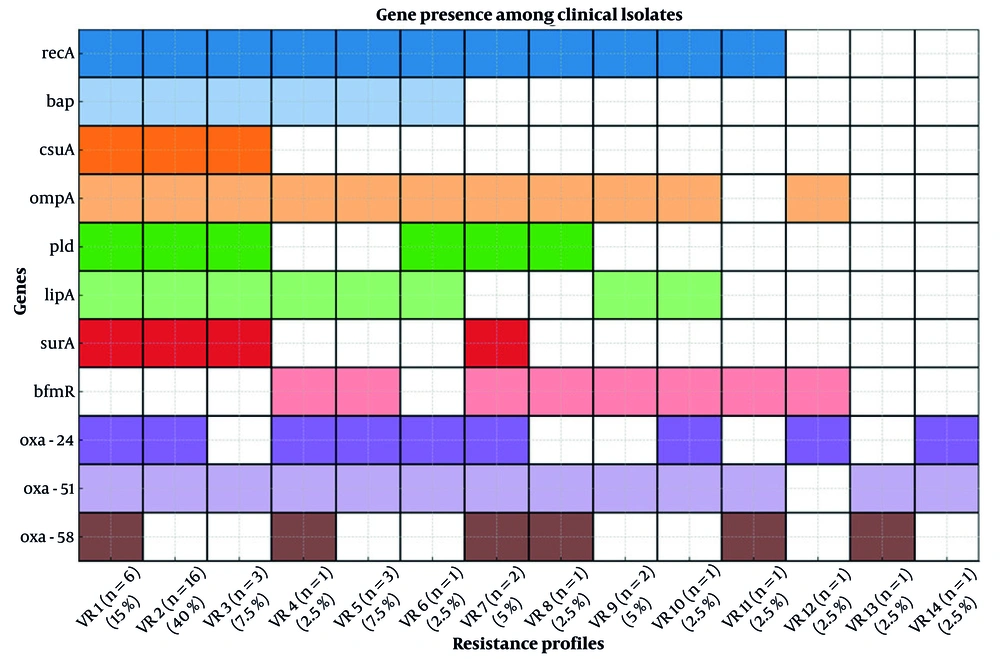
Combined virulence and resistance gene profiles (VR1–VR14) among clinical Acinetobacter baumannii isolates: This figure presents 14 distinct combined gene profiles (VR1 through VR14), each representing a unique pattern of presence or absence of selected virulence genes (recA, bap, csuA, ompA, pld, lipA, surA, and bfmR) along with key resistance genes (including blaOXA-58, blaOXA-51, and blaOXA-24). Each VR profile reflects a specific combination of these virulence and resistance determinants, highlighting the genetic diversity and potential pathogenicity variations among the isolates. The presence of each gene is indicated by colored squares in the heatmap, whereas absence is shown by blank cells.
4.3. Statistical Analysis of Genes and Resistance Profiles
| Variables | Values | Cumulative Percent |
|---|---|---|
| TIG | ||
| Susceptible | 28 (70.0) | 70.0 |
| Resistance | 12 (30.0) | 100.0 |
| Total | 40 (100.0) | - |
| AZT | ||
| Susceptible | 8 (20.0) | 20.0 |
| Resistance | 32 (80.0) | 100.0 |
| Total | 40 (100.0) | - |
| LEV | ||
| Susceptible | 8 (20.0) | 20.0 |
| Resistance | 32 (80.0) | 100.0 |
| Total | 40 (100.0) | - |
| TOB | ||
| Susceptible | 8 (20.0) | 20.0 |
| Resistance | 32 (80.0) | 100.0 |
| Total | 40 (100.0) | - |
| IMP | ||
| Susceptible | 5 (12.5) | 12.5 |
| Resistance | 35 (87.5) | 100.0 |
| Total | 40 (100.0) | - |
| PMB | ||
| Susceptible | 39 (97.5) | 97.5 |
| Resistance | 1 (2.5) | 100.0 |
| Total | 40 (100.0) | - |
| COL | ||
| Susceptible | 38 (95.0) | 95.0 |
| Resistance | 2 (5.0) | 100.0 |
| Total | 40 (100.0) | - |
| TZP | ||
| Susceptible | 5 (12.5) | 12.5 |
| Resistance | 35 (87.5) | 100.0 |
| Total | 40 (100.0) | - |
| CAZ | ||
| Susceptible | 5 (12.5) | 12.5 |
| Resistance | 35 (87.5) | 100.0 |
| Total | 40 (100.0) | - |
| MEM | ||
| Susceptible | 5 (12.5) | 12.5 |
| Resistance | 35 (87.5) | 100.0 |
| Total | 40 (100.0) | - |
| CIP | ||
| Susceptible | 5 (12.5) | 12.5 |
| Resistance | 35 (87.5) | 100.0 |
| Total | 40 (100.0) | - |
| GEN | ||
| Susceptible | 5 (12.5) | 12.5 |
| Resistance | 35 (87.5) | 100.0 |
| Total | 40 (100.0) | - |
| AMK | ||
| Susceptible | 5 (12.5) | 12.5 |
| Resistance | 35 (87.5) | 100.0 |
| Total | 40 (100.0) | - |
Abbreviations: TIG, tigecycline; AZT, aztreonam; LEV, levofloxacin; TOB, tobramycin; IMP, imipenem; PMB, polymyxin B; COL, colistin; TZP, piperacillin/tazobactam; CAZ, ceftazidime; MEM, meropenem; CIP, ciprofloxacin; GEN, gentamicin; AMK, amikacin.
a Values are expressed as No. (%).
b Total number of isolates tested = 40.
c Susceptibility and resistance were determined according to Clinical and Laboratory Standards Institute (CLSI) guidelines.
d Each antibiotic’s total row confirms the number and percentage of isolates tested.
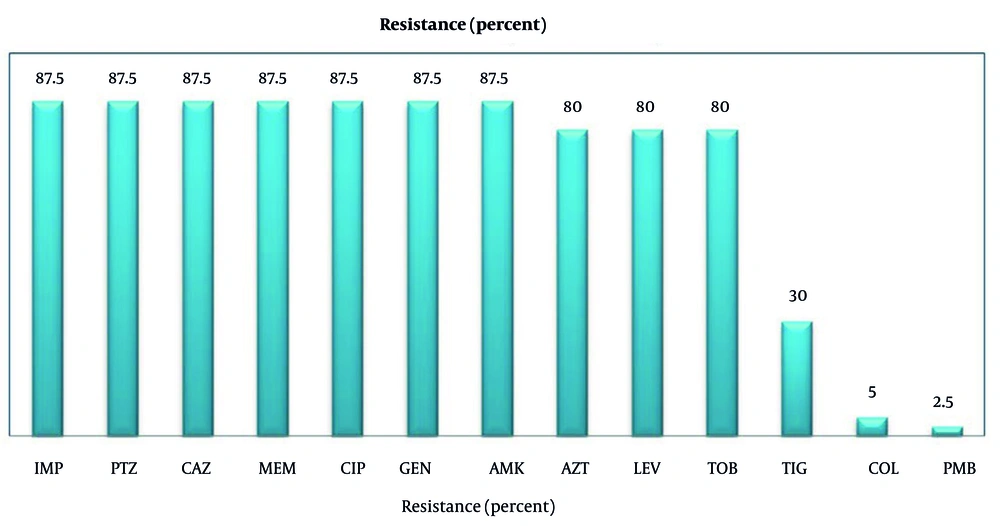
Relative frequency of antibiotic resistance among 40 clinical Acinetobacter isolates: This bar chart illustrates the proportion (%) of isolates categorized as resistant to each of the 14 antibiotics tested. Antibiotics are listed along the x-axis with their full names and standard abbreviations: Imipenem (IPM), piperacillin/tazobactam (TZP), ceftazidime (CAZ), meropenem (MEM), ciprofloxacin (CIP), gentamicin (GEN), amikacin (AMK), aztreonam (AZT), levofloxacin (LEV), tobramycin (TOB), tigecycline (TIG), colistin (COL), and polymyxin B (PMB). The y-axis represents the percentage of isolates. Resistance was determined using the disk diffusion method according to Clinical and Laboratory Standards Institute (CLSI) guidelines (the total number of isolates tested was 40).
| Variables | bla OXA-58 | bla OXA-51 | bla OXA-24 | recA | bap | csuA | ompA | pld | abeD | pbpG | basD | bfmR | lipA | surA |
|---|---|---|---|---|---|---|---|---|---|---|---|---|---|---|
| TIG | -0.19 | - | 0.18 | 0.18 | 0.12 | -0.08 | 0.18 | -0.16 | - | - | - | 0.07 | 0.32 | -0.12 |
| AZT | 0.05 | - | -0.14 | -0.14 | -0.14 | -0.22 | -0.14 | -0.19 | - | - | - | 0.15 | -0.25 | -0.21 |
| LEV | 0.05 | - | -0.14 | -0.14 | -0.14 | -0.22 | -0.14 | -0.19 | - | - | - | 0.15 | -0.25 | -0.21 |
| TOB | 0.05 | - | -0.14 | -0.14 | -0.14 | -0.22 | -0.14 | -0.19 | - | - | - | 0.15 | -0.25 | -0.21 |
| IMP | 0.24 | - | -0.10 | -0.10 | -0.04 | -0.15 | -0.10 | -0.08 | - | - | - | 0.09 | -0.18 | -0.10 |
| PMB | -0.10 | - | 0.04 | 0.04 | 0.09 | -0.13 | 0.04 | 0.10 | - | - | - | 0.15 | 0.08 | 0.11 |
| COL | 0.10 | - | 0.06 | 0.06 | 0.13 | 0.04 | 0.06 | 0.15 | - | - | - | -0.01 | 0.11 | 0.15 |
| TZP | 0.24 | - | -0.10 | -0.10 | -0.04 | -0.15 | -0.10 | -0.08 | - | - | - | 0.09 | -0.18 | -0.10 |
| CAZ | 0.24 | - | -0.10 | -0.10 | -0.04 | -0.15 | -0.10 | -0.08 | - | - | - | 0.09 | -0.18 | -0.10 |
| MEM | 0.24 | - | -0.10 | -0.10 | -0.04 | -0.15 | -0.10 | -0.08 | - | - | - | 0.09 | -0.18 | -0.10 |
| CIP | 0.24 | - | -0.10 | -0.10 | -0.04 | -0.15 | -0.10 | -0.08 | - | - | - | 0.09 | -0.18 | -0.10 |
| GEN | 0.24 | - | -0.10 | -0.10 | -0.04 | -0.15 | -0.10 | -0.08 | - | - | - | 0.09 | -0.18 | -0.10 |
| AMK | 0.24 | - | -0.10 | -0.10 | -0.04 | -0.15 | -0.10 | -0.08 | - | - | - | 0.09 | -0.18 | -0.10 |
Abbreviations: TIG, tigecycline; AZT, aztreonam; LEV, levofloxacin; TOB, tobramycin; IMP, imipenem; PMB, polymyxin B; COL, colistin; TZP, piperacillin/tazobactam; CAZ, ceftazidime; MEM, meropenem; CIP, ciprofloxacin; GEN, gentamicin; AMK, amikacin.
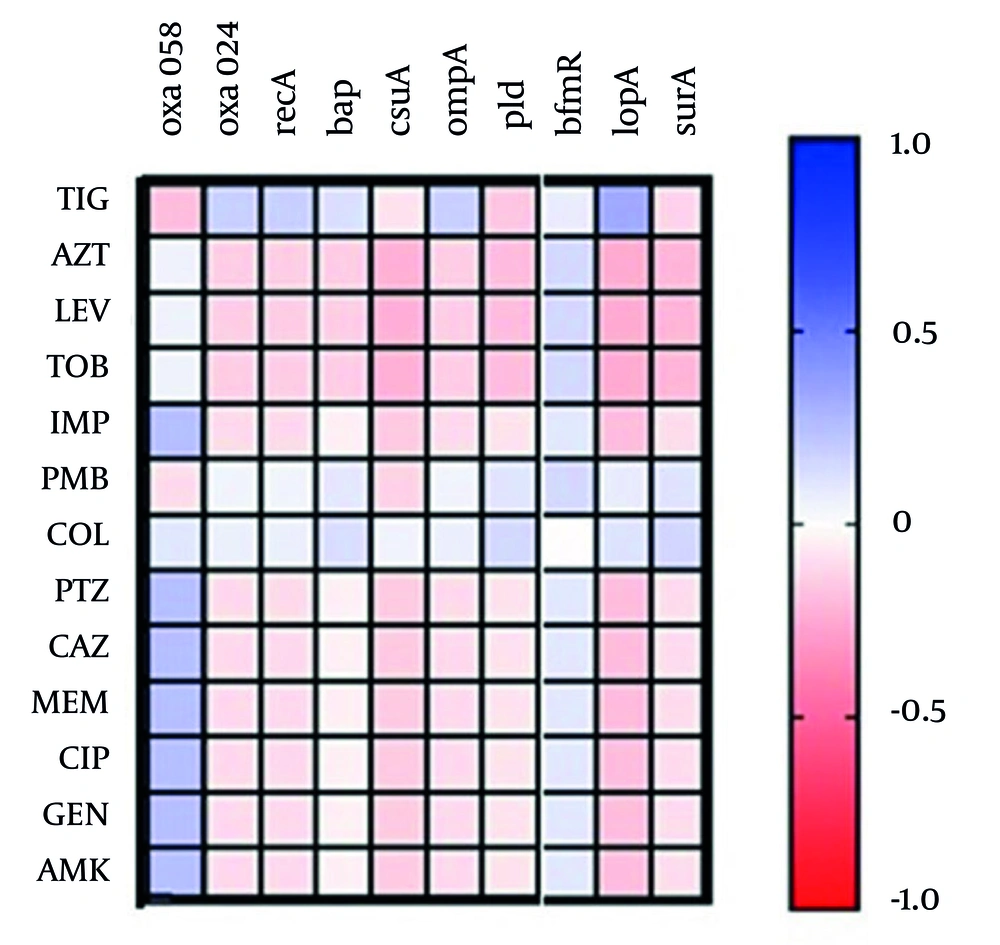
Heatmap illustrating correlations between antibiotic resistance and the presence of carbapenemase and virulence genes in 40 clinical Acinetobacter isolates: The heatmap shows the strength and direction of associations between resistance to different antibiotics and the presence of specific carbapenemase (blaOXA-58 and blaOXA-24) and virulence genes (recA, bap, csuA, ompA, pld, lipA, surA, and bfmR). Blue cells indicate a statistically significant positive correlation, while pink cells indicate a significant negative correlation. Non-colored or white cells represent no significant correlation. Antibiotic abbreviations and gene names are defined in the Methods section (the total number of isolates analyzed was 40).
4.4. Enterobacterial Repetitive Intergenic Consensus PCR Analysis
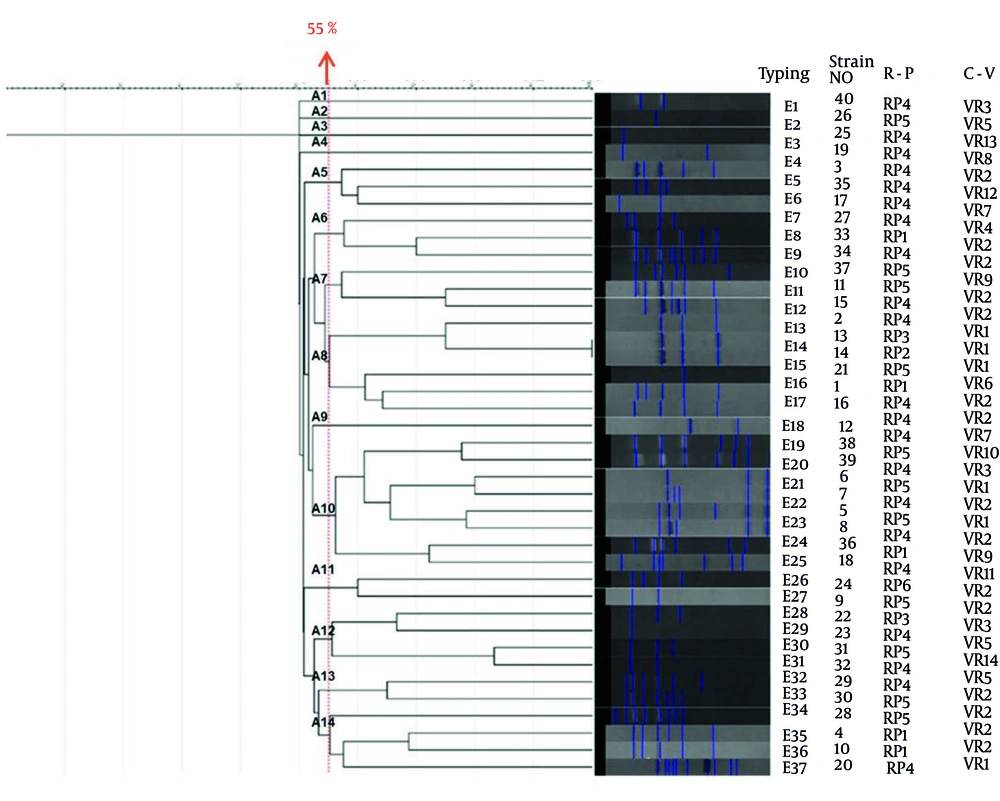
Enterobacterial repetitive intergenic consensus (ERIC)-PCR fingerprint profiles and UPGMA dendrogram of 40 clinical Acinetobacter isolates: The dendrogram (left) displays genetic relationships among 40 isolates based on ERIC-PCR banding patterns, analyzed by the unweighted pair group method with arithmetic mean (UPGMA). The Similarity Scale is shown at the top, and clusters (A1 - A14) are defined at a 55% similarity threshold (red dashed line). The central panel shows ERIC-PCR electropherograms, with blue bands representing DNA fragments. The right panel presents isolate information: Typing (ERIC type), strain No. (1 - 40), R-P (resistance profile; RP1 - RP5, refer to Figure 1), and C-V (combined virulence gene profile; VR1 - VR14, refer to Figure 2).


