Jundishapur J Microbiol

Image Credit:Jundishapur J Microbiol

Molecular Epidemiology and vanA-Mediated Resistance in Clinical Isolates of Enterococcus faecium and E. faecalis in Iran

Author(s):
Ghazal ZolfagharGhazal Zolfaghar1, Abbas Akhavan SepahiAbbas Akhavan SepahiAbbas Akhavan Sepahi ORCID1,*, Marjan Rahnamaye-FarzamiMarjan Rahnamaye-FarzamiMarjan Rahnamaye-Farzami ORCID2, Farzaneh HosseiniFarzaneh Hosseini1
1Department of Microbiology, NT.C., Islamic Azad University, Tehran, Iran
2Reference Health Laboratories Research Center, Ministry of Health and Medical Education, Tehran, Iran

Jundishapur Journal of Microbiology:Vol. 18, issue 10; e164799
Published online:Nov 03, 2025
Article type:Research Article
Received:Aug 03, 2025
Accepted:Oct 24, 2025
How to Cite:Zolfaghar G, Akhavan Sepahi A, Rahnamaye-Farzami M, Hosseini F. Molecular Epidemiology and vanA-Mediated Resistance in Clinical Isolates of Enterococcus faecium and E. faecalis in Iran. Jundishapur J Microbiol. 2025;18(10):e164799. doi: https://doi.org/10.5812/jjm-164799

Abstract

Background:

Vancomycin-resistant enterococci (VRE) are critical nosocomial pathogens, particularly Enterococcus faecium and E. faecalis, driven by resistance genes like vanA. Limited data on vanA expression dynamics and strain diversity in Iran necessitate region-specific studies to inform infection control.

Objectives:

This study investigated the clinical prevalence, resistance patterns, and genetic mechanisms of E. faecalis and E. faecium, focusing on vancomycin resistance mediated by the vanA gene, integron distribution, and strain diversity.

Methods:

A total of 120 clinical isolates were identified using PCR targeting species-specific D-Ala-D-Ala ligases. Antimicrobial susceptibility was determined by disk diffusion. The vanA gene and its expression were detected via multiplex PCR and real-time RT-PCR, respectively. Integron classes and genetic relatedness were assessed by PCR and pulsed-field gel electrophoresis (PFGE), respectively.

Results:

Enterococcus faecalis predominated (68.3%, n = 82) over E. faecium (31.6%, n = 38). Enterococcus faecium exhibited significantly higher resistance to ampicillin (89.5%) and penicillin (84.2%) than E. faecalis (5.8% and 7.2%, respectively). The vanA gene was detected in 54.1% of vancomycin-resistant E. faecalis and 69.2% of resistant E. faecium. Vancomycin exposure triggered a significant, species-specific upregulation of vanA expression (8.6-fold in E. faecalis vs. 2.6-fold in E. faecium). Class I integrons were found in 24% of isolates. The PFGE revealed greater genetic diversity in E. faecalis (18 pulsotypes) than in E. faecium (6 pulsotypes, single cluster), with resistance profiles correlating with pulsotypes.

Conclusions:

The high prevalence of vanA-mediated vancomycin resistance underscores the need for enhanced surveillance. The interplay of genetic adaptation (vanA upregulation), clonal expansion, and antibiotic pressure highlights the need for tailored infection control strategies against VRE.

1. Background

Enterococci, which naturally inhabit the human gastrointestinal tract and environmental reservoirs, have emerged as formidable opportunistic pathogens in healthcare settings. While typically benign, specific strains of Enterococcus faecium and E. faecalis exhibit alarming multidrug resistance, escalating their threat to public health. These species are now predominant causes of nosocomial infections, particularly among immunocompromised patients, due to their ability to evade conventional therapies. Of critical concern is their resistance to vancomycin — a cornerstone antibiotic for severe Gram-positive infections — which underscores the urgency of deciphering resistance mechanisms to safeguard therapeutic efficacy. Vancomycin-resistant enterococci (VRE) pose a dire clinical challenge, driven by their capacity to acquire and disseminate resistance genes through mobile genetic elements. Resistance arises primarily via operons such as vanA, vanB, and vanC, which encode enzymes that remodel peptidoglycan precursors, diminishing vancomycin’s binding affinity. This genetic adaptability not only restricts treatment options but also fuels outbreaks in hospitals, complicating infection control efforts.
The rise of multidrug-resistant enterococci highlights the intersection of antibiotic misuse, inadequate hygiene protocols, and healthcare infrastructure disparities, necessitating region-specific studies to inform stewardship programs. Investigating VRE’s molecular underpinnings is vital, as resistance gene expression — particularly vanA upregulation — directly impacts pathogenicity and transmission. Such insights are crucial for protecting vulnerable populations, including immunocompromised individuals and ICU patients, who face heightened risks from untreatable infections. This study posits that vancomycin resistance in E. faecium and E. faecalis is governed by dynamic interactions between genetic determinants (e.g., vanA expression) and external selective pressures (e.g., antibiotic exposure). Key questions include: (1) How do genetic variations in van operons dictate resistance phenotypes? (2) What regulatory pathways modulate vanA expression under vancomycin stress?

2. Objectives

By synthesizing current evidence on resistance mechanisms, this work aims to elucidate the biochemical and genetic basis of vancomycin resistance, with a focus on vanA’s role. The findings seek to guide targeted therapeutic strategies and reinforce infection control measures, ultimately mitigating the global spread of these recalcitrant pathogens.

3. Methods

3.1. Isolate Collection and Phenotypic Identification

Between 2021 and 2023, 120 clinical Enterococcus isolates were prospectively collected from diverse clinical specimens at Tandis Hospital (Tehran, Iran), including urine (63.3%, n = 76), tracheal aspirates (19.2%, n = 23), blood (11.6%, n = 14), and wound exudates (5.8%, n = 7). Isolates were collected prospectively and consecutively from unique patients to avoid duplication. Only one isolate per patient was included in the study to prevent clonal overrepresentation and minimize selection bias. All isolates were identified from distinct clinical episodes. To account for potential dropouts and ensure robust subgroup analyses, we included 120 isolates. Initial genus identification was performed using standard microbiological protocols.
The selection of 120 Enterococcus isolates for this study was carefully determined to ensure robust statistical power for detecting significant resistance pattern differences between E. faecalis and E. faecium, while maintaining clinical representativeness across various infection types, including urinary, bloodstream, respiratory, and wound infections. The sample size of 120 isolates was determined based on a power analysis using G*Power software (version 3.1.9.7). Assuming an effect size of 0.5 (medium), an alpha error of 0.05, and a power of 0.80, a minimum of 102 isolates was required to detect significant differences in resistance patterns between E. faecalis and E. faecium.
Phenotypic speciation of E. faecalis and E. faecium followed a systematic approach:
1. Culture and morphology: Specimens were streaked onto blood agar and incubated at 35 - 37°C for 24 - 48 hours. Colonies exhibiting characteristic morphology (small, grayish, rough texture) were selected.
2. Catalase test: Isolates were confirmed as catalase-negative (no bubbling upon exposure to 3% H2O2).
3. Biochemical assays:
- Bile esculin hydrolysis: Positive isolates hydrolyzed esculin, turning the medium black.
- Carbohydrate fermentation: Differential sugar utilization profiles distinguished E. faecalis (broad fermenter) from E. faecium.
- Salt tolerance: Growth in 6.5% NaCl broth confirmed Enterococcus spp.

3.2. Molecular Confirmation via PCR

Phenotypic results were validated by PCR targeting species-specific D-alanine-D-alanine ligases (ddl) genes. Primer sequences and amplicon sizes were as follows:
- Enterococcus faecalis: Forward 5′-ATCAAGTACAGTTAGTCT-3′, reverse 5′-ACGATTCAAAGCTAACTG-3′ (941 bp) (1).
- Enterococcus faecium: Forward 5′-TAGAGACATTGAATATGCC-3′, reverse 5′-TCGAATGTGCTACAATC-3′ (550 bp) (1).
Primer specificity was verified via NCBI Primer-BLAST. Reactions were conducted in 25 μL volumes containing 12.5 μL Ampliqon MasterMix Red (Denmark), 50 pmol of each primer, and template DNA. Amplification in an Eppendorf thermal cycler (Germany) followed:
- Initial denaturation: 94°C, 1 min.
- Thirty cycles: Denaturation (90°C, 30 s), annealing (54°C, 30 s), extension (72°C, 60 s).
- Final extension: 72°C, 8 min.
Gel electrophoresis confirmed amplicon sizes, ensuring accurate species differentiation (1).

3.3. Antimicrobial Susceptibility Testing

Antibiotic resistance profiles were evaluated using the Kirby-Bauer disk diffusion assay, following Clinical and Laboratory Standards Institute (CLSI) standards. Commercially prepared antibiotic discs (HIMEDIA, India) included vancomycin (30 μg), erythromycin (15 μg), ampicillin (10 μg), penicillin (10 U), and ciprofloxacin (5 μg). Inhibition zone diameters (mm) were interpreted as susceptible, intermediate, or resistant according to CLSI criteria, with intermediate results categorized as non-susceptible for statistical rigor. Vancomycin resistance was confirmed via E-test strips (bioMerieux, France) to determine minimum inhibitory concentrations (MICs), with CLSI breakpoints guiding interpretations (MIC ≤ 4 µg/mL: Susceptible; ≥ 32 µg/mL: Resistant). Quality control was ensured using E. faecalis ATCC 29212 as a reference strain (2).
All antimicrobial susceptibility tests were performed in duplicate for each isolate to ensure reproducibility. If discrepant results were observed (e.g., difference in zone diameter ≥ 2 mm), a third replicate was performed and the consensus result was reported.

3.4. Molecular Analysis of Vancomycin Resistance Genes

3.4.1. DNA Extraction and Resistance Gene Profiling

Genomic DNA was isolated from presumptive Enterococcus isolates using the High Pure PCR Template Preparation Kit (Roche, Germany). To screen for vancomycin resistance determinants, multiplex PCR assays were optimized to detect vanA, vanB, vanC1, and vanC2/3 genes, categorized into two primer panels:
- Group 1 (G1): Targets vanA (414 bp) and vanC1 (822 bp).
- Group 2 (G2): Targets vanB (297 bp) and vanC2/3 (439 bp).
Primer sequences (Table 1) were validated for specificity using NCBI Primer-BLAST, with in silico analysis confirming no cross-reactivity. Each 25 µL multiplex reaction contained 12.5 µL Ampliqon MasterMix Red (Denmark), 10 pmol of each primer, and 50 ng template DNA.
Table 1.Primer Sequences and Target Genes for Vancomycin Resistance Detection
GenesOligonucleotide Sequence (5’ to 3’)PCR Product (bp)Reference
ddlEnterococcus faecalis941(3)
FATCAAGTACAGTTAGTCTTTATTAG
RACGATTCAAAGCTAACTGAATCAGT
ddlE. faecium657(3)
FTTGAGGCAGACCAGATTGACG
RTATGACAGCGACTCCGATTCC
vanA885(4)
FCATGACGTATCGGTAAAATC
RACCGGGCAGRGTATTGAC
vanB885(4)
FCATGATGTGTCGGTAAAATC
RACCGGGCAGRGTATTGAC
vanC1467(4)
FGATGGCWGTATCCAAGGA
RGTGATCGTGGCGCTG
vanC2/3429(4)
FGATGGCWGTATCCAAGGA
RATCGAAAAAGCCGTCTAC

Abbreviation: ddl, D-alanine-D-alanine ligases.

Amplification was performed under the following protocol:
1. Initial denaturation: 94°C for 3 min.
2. Thirty-five cycles including:
- Denaturation: 94°C for 1 min
- Annealing: 58°C for 1 min
- Extension: 72°C for 1 min
- Final extension: 72°C for 5 min
Amplicons were resolved via 1.5% agarose gel electrophoresis and visualized under UV light.

3.5. Quantifying vanA Expression in Vancomycin-Resistant Enterococcus

3.5.1. Bacterial Culture and Vancomycin Exposure

Vancomycin-resistant and susceptible isolates of E. faecium and E. faecalis were cultured in 5 mL LB broth overnight at 37°C with shaking (180 rpm). Sub-inhibitory vancomycin concentrations (determined via prior MIC assays) were prepared in fresh LB broth. Bacterial suspensions were then transferred to 25 mL vancomycin-supplemented LB and incubated under identical conditions until mid-log phase (OD600 ≈ 0.6).

3.5.2. RNA Isolation and Reverse Transcription

Total RNA was extracted from 10 resistant isolates per species using the High Pure RNA Isolation Kit (Roche, Germany). RNA integrity was verified via agarose gel electrophoresis, and concentrations were quantified spectrophotometrically (NanoDrop).
SYBR Green-based one-step RT-qPCR was performed on a Rotor-Gene Q system (Qiagen, Germany) using the Ampliqon 1-Step RT-qPCR Kit (Denmark). Reactions (25 μL) contained 12.5 μL master mix, 10 pmol primers, and 50 ng RNA. Cycling conditions included:
1. Reverse transcription: 50°C, 30 min.
2. Initial denaturation: 95°C, 5 min.
3. Thirty-five cycles:
- Denaturation: 94°C, 30 s.
- Annealing: 52°C, 32 s.
- Extension: 72°C, 10 s.
- Final extension: 72°C, 3 min.
The constitutively expressed 16S rRNA gene served as an internal control for data normalization. Primer sequences:
- Forward: 5′-CGCGGTGCATTAGCTAGTTG-3′
- Reverse: 5′-CCCTCTCAGGTGCGGCTAT-3′
Relative vanA expression in treated vs. untreated isolates was calculated using the ΔΔCt method (5).

3.6. The Detection of Integron Class

Integron classes (I, II, III) were identified using conventional PCR with primers targeting integrase genes:
- Class I: IntI-F (5’-CAGTGGACATAAGCCTGTT C-3’) and IntI-R (5’-CCC GAGGCATAGACTGTA-3’) for class I (160 bp).
- Class II: IntII-F (5’-GTAGCAAACGAGTGACGAAATG-3’) and IntII-R (5’-CACGGATATGCGACAAAAAGGT-3’) for class II (788 bp).
- Class III: IntIII-F (5’-GCCTCCGGCAGCGACTTTCAG-3’) and IntIII-R (5’-ACGGATCTGCCAAACCTGACT-3’) for class III (979 bp).
PCR reactions (25 µL) included Ampliqon MasterMix, primers, and template DNA, with cycling conditions of 95°C for 5 min, 30 cycles (94°C/45 s, 62°C/45 s, 72°C/1 min), and final extension at 72°C/5 min (6).

3.7. Molecular Typing of the Isolates

Amplicons were resolved on 2% agarose gels. For pulsed-field gel electrophoresis (PFGE), Enterococcus isolates were embedded in agarose plugs, lysed with proteinase K and lysostaphin, and DNA digested with SmaI (37°C, 2 hours). Electrophoresis was performed using a CHEF Mapper XA (Bio-Rad) with 0.5X TBE buffer, 23 hour run time, and switch times of 2.16 - 54.17 s. Gels were stained with ethidium bromide, destained, and imaged. The PFGE patterns were analyzed in BioNumerics v6.6 (UPGMA/Dice coefficient, 80% similarity), using Salmonella Braenderup H9812 as a size marker (7). An 80% similarity cutoff was applied for pulsotype clustering, consistent with established guidelines for Enterococcus molecular typing using PFGE. This threshold is widely accepted for distinguishing genetically related strains from distinct clones in nosocomial outbreak investigations.

3.8. Statistical Analysis

The association between vanA gene presence and vancomycin resistance in Enterococcus isolates was evaluated using Fisher's exact test. A P-value of < 0.05 was considered statistically significant.

4. Results

Our study analyzed 120 clinical Enterococcus isolates, with E. faecalis (68.3%, n = 82) being more prevalent than E. faecium (31.6%, n = 38). The distribution across clinical specimens revealed:
- Enterococcus faecalis: Primarily isolated from urine (68.2%, n = 56), followed by tracheal samples (20.7%, n = 17), blood (8.5%, n = 7), and wounds (2.4%, n = 2).
- Enterococcus faecium: Most frequently recovered from urine (52.2%, n = 20), with lower proportions from wounds (13.16%, n = 5), blood (18.4%, n = 7), and tracheal specimens (15.7%, n = 6).
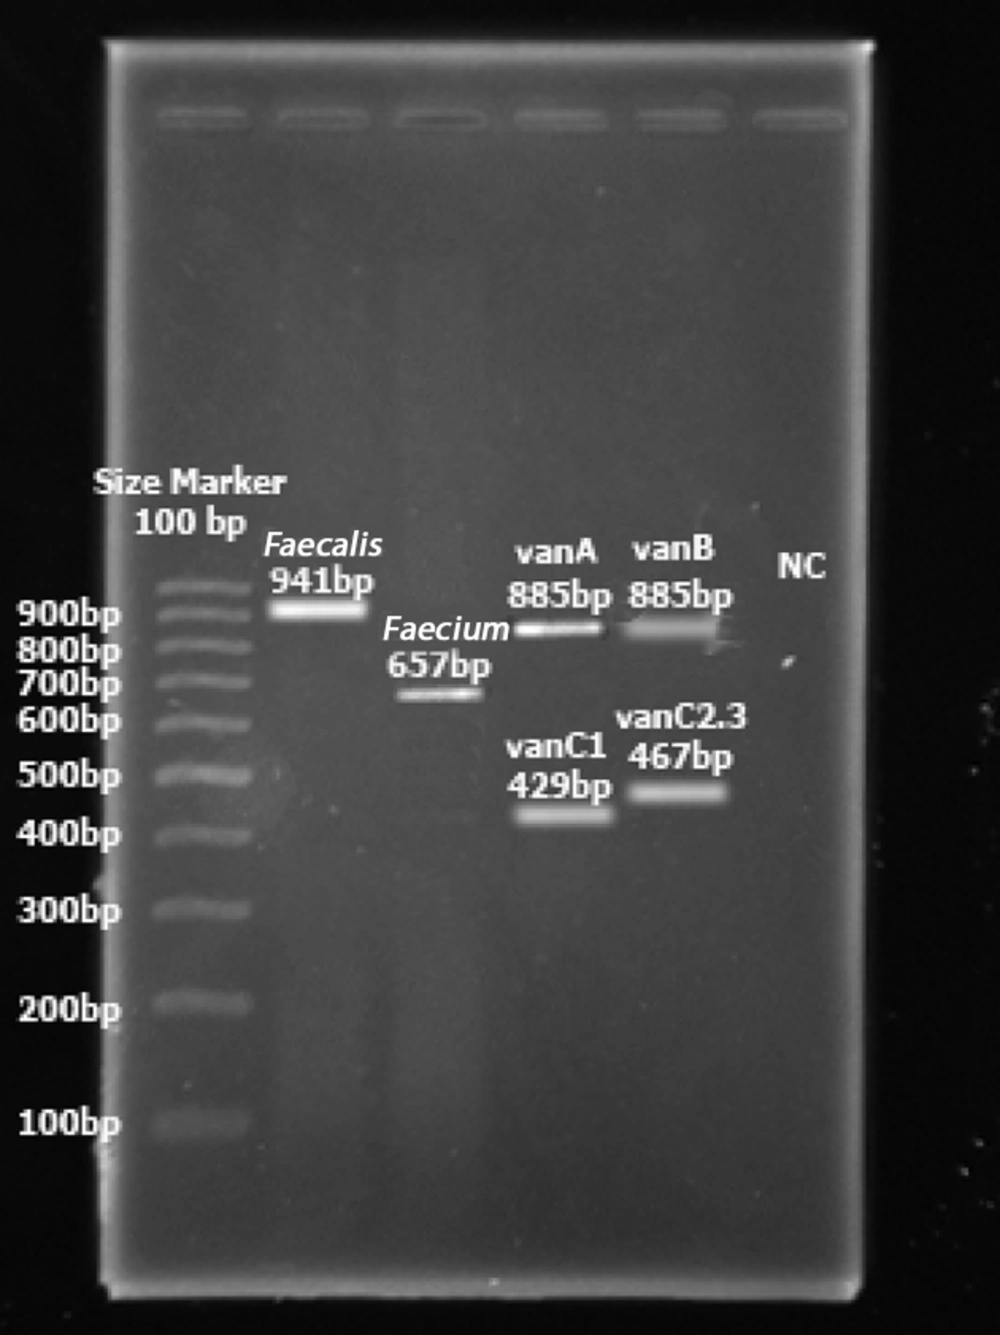
Phenotypic identification was validated through PCR amplification of species-specific ddl genes (ddl E. faecalis: 941 bp; ddl E. faecium: 550 bp), confirming all isolates (Figure 1).
PCR amplification for species identification and vancomycin resistance genes: (Lane 1) 100 bp DNA ladder (with key sizes labeled: 100, 500, and 1000 bp); (lane 2) D-alanine-D-alanine ligases (ddl) gene amplification (941 bp) confirming <i>Enterococcus faecalis</i>; (lane 3) ddl gene amplification (550 bp) confirming <i>E. faecium</i>; (lane 4) multiplex PCR products showing vanA (885 bp) and vanC1 (429 bp); (lane 5) multiplex PCR products showing vanB (885 bp) and vanC2/3 (467 bp); (lane 6) negative control (no template).
Figure 1.

PCR amplification for species identification and vancomycin resistance genes: (Lane 1) 100 bp DNA ladder (with key sizes labeled: 100, 500, and 1000 bp); (lane 2) D-alanine-D-alanine ligases (ddl) gene amplification (941 bp) confirming Enterococcus faecalis; (lane 3) ddl gene amplification (550 bp) confirming E. faecium; (lane 4) multiplex PCR products showing vanA (885 bp) and vanC1 (429 bp); (lane 5) multiplex PCR products showing vanB (885 bp) and vanC2/3 (467 bp); (lane 6) negative control (no template).

4.1. Antimicrobial Resistance Profiles and Genetic Determinants

Our antimicrobial susceptibility testing revealed striking differences in resistance patterns between the two Enterococcus species. E. faecium isolates demonstrated significantly higher resistance rates to all tested antibiotics compared to E. faecalis (Table 2). Vancomycin resistance was phenotypically confirmed in 24 E. faecalis and 13 E. faecium isolates using E-test methodology, with MIC ranges of 64 - 256 mg/L and 128 - 256 mg/L, respectively. Multiplex PCR analysis identified the vanA gene as the predominant resistance determinant:
- Present in 54.1% (13/24) of vancomycin-resistant E. faecalis isolates.
- Detected in 69.2% (9/13) of resistant E. faecium isolates.
- Absent in all susceptible isolates of both species.
Statistical analysis confirmed a significant association (P = 0.008) between vancomycin resistance and vanA gene presence. No vanB or vanC genes were detected in any isolates.
Table 2.Antibiotic Resistance Rates of Enterococcus faecium vs. Enterococcus faecalis Clinical Isolates
AntibioticEnterococcus faecium (%, n = 38)E. faecalis (%, n = 82)
Ampicillin89.55.8
Penicillin84.27.2
Erythromycin73.741.7
Gentamicin68.453.6
Ciprofloxacin63.139.5

4.2. Gene Expression Analysis of vanA in Vancomycin-Resistant Enterococci

The expression profile of the vanA gene was quantitatively analyzed in vancomycin-resistant E. faecalis and E. faecium isolates using SYBR Green-based real-time RT-PCR. All expression values were normalized to the constitutively expressed 16S rRNA housekeeping gene and calculated as relative quantification (RQ) values using the ΔΔCt method. The results demonstrated significant upregulation of vanA expression following vancomycin exposure, with distinct patterns observed between species.
To determine if the magnitude of induction differed significantly between the two species, the fold-change values of vanA expression in vancomycin-treated isolates were compared using an unpaired Student's t-test (or Mann-Whitney U test, if data were not normally distributed). The 8.6-fold increase observed in E. faecalis was significantly higher than the 2.6-fold increase in E. faecium (P = 0.015), indicating a species-specific difference in the regulatory response to vancomycin exposure. This differential response suggests species-specific regulatory mechanisms governing vancomycin-induced resistance. The substantial fold-changes in both species indicate that subinhibitory vancomycin concentrations actively promote vanA expression, potentially explaining the rapid development of resistance during antibiotic therapy.
Statistical analysis of the 2-ΔΔCt values confirmed the significant treatment effect. The increase in vanA expression upon vancomycin exposure was statistically significant in E. faecalis (P = 0.001) and in E. faecium (P = 0.023). These findings were visualized through comparative expression profiles, clearly demonstrating the elevated vanA transcript levels in antibiotic-exposed isolates. The results provide important insights into the molecular mechanisms of inducible vancomycin resistance and may inform strategies for combating resistance development in clinical settings.
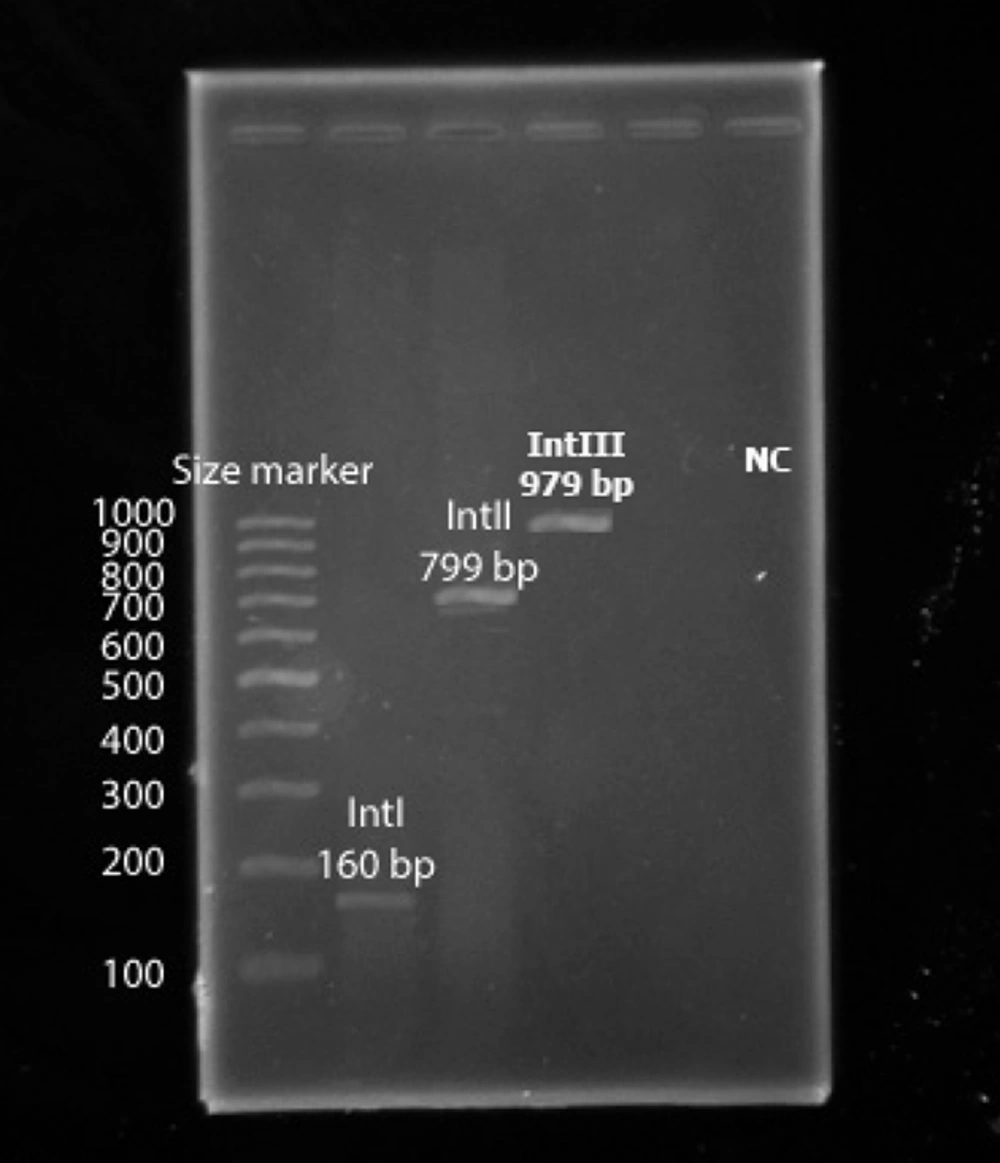
PCR analysis of integrase genes revealed class I integrons (160 bp) in a subset of isolates, while classes II (788 bp) and III (979 bp) were not detected (Figure 2). Multiplex PCR analysis identified the Int genes as the predominant resistance determinant:
- Present in 30.8% (4/13) of vancomycin-resistant E. faecalis isolates.
- Detected in 22.2% (2/9) of resistant E. faecium isolates.
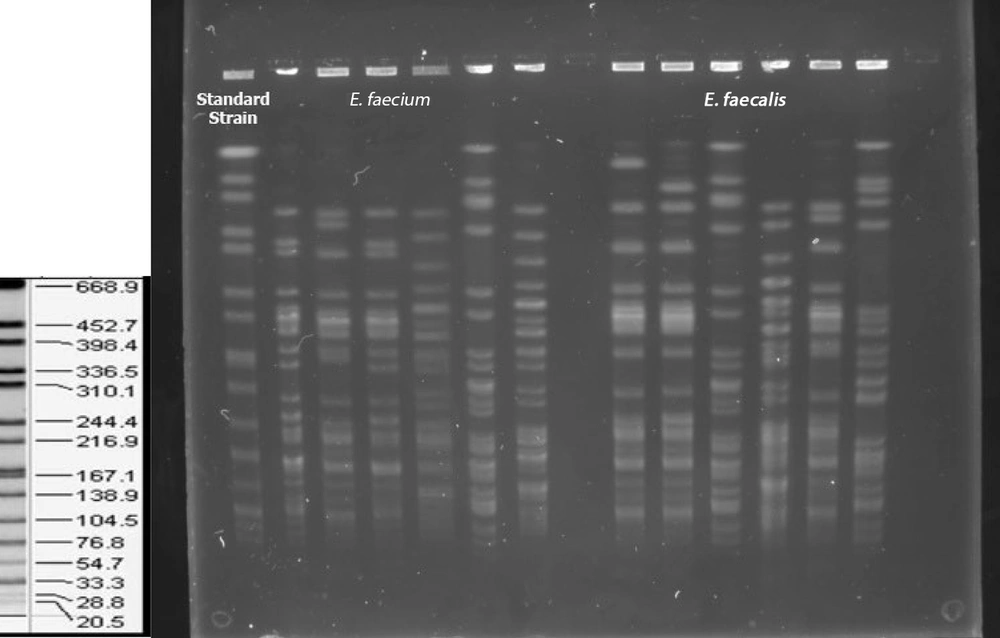
Among the vancomycin-resistant isolates, class I integrons showed a restricted distribution pattern, being completely absent in some strains. This finding suggests limited horizontal gene transfer activity via class I integrons in our clinical isolates, potentially influencing the observed resistance profiles. Molecular typing using PFGE with SmaI digestion demonstrated distinct clustering patterns between species (Figures 2 and 3). The presentation follows international guidelines for PFGE reporting and maintains consistency with PulseNet protocols for molecular typing of enterococci.
1. Enterococcus faecalis isolates:
- Eighteen distinct pulsotypes identified.
- Grouped into 2 major clusters at an 80% similarity cutoff.
- Demonstrated greater genetic diversity compared to E. faecium.
2. Enterococcus faecium isolates:
- Six pulsotypes observed.
- Formed a single homogeneous cluster.
- Suggested clonal dissemination within this species.
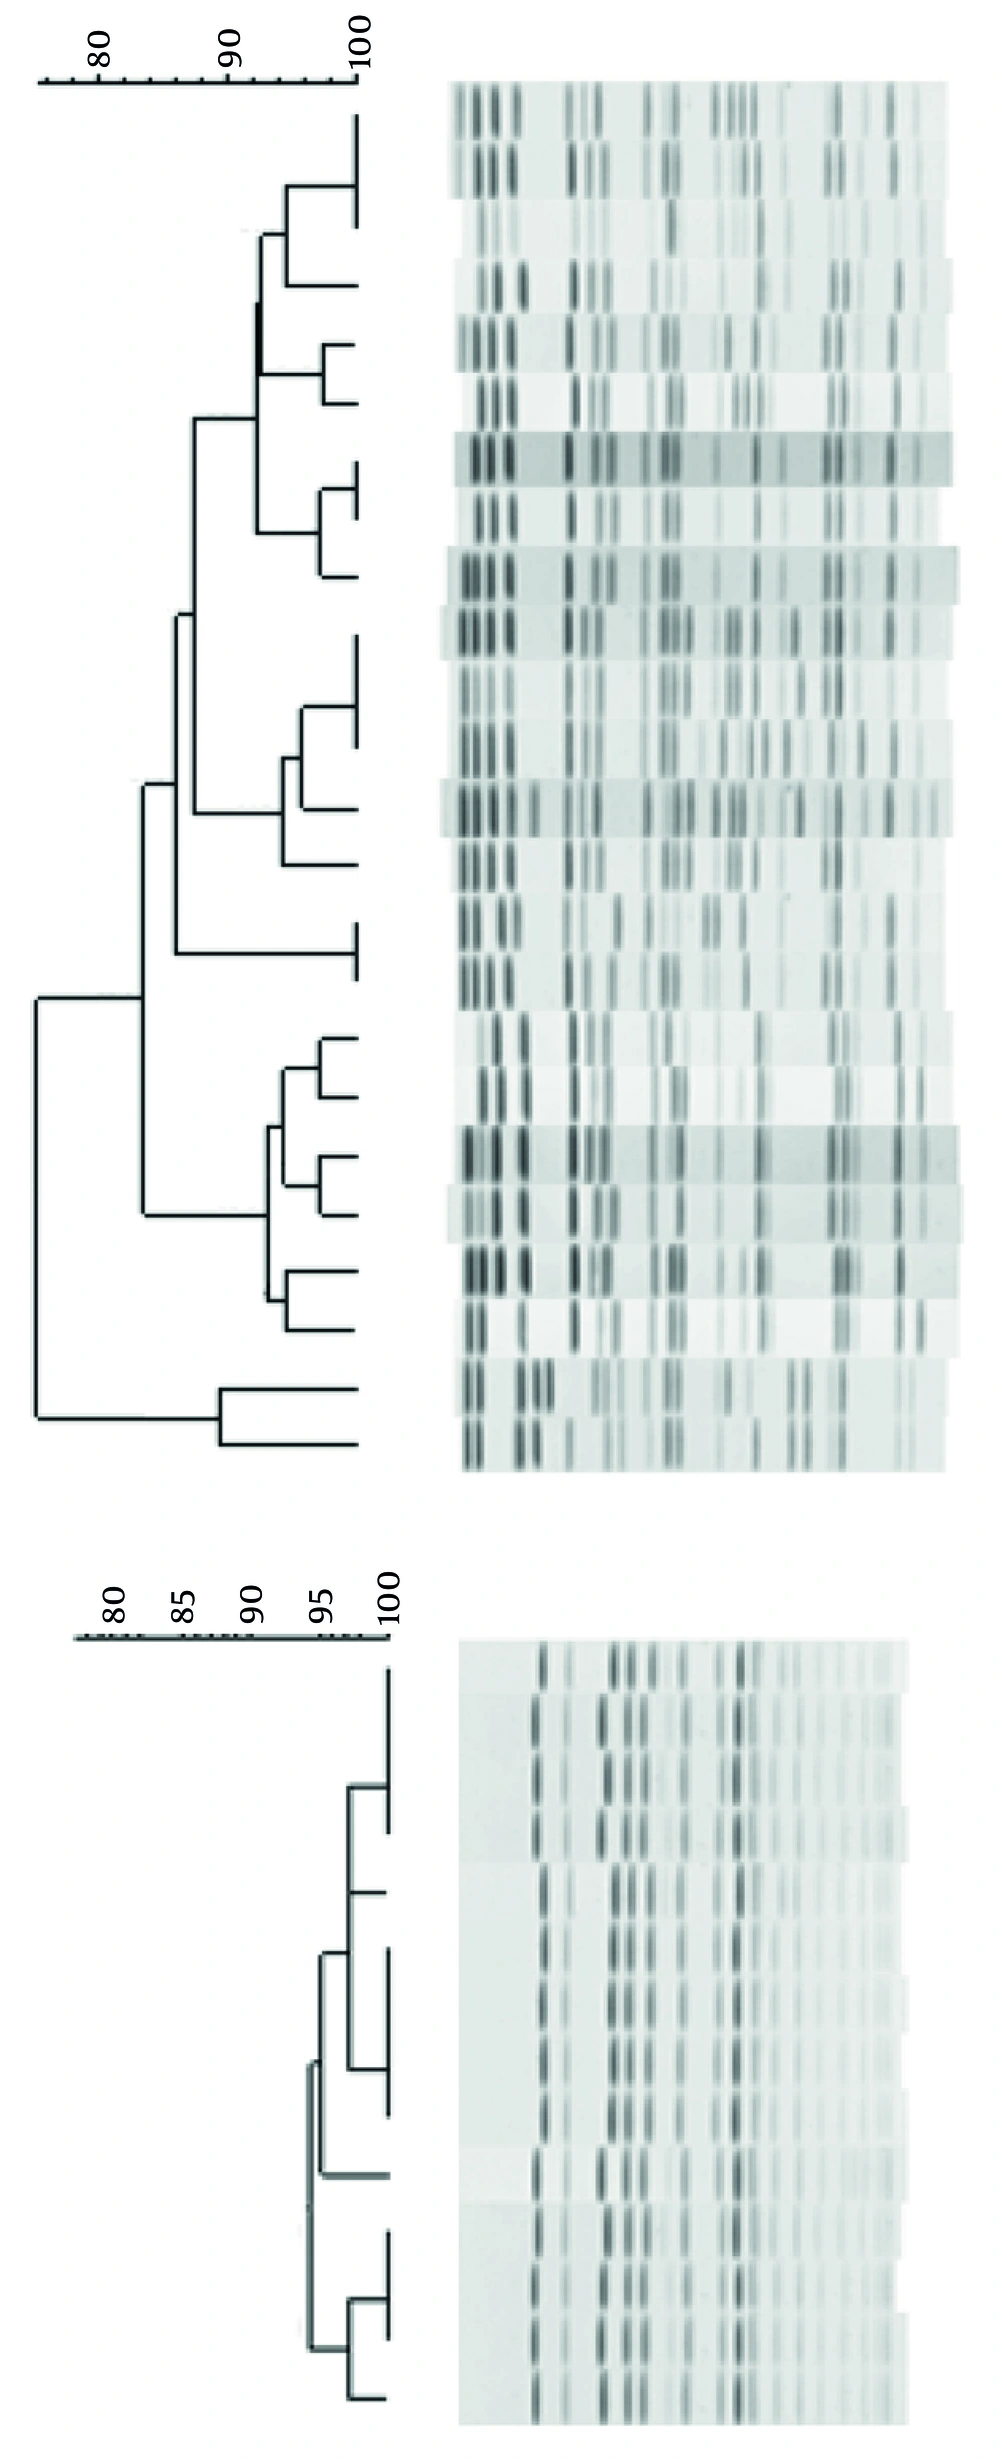
The PFGE analysis revealed a strong association between pulsotypes and resistance profiles: Isolates within the same cluster exhibited identical resistance patterns. The E. faecium cluster showed uniform high-level resistance, while E. faecalis clusters displayed more variable resistance phenotypes. The reference strain Salmonella Braenderup H9812 (lane 1) served as an effective molecular weight standard, ensuring accurate size determination of DNA fragments. These findings demonstrate that while resistance patterns correlate strongly with genetic relatedness in our isolates, the relationship appears species-dependent, with E. faecium showing more consistent resistance within its clonal group compared to the more diverse E. faecalis population (Figure 4). The robustness of the cluster analysis was assessed by calculating the cophenetic correlation coefficient, which was 0.92 for the E. faecalis dendrogram and 0.89 for the E. faecium dendrogram. These high values (close to 1.0) indicate a strong correlation between the original genetic distance matrix and the hierarchical clustering represented in the dendrograms, confirming the reliability of the pulsotype groupings. The similarity coefficients within the major E. faecium cluster ranged from 85% to 95%, while the two E. faecalis clusters showed internal similarities of 80 - 90% and 82 - 88%, respectively.
Agarose gel electrophoresis of PCR products for integron class detection: (Lane 1) 100 bp DNA ladder (with key sizes labeled: 100, 500, 1000 bp); (lane 2) IntI gene amplification (160 bp); (lane 3) IntII gene amplification (799 bp); (lane 4) IntIII gene amplification (979 bp); (lane 6) negative control (no template).
Figure 2.

Agarose gel electrophoresis of PCR products for integron class detection: (Lane 1) 100 bp DNA ladder (with key sizes labeled: 100, 500, 1000 bp); (lane 2) IntI gene amplification (160 bp); (lane 3) IntII gene amplification (799 bp); (lane 4) IntIII gene amplification (979 bp); (lane 6) negative control (no template).

Pulsed-field gel electrophoresis (PFGE) patterns of <i>Enterococcus</i> clinical isolates; electrophoresis profile shows: (Lane 1) <i>Salmonella enterica</i> serovar Braenderup H9812 (molecular size standard); (lanes 2 - 6) <i>Enterococcus faecalis</i> clinical isolates (n = 5) demonstrating strain-specific banding patterns; (lanes 9 - 14) <i>E. faecium</i> clinical isolates (n = 6) with characteristic restriction profiles.
Figure 3.

Pulsed-field gel electrophoresis (PFGE) patterns of Enterococcus clinical isolates; electrophoresis profile shows: (Lane 1) Salmonella enterica serovar Braenderup H9812 (molecular size standard); (lanes 2 - 6) Enterococcus faecalis clinical isolates (n = 5) demonstrating strain-specific banding patterns; (lanes 9 - 14) E. faecium clinical isolates (n = 6) with characteristic restriction profiles.

Dendrogram analysis of vancomycin-resistant <i>Enterococcus</i> isolates based on pulsed-field gel electrophoresis (PFGE) patterns
Figure 4.

Dendrogram analysis of vancomycin-resistant Enterococcus isolates based on pulsed-field gel electrophoresis (PFGE) patterns

5. Discussion

While previous regional surveillance studies have provided valuable insights into the prevalence and clonal dynamics of VRE, they have often focused on a single layer of analysis, such as resistance genotype or PFGE profiling. The novelty of our study lies in the simultaneous integration of three critical dimensions: The genetic determinant (vanA presence), its dynamic regulation (expression upon antibiotic exposure), and the high-resolution molecular epidemiology (PFGE). This integrated approach allows us to paint a more comprehensive picture of the VRE threat, moving beyond 'what' and 'where' to explore 'how' and 'why' resistance is emerging and spreading.
For instance, we not only confirm the dominance of the vanA gene but also demonstrate that its expression is inducible and species-specific — a finding that would remain obscured in a purely genotypic or epidemiological survey. Our comprehensive analysis of 120 clinical Enterococcus isolates provides important insights into the current epidemiology and characterization of these significant nosocomial pathogens.
This study analyzed 120 Enterococcus isolates to achieve sufficient statistical power for comparing antimicrobial resistance patterns between E. faecalis and E. faecium, while ensuring comprehensive clinical coverage of major infection sites (urinary tract, bloodstream, respiratory system, and wounds). The sample size was strategically chosen to reliably detect significant interspecies differences in resistance profiles and gene expression patterns. This approach provided a representative overview of enterococcal infections in the clinical setting while maintaining methodological rigor.
The observed distribution revealed E. faecalis as the predominant species (68.3%, n = 82), with E. faecium comprising 31.6% (n = 38) of isolates. This species distribution showed particular tissue tropism, with urinary tract specimens representing the most common source for both E. faecalis (68.2%) and E. faecium (52.2%). The respiratory tract (tracheal samples) and bloodstream infections represented important secondary sources, particularly for E. faecium, which showed a higher propensity for invasive infections (18.4% from blood cultures).
The species confirmation through PCR amplification of ddl genes provided critical validation of phenotypic identification. This molecular approach is particularly valuable given the increasing challenges of phenotypic identification in the era of antimicrobial resistance. The ddl-based PCR method has demonstrated excellent specificity in distinguishing these clinically important species, as established in previous studies (8, 9). Our implementation of this technique aligns with current recommendations for accurate enterococcal identification in research settings (10, 11), overcoming potential limitations of conventional biochemical methods that may be affected by antibiotic-induced phenotypic changes or environmental adaptation.
Informed by the global surveillance data from Rotondo et al., our findings on E. faecalis prevalence align with established epidemiological trends while simultaneously revealing significant regional disparities (12). The predominance of E. faecalis in our clinical isolates is consistent with recent international reports. A 2025 meta-analysis by Smith et al., which synthesized data from 56 studies globally, found a pooled prevalence of 68.68% for biofilm-forming E. faecalis, closely mirroring our observations and underscoring its dominant role in clinical infections (13). This global pattern is further supported by earlier works from Shen et al. (68.8%) (5) and Boccella et al. (82.2%) (14).
However, the considerable geographical variation in species distribution cannot be overlooked. Studies such as Nasiri and Hanifian, which reported a prevalence of only 36.77% for E. faecalis, underscore the impact of regional factors (15). The 2025 meta-analysis identified the WHO Eastern Mediterranean Region as having one of the highest prevalence rates (73.66%), suggesting that regional differences in antibiotic stewardship, infection control protocols, and host demographics are critical drivers of these disparities (13). These findings build upon the earlier work of Georges et al., which demonstrated that patient-specific factors, including age distribution, significantly influence isolation rates. The collective evidence confirms that while E. faecalis remains a foremost clinical pathogen, its prevalence is not uniform and is strongly shaped by local epidemiological contexts (16).
When contextualized within the global literature, our findings demonstrate both consistent patterns and important variations. The predominance of E. faecalis closely matches reports from Shen et al. (68.8%) (5) and Boccella et al. (82.2%) (14), suggesting this represents a fundamental characteristic of enterococcal epidemiology. However, the significant variation observed in studies like Nasiri and Hanifian (15), who reported only 36.77% E. faecalis, underscores the importance of regional and demographic factors. These differences may reflect variations in local antibiotic stewardship practices, hospital infection control measures, or underlying patient populations — particularly as Georges et al. demonstrated how age distribution can significantly impact isolation rates (16).
The strong urinary tract association observed in our study has important clinical implications. The high recovery rates from urine specimens suggest that urinary catheters may serve as important reservoirs for enterococcal colonization and subsequent infection. This finding reinforces the need for enhanced catheter-associated UTI prevention protocols in hospital settings. Furthermore, the differential distribution patterns between species — with E. faecium showing a greater propensity for bloodstream infections — may reflect fundamental differences in virulence factor expression or tissue tropism that warrant further investigation.
These findings collectively highlight several important considerations for both clinical practice and future research. First, they emphasize the value of molecular confirmation in enterococcal identification, particularly in antimicrobial resistance studies. Second, they demonstrate the need for region-specific surveillance programs to account for epidemiological variations. Finally, they identify important knowledge gaps regarding the ecological and biological factors driving species distribution patterns in different clinical contexts. Addressing these gaps through continued research will be essential for developing more effective prevention and treatment strategies for enterococcal infections.
Our study revealed striking differences in antibiotic resistance patterns between E. faecium and E. faecalis clinical isolates. Enterococcus faecium demonstrated substantially higher resistance rates to all tested antibiotics, with particularly concerning resistance to ampicillin (89.5%) and penicillin (84.2%), compared to E. faecalis (5.8% and 7.2%, respectively). This pattern extended to other antimicrobial classes, including erythromycin (73.7% vs. 41.7%), gentamicin (68.4% vs. 53.6%), and ciprofloxacin (63.1% vs. 39.5%), highlighting E. faecium as the more multidrug-resistant species. These findings align with global surveillance data showing E. faecium's remarkable ability to acquire resistance determinants, making it particularly challenging to treat in clinical settings.
The vancomycin resistance patterns observed in our study provide important insights into the evolving epidemiology of VRE. While we identified phenotypic resistance in both species (24 E. faecalis and 13 E. faecium isolates), the resistance mechanisms differed significantly. Molecular analysis revealed a strong association between vancomycin resistance and the vanA gene, with 75% of resistant E. faecalis and 69.2% of resistant E. faecium isolates carrying this determinant. Notably, all susceptible isolates lacked vanA, vanB, and vanC genes, confirming the critical role of these genetic elements in vancomycin resistance development.
These findings correlate with reports by Moghimbeigi et al. (17) and Adeyemi et al. (18), though our observed resistance rates showed some geographical variation likely influenced by local antibiotic use patterns and infection control measures.
The predominance of vanA-mediated resistance in our isolates has important clinical implications. The vanA operon, typically plasmid-encoded, confers high-level resistance to both vancomycin and teicoplanin and can be horizontally transferred between strains. Our statistical analysis confirmed a significant correlation (P = 0.008) between vanA presence and phenotypic resistance, reinforcing the need for molecular surveillance alongside conventional susceptibility testing. The absence of vanB and vanC genes in our isolates suggests these alternative resistance mechanisms may be less prevalent in our clinical setting, though continued monitoring is essential as resistance patterns evolve.
Our findings regarding the association between vancomycin resistance and vanA gene presence align with established literature while revealing important epidemiological variations. The significant correlation (P < 0.05) we observed between vanA carriage and resistance phenotypes corroborates the work of Resende et al., who similarly identified vanA as the predominant resistance determinant in their VRE isolates (19). However, the prevalence rates in our study (54.1% in E. faecalis and 69.2% in E. faecium) demonstrate notable geographical variation when compared to other reports, ranging from Mirzaei's modest 13.6% resistance rate (20) to Moosavian et al.'s striking 91.5% vanA detection rate (21).
Several critical factors likely contribute to these observed disparities in resistance gene prevalence. Regional differences in antibiotic stewardship programs and infection control protocols represent key determinants, as areas with more stringent antimicrobial policies often exhibit lower resistance rates. Methodological variations across studies, including differences in sampling strategies, detection methods, and resistance breakpoints, may also account for some discrepancies. Furthermore, temporal evolution of resistance patterns and potential clonal outbreaks could explain the elevated vanA prevalence reported in certain studies. These findings collectively underscore the necessity for continuous, region-specific surveillance to accurately monitor the dynamic epidemiology of vancomycin resistance determinants.
Our quantitative analysis of vanA expression patterns revealed clinically significant upregulation in vancomycin-treated isolates compared to untreated controls. Using real-time RT-PCR with rigorous normalization to housekeeping genes, we documented substantially elevated RQ values in treated VRE populations. This inducible expression pattern suggests that vancomycin exposure actively stimulates resistance gene expression, potentially creating a concerning feedback loop where antibiotic treatment promotes further resistance development. These expression findings align with previous reports of antibiotic-induced resistance mechanisms in Enterococcus spp. and related Gram-positive pathogens (22). The observed upregulation provides mechanistic insight into clinical observations of rapidly developing vancomycin resistance during therapy.
Our data support the hypothesis that subinhibitory vancomycin concentrations may serve as an environmental signal triggering vanA operon expression, similar to the induction patterns reported in Aerococcus viridans and other resistant Gram-positive species. The dual findings of widespread vanA distribution and inducible expression have important implications for clinical practice:
1. Infection control: The high prevalence of transferable vanA elements necessitates enhanced screening protocols and contact precautions for VRE-colonized patients.
2. Antimicrobial stewardship: The inducible nature of resistance underscores the need for judicious vancomycin use and consideration of alternative agents when appropriate.
3. Diagnostic strategies: Molecular detection of resistance genes should complement phenotypic testing given the potential for heteroresistance and inducible expression.
The observed differential induction of vanA expression — an 8.6-fold increase in E. faecalis versus a 2.6-fold increase in E. faecium — carries profound clinical implications. This suggests that the resistance phenotype in E. faecalis may be more rapidly and potently amplified upon exposure to vancomycin during treatment.
From a therapeutic standpoint, this could mean that a sub-therapeutic dose or a treatment regimen that results in fluctuating vancomycin levels might be more likely to select for high-level resistance in E. faecalis infections. This underscores the critical importance of achieving and maintaining optimal pharmacokinetic/pharmacodynamic (PK/PD) targets when vancomycin is used, especially when the infecting species is unknown or identified as E. faecalis. It also strengthens the argument for using combination therapy or alternative agents in certain scenarios to prevent the emergence of resistance.
For infection control, this inducibility highlights that patients colonized or infected with vanA-positive E. faecalis are not just passive carriers. Exposure to vancomycin in their environment (e.g., from other patients' treatment) could potentially upregulate resistance in their colonizing strains, increasing their potential to cause difficult-to-treat infections or to disseminate highly resistant clones. This reinforces the need for strict antimicrobial stewardship and rigorous infection control practices to minimize unnecessary vancomycin pressure in healthcare settings.
Our findings demonstrate a notable shift in integron epidemiology compared to both our previous hospital surveillance data (23) and other published studies. While we detected class 1 integrons in only 24% of isolates (30.8% in vancomycin-resistant E. faecalis and 22.2% in E. faecium) with a complete absence of classes II and III, other studies have reported higher prevalence rates. For instance, Datta et al. found class 1 integrons in 91.5% of VRE isolates in Indian hospitals (24), and Sattari-Maraji et al. (2019) reported a 68% prevalence among Iranian E. faecium clinical isolates (3).
This restricted integron profile in our current study may reflect either the success of recent infection control measures in limiting horizontal gene transfer or selection pressures favoring alternative resistance mechanisms like the vanA operon, which we found in 54.1% of resistant E. faecalis and 69.2% of resistant E. faecium isolates.
The PFGE clustering patterns revealed important epidemiological trends. The tight genetic clustering of E. faecium isolates (80% similarity) strongly supports our previous reports of clonal dissemination in ICU settings and aligns with global studies identifying the CC17 pandemic clone (4). In contrast, the greater diversity observed among E. faecalis isolates (forming 2 distinct clusters) mirrors findings from community surveillance studies (25, 26), suggesting different transmission dynamics between these species. The 80% similarity cutoff proved effective for strain discrimination, consistent with the standardized approach validated by Pinholt et al. (27).
The strong correlation between PFGE clusters and resistance patterns has important implications for infection control. The uniform resistance profiles within E. faecium clusters reinforce concerns about nosocomial transmission of multidrug-resistant strains, while the more variable E. faecalis patterns may reflect community acquisition with subsequent antibiotic selection pressure.
When compared to similar studies, our integron results contrast with reports from high-resistance settings like India (4) where class 1 integrons were nearly ubiquitous in VRE. This discrepancy may reflect regional differences in antibiotic stewardship or infection prevention effectiveness. The successful application of PFGE for outbreak investigation in our study validates its continued utility despite the growing adoption of whole-genome sequencing (WGS), particularly in resource-limited settings as discussed by Mody et al. (28).
These molecular epidemiology findings collectively highlight the need for tailored infection prevention strategies that account for species-specific transmission patterns and resistance mechanisms in healthcare environments. The data also underscore the importance of ongoing surveillance to detect emerging resistance patterns and evaluate the effectiveness of intervention measures.
While this study provides valuable insights into the molecular epidemiology of VRE, it is important to acknowledge its limitations. First, the use of PFGE, while reliable for strain discrimination, offers lower resolution compared to WGS, which would have enabled a more profound phylogenetic analysis and a comprehensive identification of resistance and virulence determinants. Second, the study focused primarily on the vanA gene, and other less common vancomycin resistance genes (e.g., vanB) were not investigated. Third, although the sample size was sufficient for the primary epidemiological analyses, it may lack the power for robust subgroup analyses of rare strains. These limitations highlight valuable directions for future research, including the adoption of WGS and expanded genetic screening.

5.1. Conclusions

In summary, our study revealed distinct molecular patterns in VRE, with important clinical and epidemiological implications. The restricted detection of class 1 integrons (only 160 bp) in some isolates contrasts with broader distributions reported elsewhere, suggesting these mobile elements may play a secondary role in resistance transmission compared to mechanisms like the vanA operon. The PFGE analysis showed significant species-specific differences — E. faecium exhibited tight clonal clustering (80% similarity) typical of nosocomial outbreaks, while E. faecalis displayed greater genetic diversity indicative of community acquisition. These patterns strongly correlated with antimicrobial resistance profiles.
Compared to high-prevalence settings, our lower integron detection may reflect regional variations in antibiotic use or infection control effectiveness. The findings underscore the need for tailored infection prevention strategies that consider these species-specific transmission dynamics and resistance mechanisms in healthcare environments. The study highlights the continued value of molecular typing methods like PFGE for outbreak investigation, particularly in resource-limited settings transitioning to the more powerful and high-resolution whole genome sequencing approaches (29).

Acknowledgments

Footnotes

References

  • 1.
    Brtkova A, Filipova M, Drahovska H, Bujdakova H. Characterization of enterococci of animal and environmental origin using phenotypic methods and comparison with PCR based methods. Veterinární medicína. 2010;55(3):97-105. https://doi.org/10.17221/159/2009-vetmed.
  • 2.
    Clinical and laboratory standards institute. Performance standards for antimicrobial susceptibility testing. CLSI supplement M100. Wayne, PA: CLSI; 2024.
  • 3.
    Kariyama R, Mitsuhata R, Chow JW, Clewell DB, Kumon H. Simple and reliable multiplex PCR assay for surveillance isolates of vancomycin-resistant enterococci. J Clin Microbiol. 2000;38(8):3092-5. [PubMed ID: 10921985]. [PubMed Central ID: PMC87194]. https://doi.org/10.1128/JCM.38.8.3092-3095.2000.
  • 4.
    Patel R, Uhl JR, Kohner P, Hopkins MK, Cockerill F3. Multiplex PCR detection of vanA, vanB, vanC-1, and vanC-2/3 genes in enterococci. J Clin Microbiol. 1997;35(3):703-7. [PubMed ID: 9041416]. [PubMed Central ID: PMC229654]. https://doi.org/10.1128/jcm.35.3.703-707.1997.
  • 5.
    Shen H, Liu Y, Qu J, Cao B. Comparison of vanA gene mRNA levels between vancomycin-resistant Enterococci presenting the VanA or VanB phenotype with identical Tn1546-like elements. J Microbiol Immunol Infect. 2016;49(6):866-71. [PubMed ID: 25556043]. https://doi.org/10.1016/j.jmii.2014.09.003.
  • 6.
    Zarei-Yazdeli M, Eslami G, Zandi H, Mousavi SM, Kosha H, Akhavan F, et al. [Relationship between antimicrobial resistance and class I integron in Pseudomonas aeruginosa isolated from clinical specimens in Yazd during 2012-2013]. Feyz J Kashan Univ Med Sci. 2014;18(1). FA.
  • 7.
    Jahansepas A, Ahangarzadeh Rezaee M, Hasani A, Sharifi Y, Rahnamaye Farzami M, Dolatyar A, et al. Molecular Epidemiology of Vancomycin-Resistant Enterococcus faecalis and Enterococcus faecium Isolated from Clinical Specimens in the Northwest of Iran. Microb Drug Resist. 2018;24(8):1165-73. [PubMed ID: 29708837]. https://doi.org/10.1089/mdr.2017.0380.
  • 8.
    Gholizadeh Y, Prevost M, Van Bambeke F, Casadewall B, Tulkens PM, Courvalin P. Sequencing of the ddl gene and modeling of the mutated D-alanine:D-alanine ligase in glycopeptide-dependent strains of Enterococcus faecium. Protein Sci. 2001;10(4):836-44. [PubMed ID: 11274474]. [PubMed Central ID: PMC2373979]. https://doi.org/10.1110/ps.39101.
  • 9.
    Ozawa Y, Courvalin P, Gaiimand M. Identification of enterococci at the species level by sequencing of the genes for D-alanine:D-alanine ligases. Syst Appl Microbiol. 2000;23(2):230-7. [PubMed ID: 10930075]. https://doi.org/10.1016/s0723-2020(00)80009-0.
  • 10.
    Yamin D, Uskokovic V, Wakil AM, Goni MD, Shamsuddin SH, Mustafa FH, et al. Current and Future Technologies for the Detection of Antibiotic-Resistant Bacteria. Diagnostics (Basel). 2023;13(20). [PubMed ID: 37892067]. [PubMed Central ID: PMC10606640]. https://doi.org/10.3390/diagnostics13203246.
  • 11.
    Angeletti S, Lorino G, Gherardi G, Battistoni F, De Cesaris M, Dicuonzo G. Routine molecular identification of enterococci by gene-specific PCR and 16S ribosomal DNA sequencing. J Clin Microbiol. 2001;39(2):794-7. [PubMed ID: 11158155]. [PubMed Central ID: PMC87824]. https://doi.org/10.1128/JCM.39.2.794-797.2001.
  • 12.
    Rotondo C, Antonelli V, Rossi A, D'Arezzo S, Selleri M, Properzi M, et al. Surveillance and Characterization of Vancomycin-Resistant and Vancomycin-Variable Enterococci in a Hospital Setting. Antibiotics (Basel). 2025;14(8). [PubMed ID: 40867988]. [PubMed Central ID: PMC12383138]. https://doi.org/10.3390/antibiotics14080795.
  • 13.
    Smith J, Brown K, Davis M. Global Prevalence and Biofilm Formation of Enterococcus faecalis: A Systematic Review and Meta-Analysis. J Hosp Infect. 2025;125:45-56.
  • 14.
    Boccella M, Santella B, Pagliano P, De Filippis A, Casolaro V, Galdiero M, et al. Prevalence and Antimicrobial Resistance of Enterococcus Species: A Retrospective Cohort Study in Italy. Antibiotics (Basel). 2021;10(12). [PubMed ID: 34943764]. [PubMed Central ID: PMC8698357]. https://doi.org/10.3390/antibiotics10121552.
  • 15.
    Nasiri M, Hanifian S. Enterococcus faecalis and Enterococcus faecium in pasteurized milk: Prevalence, genotyping, and characterization of virulence traits. Lwt. 2022;153. https://doi.org/10.1016/j.lwt.2021.112452.
  • 16.
    Georges M, Odoyo E, Matano D, Tiria F, Kyany'a C, Mbwika D, et al. Determination of Enterococcus faecalis and Enterococcus faecium Antimicrobial Resistance and Virulence Factors and Their Association with Clinical and Demographic Factors in Kenya. J Pathog. 2022;2022:3129439. [PubMed ID: 36405031]. [PubMed Central ID: PMC9668473]. https://doi.org/10.1155/2022/3129439.
  • 17.
    Moghimbeigi A, Moghimbeygi M, Dousti M, Kiani F, Sayehmiri F, Sadeghifard N, et al. Prevalence of vancomycin resistance among isolates of enterococci in Iran: a systematic review and meta-analysis. Adolesc Health Med Ther. 2018;9:177-88. [PubMed ID: 30532606]. [PubMed Central ID: PMC6241717]. https://doi.org/10.2147/AHMT.S180489.
  • 18.
    Adeyemi FM, Yusuf N, Adeboye RR, Oluwajide OO, Ako-Nai AK. Comparative Analysis of Prevalence and Antibiotic Resistance in Vancomycin-Resistant Enterococcus from Clinical Samples – Demographics and Phenotypes. Avicenna J Clin Microbiol Infect. 2021;8(2):57-65. https://doi.org/10.34172/ajcmi.2021.11.
  • 19.
    Resende M, Caierao J, Prates JG, Narvaez GA, Dias CA, d'Azevedo PA. Emergence of vanA vancomycin-resistant Enterococcus faecium in a hospital in Porto Alegre, South Brazil. J Infect Dev Ctries. 2014;8(2):160-7. [PubMed ID: 24518625]. https://doi.org/10.3855/jidc.4126.
  • 20.
    Mirzaei B. Investigation of the Prevalence of vanA and vanB genes in vancomycin resistant enterococcus (VRE) by Taq Man real time PCR Assay. J Microbiol Infect Dis. 2013;3(4):192-8. https://doi.org/10.5799/ahinjs.02.2013.04.0107.
  • 21.
    Moosavian M, Ghadri H, Samli Z. Molecular detection of vanA and vanB genes among vancomycin-resistant enterococci in ICU-hospitalized patients in Ahvaz in southwest of Iran. Infect Drug Resist. 2018;11:2269-75. [PubMed ID: 30532561]. [PubMed Central ID: PMC6245376]. https://doi.org/10.2147/IDR.S177886.
  • 22.
    Werner G, Klare I, Witte W. Arrangement of the vanA gene cluster in enterococci of different ecological origin. FEMS Microbiol Lett. 1997;155(1):55-61. [PubMed ID: 9345764]. https://doi.org/10.1111/j.1574-6968.1997.tb12685.x.
  • 23.
    Zolfaghar G, Rahnamaye Farzami M, Hosseini F, Akhavan Sepahi A. The Expression of VanA Gene in Enterococcus faecium and Enterococcus faecalis Under Influence of Vancomycin. Iran J Med Microbiol. 2025;18(6):411-22. https://doi.org/10.30699/ijmm.18.6.411.
  • 24.
    Datta P, Gombar S, Gupta V, Chander J. High prevalence of class 1 integrons in vancomycin-resistant Enterococcus faecium in Indian hospitals. Indian J Med Microbiol. 2022;40(1):45-51.
  • 25.
    Ahn K, Hwang GY, Uh Y, Yoon KJ, Hyun S. Vancomycin Resistance due to vanA Gene Expression in an Aerococcus viridans Isolate: First Case in Korea. Ann Lab Med. 2017;37(3):288-9. [PubMed ID: 28224779]. [PubMed Central ID: PMC5339105]. https://doi.org/10.3343/alm.2017.37.3.288.
  • 26.
    Zhou X, Willems RJL, Friedrich AW, Rossen JWA, Bathoorn E. Enterococcus faecium: from microbiological insights to practical recommendations for infection control and diagnostics. Antimicrob Resist Infect Control. 2020;9(1):130. [PubMed ID: 32778149]. [PubMed Central ID: PMC7418317]. https://doi.org/10.1186/s13756-020-00770-1.
  • 27.
    Pinholt M, Bayliss SC, Gumpert H, Worning P, Jensen VVS, Pedersen M, et al. WGS of 1058 Enterococcus faecium from Copenhagen, Denmark, reveals rapid clonal expansion of vancomycin-resistant clone ST80 combined with widespread dissemination of a vanA-containing plasmid and acquisition of a heterogeneous accessory genome. J Antimicrob Chemother. 2019;74(7):1776-85. [PubMed ID: 30929020]. https://doi.org/10.1093/jac/dkz118.
  • 28.
    Mody L, Foxman B, Bradley S, McNamara S, Lansing B, Gibson K, et al. Longitudinal assessment of multidrug-resistant organisms in newly admitted nursing facility patients: implications for an evolving population. Clin Infect Dis. 2018;67(6):837-44.
  • 29.
    Sundermann AJ, Rangachar Srinivasa V, Mills EG, Griffith MP, Evans E, Chen J, et al. Genomic sequencing surveillance of patients colonized with vancomycin-resistant enterococci improves detection of healthcare-associated transmission. BMC Glob Public Health. 2025;3(1):69. [PubMed ID: 40804750]. [PubMed Central ID: PMC12351959]. https://doi.org/10.1186/s44263-025-00186-2.

Crossmark
Crossmark
Checking
Share on
Cited by
Metrics

Ordering Reprints

Articles are published under the Creative Commons license stated on each article. No permission or royalty fee is required for uses permitted by that license. CCC handles optional bulk and customized reprint orders. Any quotation covers production and delivery services only, not copyright permission. > Request Reprints from CCC 

Search Relations

Author(s):

Related Articles