
1. Background
Cerebral palsy (CP) is a common neurodevelopmental disorder caused by a nonprogressive disturbance of the developing fetal or infant brain (1, 2). Clinically, it manifests as persistent impairments in movement and posture, often accompanied by activity limitation. It is estimated that approximately 17 million individuals live with CP globally, with a reported prevalence of approximately 1.4 - 3.2 per 1000 children (1, 2). In China, the prevalence of CP among children aged 1 - 6 years is approximately 2.46 per 1000 children (3). Because CP is clinically heterogeneous, children may differ substantially in motor subtype, Gross Motor Function Classification System (GMFCS) level, feeding ability, gastrointestinal symptoms, epilepsy, and medication exposure, all of which may influence nutritional status and potentially gut microbiota composition (4-6).
Malnutrition is a frequent comorbidity in children with CP, with reported prevalence rates ranging from 30% to 70% (7-9). The burden of malnutrition is particularly high in low- and middle-income countries and varies by geographic region, socioeconomic conditions, and severity of motor impairment (8, 9). In China, more than 50% of children with CP have been reported to experience malnutrition (4). Multiple factors contribute to malnutrition in this population, including dysphagia, motor dysfunction, inadequate dietary intake, inappropriate feeding practices, gastrointestinal disorders, and socioeconomic disadvantage (10-12).
Dysphagia may lead to inadequate energy and nutrient intake because of impaired chewing and swallowing, whereas motor impairment may alter energy requirements and contribute to an imbalance between intake and expenditure (5, 10, 13). In addition, constipation, epilepsy, and antiepileptic drug use may further affect feeding tolerance, gastrointestinal motility, appetite, and nutritional management in children with CP (6, 10, 12). Malnutrition may impair growth, immune function, bone health, and musculoskeletal development and may negatively affect functional outcomes and quality of life (13-15). It may also increase the long-term burden on families and healthcare systems (8, 11). Addressing malnutrition is therefore a crucial component of the clinical and rehabilitative management of children with CP.
Nutritional screening and assessment form the foundation of malnutrition prevention and treatment in CP. Available approaches include pediatric nutritional risk-screening instruments, growth assessment, dietary evaluation, and clinical assessment of feeding and gastrointestinal problems (15, 16). However, no universally accepted malnutrition screening standard has been developed specifically for children with CP (15, 17, 18). Nutritional assessment typically includes a medical and feeding history, dietary assessment, anthropometric measurements, laboratory tests, and evaluation of functional and gastrointestinal factors (15-18). Key anthropometric indicators include body height, body weight, body mass index, triceps skinfold thickness, subscapular skinfold thickness, and mid-upper arm circumference or muscle circumference (19, 20). Because conventional weight and height measurements may be difficult to obtain in children with neurological impairment, complementary indicators such as mid-upper arm circumference may provide useful additional information (20). The World Health Organization growth standards and growth references are commonly used to identify underweight, wasting, stunting, and abnormal BMI-for-age in children and adolescents (21, 22).
The Global Leadership Initiative on Malnutrition criteria have also been evaluated as a standardized diagnostic framework in hospitalized clinical populations (23). However, these criteria have not been specifically validated in children with CP and should not replace age-appropriate pediatric growth references or neurological-disability-specific nutritional assessment. Current treatment approaches emphasize early nutritional screening, identification of underlying causes, caregiver education, management of feeding and gastrointestinal difficulties, individualized nutritional support, and enteral nutrition when clinically indicated (13, 16-18, 24). Nevertheless, some orally fed children with CP remain malnourished even in the absence of obvious feeding difficulties or gastrointestinal disease, suggesting that additional biological and environmental factors may be involved. In recent years, the gut microbiota has emerged as a potential factor associated with childhood nutritional disorders. Accumulating evidence indicates that childhood malnutrition is associated with altered microbial maturation, reduced microbial diversity, disruption of short-chain fatty acid-producing taxa, and changes in microbial metabolic functions (25, 26).
The gut microbiota may influence nutrient absorption and metabolism, intestinal-barrier integrity, immune regulation, and short-chain fatty acid production (26-28). However, the direction of this relationship remains uncertain: malnutrition may disrupt microbiota development, microbial alterations may contribute to impaired nutrient utilization, or both may arise from shared dietary, clinical, and environmental factors (25, 26). Studies involving children with neurological impairment or CP have also reported gut microbiota alterations associated with long-term enteral nutrition, epilepsy, constipation, and related clinical exposures (29-31). These findings are relevant because feeding route, dietary composition, gastrointestinal motility, epilepsy, and medication use may confound comparisons of gut microbiota between children with CP and healthy controls. Gut microbiota composition also continues to develop throughout childhood and may be influenced by age, diet, and body composition (32-35). Microbiota-directed nutritional interventions have produced promising biological effects in some undernourished pediatric populations, but these findings cannot be directly extrapolated to children with CP (36). Evidence specifically examining children with both CP and malnutrition therefore remains limited.
To address this gap, the present case–control study compared gut microbiota profiles between children with CP and comorbid malnutrition and age-matched healthy children using full-length 16S rRNA gene sequencing. We also explored associations between microbial diversity indices and nutritional indicators within the CP-malnutrition group. Because separate CP-without-malnutrition and malnutrition-without-CP groups were not included, this study was designed to identify associations rather than determine whether microbial alterations were attributable specifically to CP, malnutrition, or their combined effects.
2. Objectives
This study aimed to provide preliminary evidence to inform future longitudinal research that incorporates standardized dietary assessment, adjustment for clinical confounders, functional microbiome analysis, and appropriately designed intervention studies.
3. Methods
3.1. Study Design and Ethical Approval
This prospective case–control study was conducted between June 2022 and December 2024 in the Department of Rehabilitation, The Second Affiliated Hospital of Chengdu Medical College (China National Nuclear Corporation 416 Hospital), Chengdu, Sichuan Province, China. The study was designed to characterize gut microbiota alterations in children with cerebral palsy (CP) and comorbid malnutrition and to investigate associations between gut microbial diversity and nutritional status. All procedures involving human participants were conducted in accordance with the ethical standards of the institutional research committee and the principles of the Declaration of Helsinki and its later amendments. The study protocol was approved by the Ethics Committee of Nuclear Industry 416 Hospital (Approval No. KJ2022022). Written informed consent was obtained from the parents or legal guardians of all participants before enrollment.
3.2. Study Population
Children with CP and comorbid malnutrition who received outpatient rehabilitation between June 2022 and December 2024 were consecutively recruited as the observation group. CP was diagnosed according to the Chinese Guidelines for the Rehabilitation of Cerebral Palsy (2022) (3). Nutritional status was evaluated using the World Health Organization (WHO) Child Growth Standards for children aged 0 - 5 years and the WHO growth reference for school-aged children and adolescents aged 5 - 19 years (21, 22). Age-appropriate anthropometric indicators were used to characterize malnutrition. Stunting was defined as a height-for-age z-score (HAZ) < −2. Underweight was defined as a weight-for-age z-score (WAZ) < −2 when applicable. Wasting was defined as a weight-for-height z-score (WHZ) < −2 in children for whom WHZ was applicable, whereas thinness in older children and adolescents was defined as a BMI-for-age z-score (BMIZ) < −2. Participants meeting at least one applicable WHO criterion were classified as having malnutrition. The presence and overlap of underweight, stunting, wasting, and thinness were recorded according to age-specific criteria.
The inclusion criteria for the observation group were as follows: (1) a confirmed diagnosis of CP; (2) fulfillment of at least one applicable WHO criterion for malnutrition; (3) age between 3 and 18 years; (4) Gross Motor Function Classification System (GMFCS) levels I–III; and (5) oral feeding with a regular diet.
Children were excluded if they had: (1) antibiotic exposure within one month before fecal sample collection; (2) use of probiotics, prebiotics, or other microbial supplements within one month before enrollment; (3) gastrointestinal diseases that could independently influence gut microbiota composition; (4) severe cognitive impairment, severe developmental disorders, or major organic diseases; or (5) tube feeding or use of specialized enteral nutritional formulas.
During the same study period, 30 healthy children were recruited as the control group. Healthy controls had no history of CP, chronic gastrointestinal disease, chronic systemic disease, recent infection, antibiotic exposure, probiotic supplementation, or long-term medication use. Children receiving tube feeding or specialized enteral nutritional formulas were excluded because the feeding route and formula composition may influence gut microbiota composition. The control group was selected to provide an age distribution comparable to that of the CP-malnutrition group. Sex was not used as a matching variable but was compared between groups and considered in the exploratory adjusted analysis.
3.3. Data Collection
3.3.1. Clinical Characteristics
Clinical information was collected via medical-record review and caregiver interviews. Because gut microbiota composition may be influenced by neurological severity, gastrointestinal function, feeding ability, and medication exposure, clinically relevant variables were systematically recorded. CP subtype was classified as spastic, dyskinetic, ataxic, or mixed CP. Gross motor function was assessed using the GMFCS (37). Feeding-related characteristics, including oral feeding status, dysphagia or feeding difficulty, and constipation, were documented. Neurological comorbidities, including a history of epilepsy and antiepileptic drug use, were also recorded. These variables were considered potential confounders because they may influence nutritional status, gastrointestinal motility, dietary intake, medication exposure, and gut microbial composition. Age, sex, GMFCS level, dysphagia, constipation, and BMI were included in the exploratory multivariable regression analysis. CP subtype, epilepsy, and antiepileptic drug use were not included in the final regression model because the limited sample size and sparse distribution of some categories could have resulted in unstable estimates and model overfitting. Their potential residual confounding effects were considered when interpreting the findings.
3.3.2. Nutritional and Dietary Assessment
Anthropometric measurements were performed by two trained investigators between 08:00 and 10:00 AM. Body weight (BW), body height (BH), body mass index (BMI), head circumference (HC), mid-upper arm circumference (MUAC), triceps skinfold thickness (TSF), and subscapular skinfold thickness (SST) were assessed. Each measurement was performed three times, and the mean value was used for analysis. BMI was calculated as body weight in kilograms divided by height in meters squared. TSF and SST were measured using a calibrated skinfold caliper and recorded in millimeters. MUAC was measured in centimeters at the midpoint between the acromion and olecranon processes with the arm relaxed. Mid-upper arm muscle circumference (MUAMC) was calculated using the following formula: MUAMC (cm) = MUAC (cm) − [π × TSF (mm)/10]. Age- and sex-adjusted nutritional indicators were calculated using WHO Anthro software version 3.1.0 and WHO AnthroPlus software version 1.0.4 according to the WHO growth standards and references (21, 22). The calculated indicators included HAZ, BMIZ, WAZ, and WHZ, as applicable by age.
Dietary intake was considered an important potential determinant of gut microbiota composition; therefore, feeding-related information was collected through caregiver interviews. All enrolled children received regular oral diets. Information on usual dietary patterns, nutritional supplementation, feeding assistance, and consumption of major food groups was recorded when available. Because standardized quantitative dietary assessment tools, such as validated food frequency questionnaires, weighed food records, or repeated 24-hour dietary recalls, were not available for all participants, dietary intake could not be included as a quantitative covariate in the statistical analyses and was considered a potential source of residual confounding.
3.3.3. Fecal Sample Collection
Fresh fecal samples were collected before any study-related intervention. Approximately 3 g of fecal material was collected from each participant using sterile fecal DNA preservation tubes (JianShi Biotech, Beijing, China; model 196188). Samples were collected by trained personnel before 09:00 AM, transported under low-temperature conditions, and stored at −80 °C until DNA extraction to minimize microbial DNA degradation.
3.4. Gut Microbiota Sequencing
Microbial DNA was extracted from fecal samples using the PowerSoil® DNA Isolation Kit according to the manufacturer’s instructions. The nearly full-length bacterial 16S rRNA gene was amplified using the universal forward primer 27F (5′-AGAGTTTGATCMTGGCTCAG-3′) and reverse primer 1492R (5′-TACGGYTACCTTGTTACGACTT-3′). PCR amplification, sequencing library construction, and sequencing were performed by Biomarker Technologies (Beijing, China). Full-length 16S rRNA gene sequencing was conducted using the Pacific Biosciences (PacBio) Sequel II platform based on circular consensus sequencing (CCS) technology. CCS reads were generated using SMRT Link software version 8.0. Samples were demultiplexed according to barcode sequences using Lima software version 1.7.0. Chimeric sequences were identified and removed using UCHIME version 8.1 (38), and high-quality nonchimeric sequences were retained for downstream microbiome analysis. Sequencing depth and completeness were evaluated using retained high-quality read counts, rarefaction curves, and Good’s coverage.
3.5. Bioinformatics Analysis
High-quality sequences were clustered into operational taxonomic units (OTUs) at 97% sequence similarity using USEARCH version 10.0 (39). OTUs representing less than 0.005% of the total sequences were removed. Although amplicon sequence variant (ASV)-based approaches may provide greater sequence-level resolution and reproducibility in some marker-gene studies (40), OTU clustering was retained because the full-length 16S rRNA gene sequencing workflow used in the present study was established using an OTU-based analytical pipeline. Taxonomic classification was performed using the Mothur pipeline against the SILVA ribosomal RNA reference database, release 138, with the Ribosomal Database Project classifier using a minimum bootstrap confidence threshold of 80% (41, 42). Alpha- and beta-diversity analyses were performed using QIIME 2 version 2020.6 (43). To reduce the influence of unequal sequencing depth among samples, the OTU table was rarefied to 4,000 high-quality sequences per sample before diversity analysis. All 60 samples were retained after rarefaction.
Alpha diversity was evaluated using the Chao richness index, ACE richness index, Shannon diversity index, Simpson diversity index, and PD_whole_tree index. Rarefaction curves were generated to evaluate sequencing completeness, and Good’s coverage was calculated as an additional measure of sampling adequacy. Beta diversity was evaluated using Bray–Curtis dissimilarity matrices, and principal coordinate analysis (PCoA) was performed to visualize differences in microbial community structure between groups. Differences in overall microbial community composition were evaluated using permutational multivariate analysis of variance (PERMANOVA) based on Bray–Curtis dissimilarities with 999 permutations (44). The pseudo-F statistic, proportion of explained variation (R2), and permutation-derived P value were reported. Differentially represented taxa were identified using Linear Discriminant Analysis Effect Size (LEfSe) (45). LEfSe analysis consisted of a Kruskal–Wallis test followed by linear discriminant analysis (LDA). Taxa with an LDA score > 4.0 and P < 0.05 were considered differentially represented between groups. Predictive functional analysis, including PICRUSt2 analysis, was not performed. Accordingly, functional interpretations of taxonomic differences were considered exploratory and indirect.
3.6. Statistical Analysis
Statistical analyses were performed using SPSS version 26.0. Continuous variables were assessed for normality using the Shapiro–Wilk test. Normally distributed variables were expressed as mean ± standard deviation and compared between groups using independent-samples t-tests. Non-normally distributed variables were summarized using the median and interquartile range and compared using Mann–Whitney U tests. Categorical variables were compared using χ2 tests or Fisher’s exact tests, as appropriate. Associations between alpha-diversity indices and nutritional indicators were evaluated using Pearson or Spearman correlation coefficients according to data distribution. Because these correlation analyses were exploratory and involved multiple comparisons, no formal correction for multiple testing was applied. The reported P values were therefore considered nominal and interpreted cautiously. To evaluate clinical and nutritional factors associated with microbial richness, an exploratory multivariable linear regression analysis was performed among children with CP and malnutrition. The Chao index was used as the dependent variable, and age, sex, GMFCS level, dysphagia, constipation, and BMI were entered as independent variables because of their potential influence on gut microbiota composition and nutritional status.
Sex was coded as 0 = female and 1 = male. Dysphagia and constipation were coded as 0 = absent and 1 = present. GMFCS level was entered as an ordinal variable coded as I = 1, II = 2, and III = 3. Regression assumptions were assessed using standardized residuals, normal probability plots, and plots of residuals against predicted values. Multicollinearity was assessed using variance inflation factors. Regression coefficients, standard errors, standardized β coefficients, t statistics, and P values were reported. Because six predictors were evaluated in only 30 participants, the regression analysis was considered exploratory and potentially susceptible to model instability and overfitting. CP subtype, epilepsy, and antiepileptic drug use were not included because of sparse category frequencies and the limited sample size. No formal sample-size or statistical-power calculation was performed before recruitment because the study was designed as an exploratory prospective case–control microbiome study. The sample size was determined by the number of eligible participants available during the recruitment period. Accordingly, the statistical analyses were considered hypothesis-generating rather than confirmatory. Because microbiome abundance data are compositional, taxonomic differences were interpreted as relative proportional differences rather than absolute changes in bacterial quantity (46). All statistical tests were two-sided, and P < 0.05 was considered statistically significant.
4. Results
4.1. Baseline and Clinical Characteristics of Participants
A total of 60 children were included in the study, comprising 30 children with cerebral palsy (CP) and comorbid malnutrition (observation group) and 30 age-comparable healthy children (control group). Baseline demographic and anthropometric characteristics are presented in Table 1. No significant difference was observed between the groups in sex distribution (χ2 = 1.086, P = 0.297). The mean age was 8.03 ± 3.82 years in the CP-malnutrition group and 7.83 ± 3.29 years in the control group, with no significant between-group difference (t = 0.217, P = 0.829). Compared with healthy controls, children with CP and malnutrition had significantly lower height (114.69 ± 20.32 cm vs. 126.90 ± 20.78 cm, P = 0.025), weight (21.95 ± 9.63 kg vs. 30.16 ± 12.58 kg, P = 0.006), and BMI (16.15 ± 2.47 kg/m2 vs. 17.94 ± 1.84 kg/m2, P = 0.006). Anthropometric indicators of peripheral fat and muscle stores were also lower in the CP-malnutrition group, including subscapular skinfold thickness (SST; 9.16 ± 2.51 mm vs. 11.27 ± 3.16 mm, P = 0.006), triceps skinfold thickness (TSF; 10.08 ± 3.26 mm vs. 13.33 ± 3.84 mm, P = 0.002), and mid-upper arm muscle circumference (MUAMC; 17.99 ± 2.52 cm vs. 19.31 ± 2.36 cm, P = 0.040).
Table 1.
Baseline Characteristics of the Two Groups a
| Variables | Observation Group (n = 30) | Control Group (n = 30) | t/Z/χ2 | P Value |
|---|---|---|---|---|
| Gender | 1.086 | 0.297 | ||
| Male | 19 (63.3) | 15 (50.0) | ||
| Female | 11 (36.7) | 15 (50.0) | ||
| Age (y) | 8.03 ± 3.82 | 7.83 ± 3.29 | 0.217 | 0.829 |
| Height (cm) | 114.69 ± 20.32 | 126.90 ± 20.78 | −2.301 | 0.025 |
| Weight (kg) | 21.95 ± 9.63 | 30.16 ± 12.58 | −2.750 | 0.006 |
| BMI (kg/m2) | 16.15 ± 2.47 | 17.94 ± 1.84 | −2.759 | 0.006 |
| Head circumference (HC, cm) | 50.91 ± 2.48 | 51.31 ± 1.80 | −0.422 | 0.673 |
| SST (mm) | 9.16 ± 2.51 | 11.27 ± 3.16 | −2.855 | 0.006 |
| TSF (mm) | 10.08 ± 3.26 | 13.33 ± 3.84 | −3.065 | 0.002 |
| MUAMC (cm) | 17.99 ± 2.52 | 19.31 ± 2.36 | −2.100 | 0.040 |
| HAZ | −2.09 ± 0.65 | −0.20 ± 0.95 | −5.737 | < 0.001 |
| BMIZ | −0.31 ± 1.40 | 0.95 ± 0.61 | −4.509 | < 0.001 |
a Abbreviations: BMI, body mass index; HC, head circumference; SST, subscapular skinfold thickness; TSF, tricep skinfold thickness; MUAMC, mid-upper arm muscle circumference; HAZ, height-for-age z-score; BMIZ, BMI-for-age z-score.
Nutritional z-score indicators were also lower in children with CP and malnutrition. HAZ was −2.09 ± 0.65 in the observation group compared with −0.20 ± 0.95 in controls (P < 0.001), whereas BMIZ was −0.31 ± 1.40 and 0.95 ± 0.61, respectively (P < 0.001). Clinical characteristics of children with CP are summarized in Table 2. Spastic CP was the predominant subtype, occurring in 22 children (73.3%), followed by dyskinetic CP in 3 (10.0%), mixed CP in 3 (10.0%), and ataxic CP in 2 (6.7%). According to the GMFCS, 8 children (26.7%) were classified as level I, 12 (40.0%) as level II, and 10 (33.3%) as level III. Dysphagia or feeding difficulty was documented in 5 children (16.7%), constipation in 7 (23.3%), a history of epilepsy in 8 (26.7%), and antiepileptic drug use in 6 (20.0%). All children in the CP-malnutrition group received oral feeding. According to the applicable WHO age-specific nutritional criteria, underweight was present in 18 children (60.0%), stunting in 15 (50.0%), and a wasting/thinness phenotype based on the applicable WHZ or BMIZ criterion in 10 (33.3%). These categories were not mutually exclusive, and several children met more than one criterion for malnutrition.
Table 2.
Clinical Characteristics of Children with Cerebral Palsy a
| Variables | Observation Group, n = 30 | Control Group, n = 30 |
|---|---|---|
| CP subtype | Not applicable | |
| Spastic CP | 22 (73.3) | Not applicable |
| Dyskinetic CP | 3 (10.0) | Not applicable |
| Ataxic CP | 2 (6.7) | Not applicable |
| Mixed CP | 3 (10.0) | Not applicable |
| GMFCS level | Not applicable | |
| GMFCS I | 8 (26.7) | Not applicable |
| GMFCS II | 12 (40.0) | Not applicable |
| GMFCS III | 10 (33.3) | Not applicable |
| Dysphagia / feeding difficulty | 5 (16.7) | 0 (0.0) |
| Constipation | 7 (23.3) | 0 (0.0) |
| History of epilepsy | 8 (26.7) | 0 (0.0) |
| Antiepileptic drug use | 6 (20.0) | 0 (0.0) |
| Feeding route: oral feeding | 30 (100.0) | 30 (100.0) |
a Abbreviations: CP, cerebral palsy; GMFCS, Gross Motor Function Classification System.
4.2. Sequencing Quality and Observed OTUs
Sequencing quality metrics and observed operational taxonomic unit (OTU) counts are summarized in Table 3. The mean number of retained high-quality sequencing reads was 6344.43 ± 2036.46 in the CP-malnutrition group and 10,991.63 ± 1209.98 in the control group. To reduce the influence of unequal sequencing depth, the OTU table was rarefied to 4,000 high-quality sequences per sample before alpha- and beta-diversity analyses. All 60 samples were retained after rarefaction. Rarefaction curves approached asymptotic plateaus across samples, indicating that the standardized sequencing depth captured most of the detectable bacterial diversity. Mean Good’s coverage was 99.52% ± 0.21% in the CP-malnutrition group and 99.68% ± 0.18% in the control group, with no significant between-group difference (P > 0.05). After standardized sequence processing, the CP-malnutrition group had significantly fewer observed OTUs than the control group (60.07 ± 19.59 vs. 167.10 ± 36.17; t = −14.251, P < 0.001), indicating substantially lower observed microbial richness.
Table 3.
Comparison of OTU Counts and High-Quality Read Counts Between the Two Groups a
| Groups | OTUs | Sequences |
|---|---|---|
| Control group | 167.10 ± 36.17 | 10,991.63 ± 1209.98 |
| Observation group | 60.07 ± 19.59 b | 6344.43 ± 2036.46 b |
| t-value | −14.251 | −10.745 |
| P value | < 0.001 | < 0.001 |
a Abbreviations: OTU, operational taxonomic unit; Sequences, number of corresponding reads
b P < 0.05 indicates a significant difference compared to the control group.
4.3. Comparison of Alpha-Diversity Indices Between Groups
Gut microbiota alpha-diversity indices are presented in Table 4 and Figure 1. Children with CP and malnutrition showed significantly lower microbial richness and diversity than healthy controls. The Chao richness index was significantly lower in the CP-malnutrition group than in the control group (85.30 ± 32.61 vs. 209.12 ± 44.26; t = −12.337, P < 0.001). Similarly, the ACE richness index was lower in children with CP and malnutrition (89.20 ± 32.00 vs. 208.01 ± 44.61; t = −11.852, P < 0.001). Measures incorporating both richness and evenness showed the same overall pattern. The Shannon index was lower in the CP-malnutrition group than in controls (2.89 ± 0.86 vs. 4.52 ± 0.74; t = −7.821, P < 0.001), as was the Simpson index (0.73 ± 0.17 vs. 0.88 ± 0.09; t = −4.657, P < 0.001). Phylogenetic diversity was also lower, with a PD_whole_tree index of 6.44 ± 1.44 in the CP-malnutrition group compared with 13.37 ± 2.51 in controls (t = −13.120, P < 0.001). Collectively, these findings indicate lower observed richness, taxonomic diversity, and phylogenetic diversity in children with CP and malnutrition.
Table 4.
Comparison of Alpha-Diversity Indices of the Gut Microbiota Between the Two Groups a
| Groups | N | Chao | ACE | Shannon | Simpson | PD_whole_tree |
|---|---|---|---|---|---|---|
| Control group | 30 | 209.12 ± 44.26 | 208.01 ± 44.61 | 4.52 ± 0.74 | 0.88 ± 0.09 | 13.37 ± 2.51 |
| Observation group | 30 | 85.30 ± 32.61 b | 89.20 ± 32.00 b | 2.89 ± 0.86 b | 0.73 ± 0.17 b | 6.44 ± 1.44 b |
| t/Z-value | - | −12.337 | −11.852 | −7.821 | −4.657 | −13.120 |
| P value | - | < 0.001 | < 0.001 | < 0.001 | < 0.001 | < 0.001 |
a Values are expressed as mean ± SD.
b P < 0.05 indicates a significant difference compared with the control group.
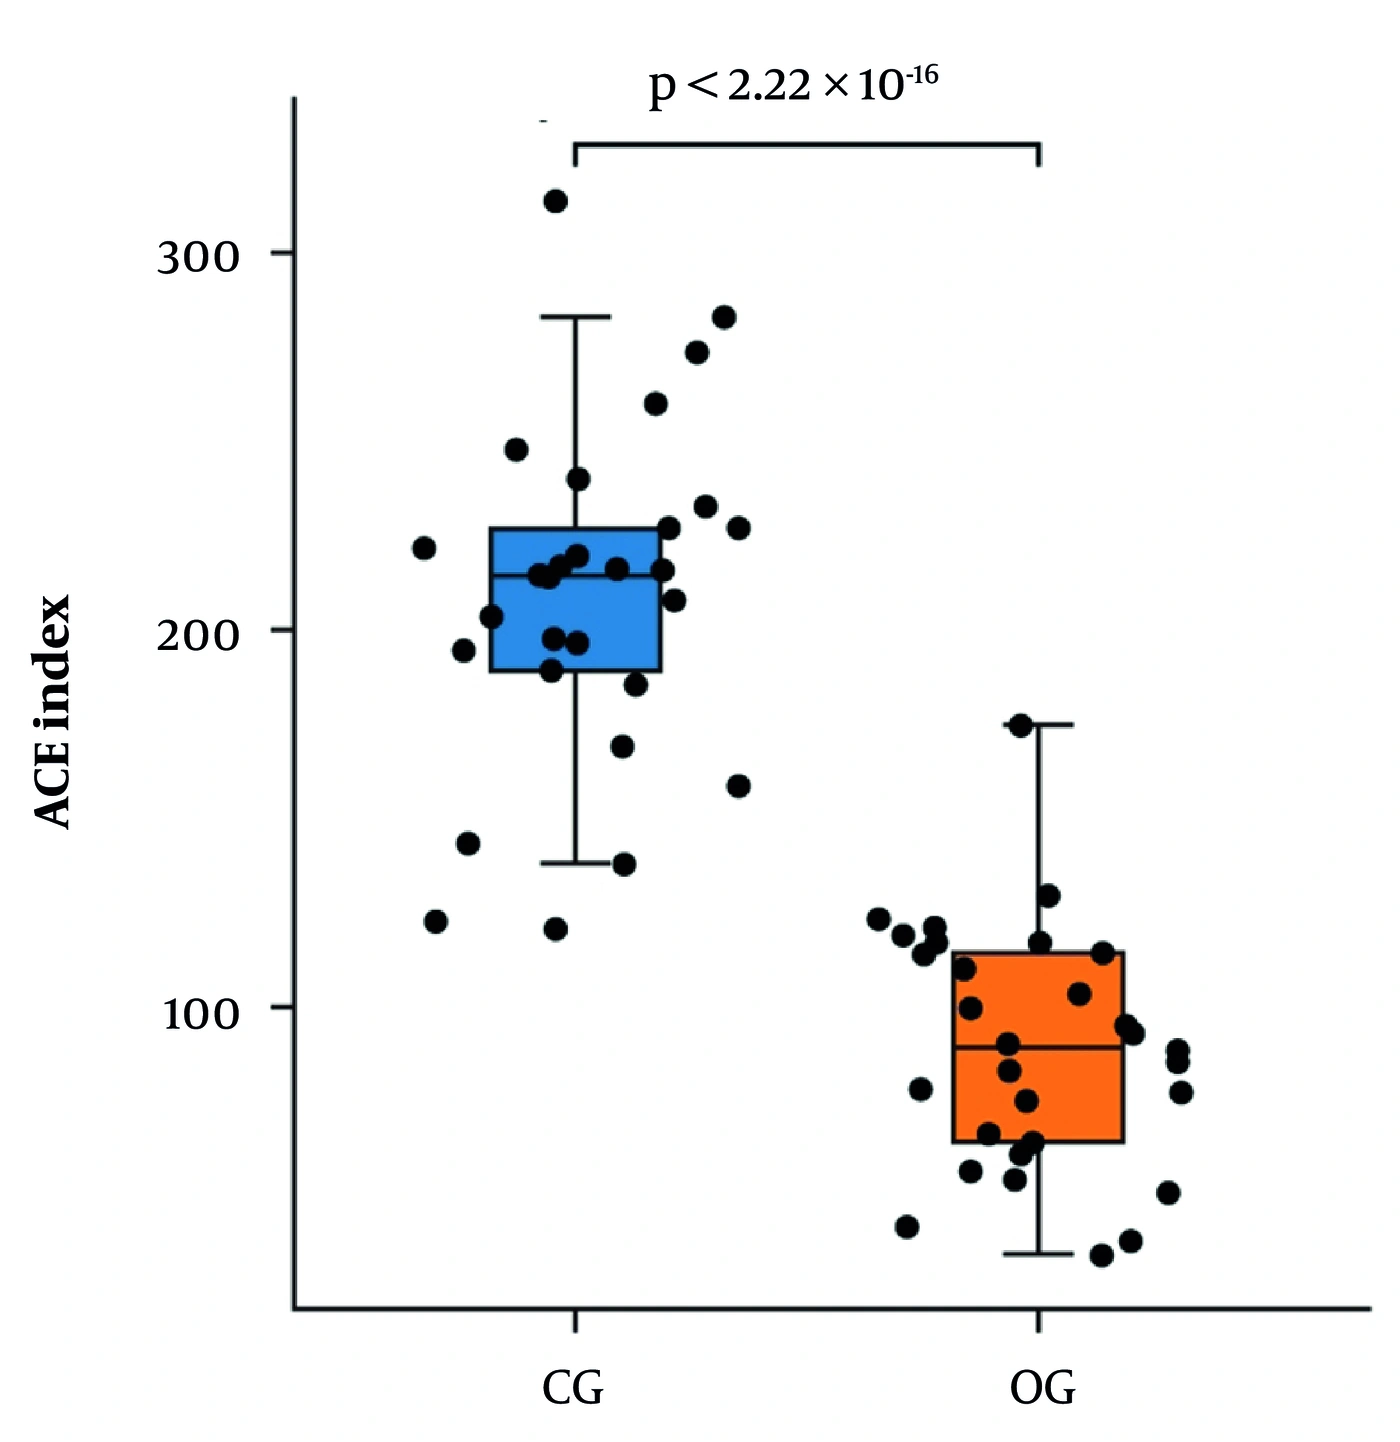
Figure 1.
Box plot showing intergroup differences in ACE index of α-diversity. Abbreviations: OG, observation group; CG, control group.
4.4. Comparison of Beta Diversity Between Groups
Differences in overall gut microbial community composition were evaluated using Bray–Curtis dissimilarity. Principal coordinate analysis (PCoA) demonstrated partial separation of samples from the CP-malnutrition and control groups (Figure 2). The first two principal coordinates explained 28.42% of the total variation, with PC1 accounting for 18.08% and PC2 accounting for 10.34%. PERMANOVA based on Bray–Curtis dissimilarity demonstrated a statistically significant group-level difference in microbial community composition (pseudo-F = 3.46, R2 = 0.056, P = 0.001). Group status therefore accounted for approximately 5.6% of the observed variation in community composition, indicating a statistically significant but modest effect size.
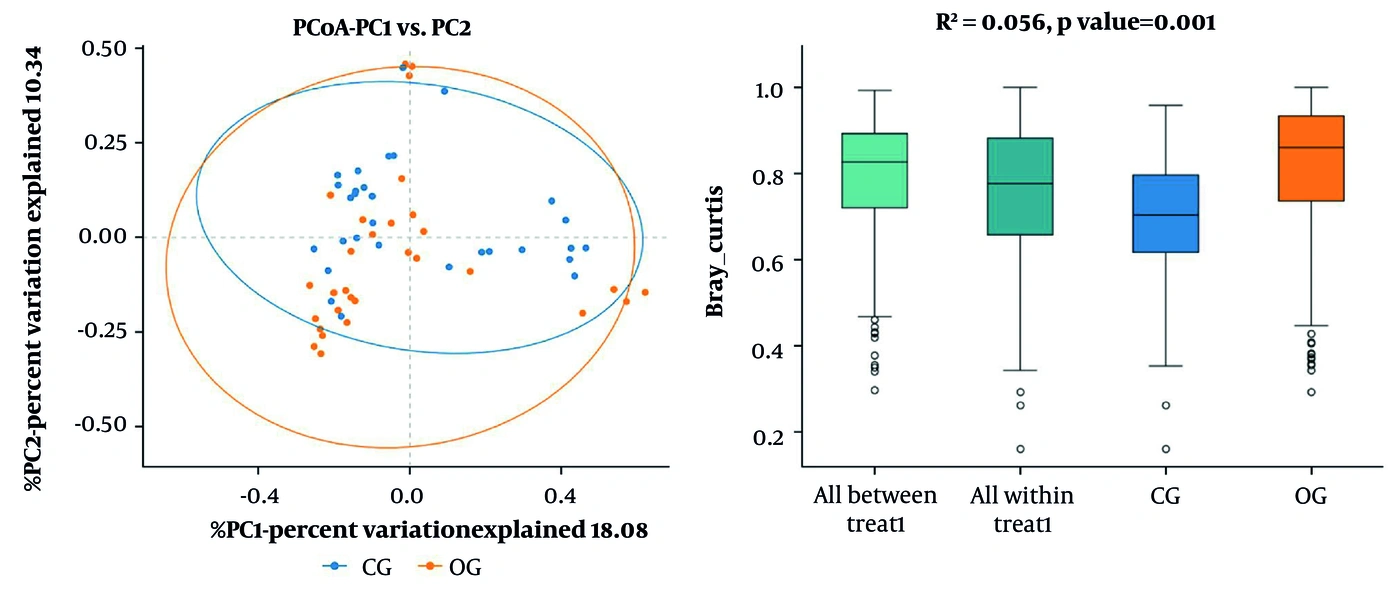
Figure 2.
Principal coordinate analysis based on Bray–Curtis distances showing differences in gut microbial community composition between the two groups. Group differences were evaluated using PERMANOVA with 999 permutations (pseudo-F = 3.46, R2 = 0.056, P = 0.001).
4.5. Differential Taxonomic Abundance Between Groups
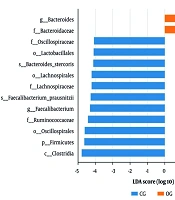
LEfSe analysis identified bacterial taxa that were differentially represented between the CP-malnutrition and control groups (Figure 3). At the family level, Bacteroidaceae showed greater relative representation in children with CP and malnutrition, whereas Ruminococcaceae, Helicobacteraceae, and Lachnospiraceae were relatively enriched in healthy controls. At the genus level, Bacteroides showed greater relative abundance in the CP-malnutrition group, whereas Faecalibacterium and Parabacteroides were more highly represented in the control group. The Firmicutes/Bacteroidetes ratio was lower in children with CP and malnutrition than in healthy controls (0.71 vs. 1.02). Because these analyses were based on relative abundance data, the observed differences reflect proportional shifts in microbial community composition rather than differences in absolute bacterial quantity.
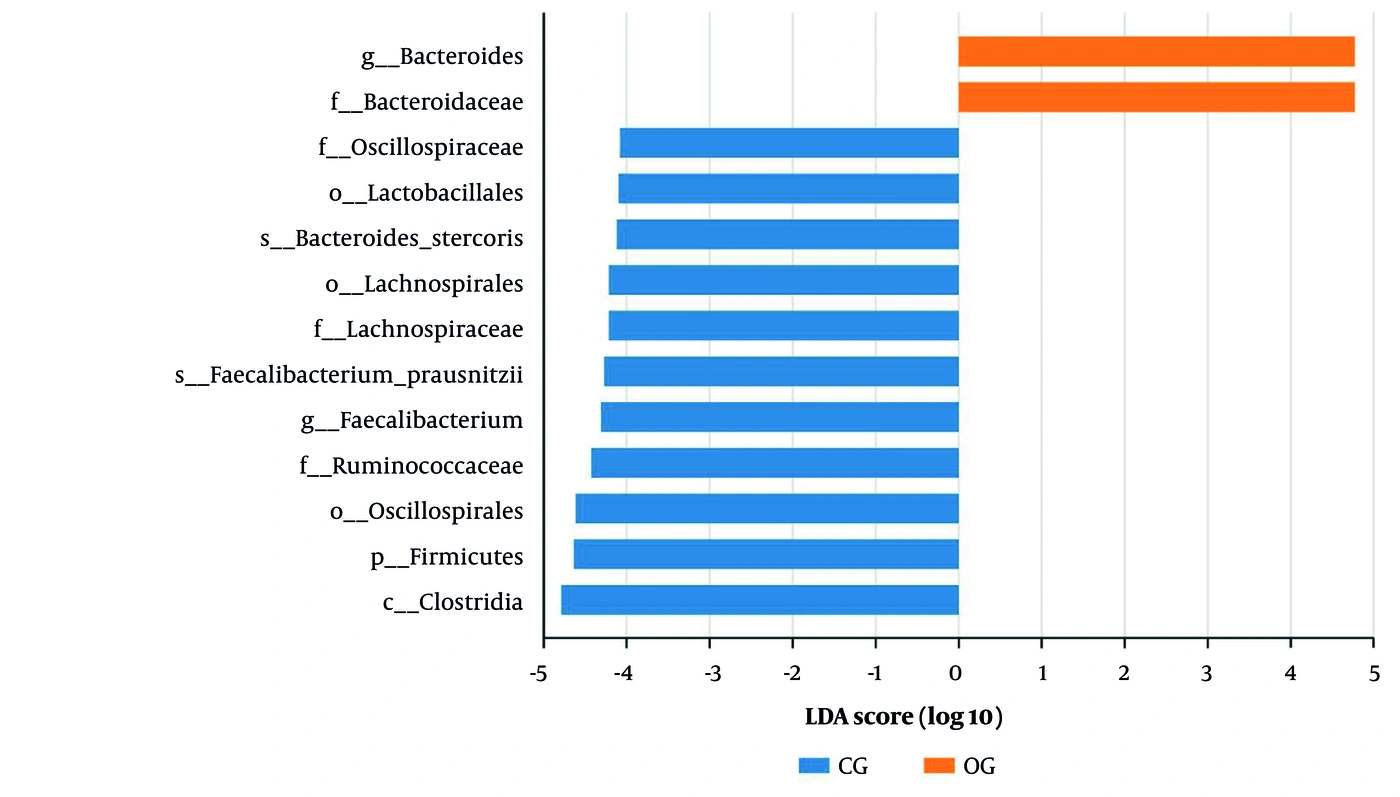
Figure 3.
Bar chart of LDA value distribution indicating key taxa enriched in each group.
4.6. Correlations Between Gut Microbiota Diversity and Nutritional Indicators in Children With CP and Malnutrition
Associations between gut microbiota alpha-diversity indices and nutritional parameters within the CP-malnutrition group are presented in Table 5. The Chao index showed nominal positive correlations with SST (r = 0.476, P = 0.008), MUAMC (r = 0.468, P = 0.009), and BMI (r = 0.407, P = 0.026). The ACE index showed a nominal positive correlation with SST (r = 0.445, P = 0.014). The Shannon index showed a nominal positive correlation with BMI (r = 0.383, P = 0.037), whereas the Simpson index showed a nominal positive correlation with BMIZ (r = 0.427, P = 0.018). The PD_whole_tree index showed nominal positive correlations with SST (r = 0.549, P = 0.002), MUAMC (r = 0.439, P = 0.015), and BMI (r = 0.415, P = 0.022). No nominal associations were observed between the alpha-diversity indices and HAZ (all P > 0.05). Because multiple exploratory correlations were examined without formal correction for multiple testing, the reported P values are nominal and should be interpreted cautiously.
Table 5.
Correlations Between Alpha-Diversity Indices and Nutritional Indicators
| Index | SST (r/p) | TSF (r/p) | MUAMC (r/p) | BMI (r/p) | BMIZ (r/p) | HAZ (r/p) |
|---|---|---|---|---|---|---|
| Chao | 0.476/0.008 | 0.343/0.063 | 0.468/0.009 | 0.407/0.026 | 0.127/0.502 | 0.111/0.557 |
| ACE | 0.445/0.014 | 0.234/0.213 | 0.328/0.077 | 0.192/0.309 | 0.063/0.741 | 0.122/0.520 |
| Shannon | −0.007/0.970 | −0.068/0.721 | 0.237/0.208 | 0.383/0.037 | 0.341/0.065 | −0.129/0.498 |
| Simpson | −0.079/0.678 | −0.067/0.724 | 0.207/0.273 | 0.335/0.070 | 0.427/0.018 | −0.043/0.824 |
| PD_whole_tree | 0.549/0.002 | 0.302/0.105 | 0.439/0.015 | 0.415/0.022 | 0.113/0.554 | 0.142/0.455 |
4.7. Exploratory Multivariable Linear Regression Analysis of Factors Associated with Gut Microbiota Richness
An exploratory multivariable linear regression analysis was performed among the 30 children with CP and malnutrition, using the Chao richness index as the dependent variable. Age, sex, GMFCS level, dysphagia, constipation, and BMI were entered simultaneously as independent variables. GMFCS level was entered as an ordinal variable, with levels I, II, and III coded as 1, 2, and 3, respectively. Sex was coded as 0 = female and 1 = male, whereas dysphagia and constipation were coded as 0 = absent and 1 = present. As shown in Table 6, higher GMFCS level was negatively associated with Chao richness in the exploratory adjusted model (unstandardized β = −12.40, SE = 5.01, standardized β = −0.39, t = −2.48, P = 0.021). Thus, each one-level increase in GMFCS was associated with an estimated 12.40-unit decrease in the Chao index after adjustment for the other variables included in the model. BMI was positively associated with Chao richness (unstandardized β = 6.15, SE = 2.45, standardized β = 0.47, t = 2.51, P = 0.019). Each 1-kg/m2 increase in BMI was associated with an estimated 6.15-unit increase in the Chao index after adjustment for the other variables included in the model.
Table 6.
Multivariable Linear Regression Analysis of Factors Associated with Gut Microbiota Richness (Chao Index) in Children with Cerebral Palsy and Malnutrition
| Variables | β coefficient | SE | Standardized β | t | P Value |
|---|---|---|---|---|---|
| Age | −1.24 | 1.05 | −0.14 | −1.18 | 0.250 |
| Male sex | 5.83 | 8.72 | 0.11 | 0.67 | 0.510 |
| GMFCS level | −12.40 | 5.01 | −0.39 | −2.48 | 0.021 |
| Dysphagia | −18.20 | 9.02 | −0.31 | −2.02 | 0.055 |
| Constipation | −9.35 | 7.20 | −0.22 | −1.30 | 0.206 |
| BMI | 6.15 | 2.45 | 0.47 | 2.51 | 0.019 |
Age was not statistically associated with Chao richness (β = −1.24, SE = 1.05, standardized β = −0.14, t = −1.18, P = 0.250). Similarly, sex (β = 5.83, SE = 8.72, standardized β = 0.11, t = 0.67, P = 0.510), dysphagia (β = −18.20, SE = 9.02, standardized β = −0.31, t = −2.02, P = 0.055), and constipation (β = −9.35, SE = 7.20, standardized β = −0.22, t = −1.30, P = 0.206) were not statistically associated with Chao richness at the conventional P < 0.05 threshold. Overall, the exploratory adjusted analysis indicated associations of GMFCS level and BMI with Chao richness. However, because six predictors were included in a model with only 30 participants, the estimates were interpreted as exploratory rather than confirmatory.
5. Discussion
The present study found that children with cerebral palsy (CP) and comorbid malnutrition had lower gut microbial richness and diversity than age-matched healthy children. Significant differences were observed in the Chao, ACE, Shannon, Simpson, and PD_whole_tree indices. Beta-diversity analysis also indicated differences in overall microbial community composition between the groups. At the family level, Bacteroidaceae showed higher relative abundance in the CP-malnutrition group, whereas Ruminococcaceae, Helicobacteraceae, and Lachnospiraceae were relatively enriched in healthy controls. At the genus level, Bacteroides was relatively enriched in children with CP and malnutrition, whereas Faecalibacterium and Parabacteroides were more abundant in healthy controls. The Firmicutes/Bacteroidetes ratio was also lower in the CP-malnutrition group. However, the PERMANOVA effect size was modest (R2 = 0.056), indicating that group status explained approximately 5.6% of the variation in microbial community composition. The statistically significant PERMANOVA result should therefore be interpreted as evidence of a group-level difference with limited explained variation rather than complete separation of the two microbial communities.
Correlation analysis showed that SST and MUAMC were positively associated with the Chao and PD_whole_tree indices, whereas BMI was positively correlated with the Chao, Shannon, and PD_whole_tree indices. The Simpson index was positively correlated with BMIZ. These associations suggest that microbial richness and diversity may vary with anthropometric nutritional indicators; however, they do not establish that reduced microbial diversity causes poorer nutritional status. Moreover, because multiple exploratory correlations were examined, individual nominal P values should be interpreted cautiously, particularly in the absence of adjustment for multiple testing. Gut microbiota composition develops substantially throughout childhood. Early-life microbial communities gradually acquire greater diversity and functional capacity, but microbial maturation may continue beyond early childhood into later childhood or adolescence (32-35). Healthy pediatric microbiota commonly include taxa such as Bifidobacterium, Faecalibacterium, Ruminococcaceae, and Lachnospiraceae, although their relative abundance varies according to age, diet, geography, medication exposure, and other environmental factors (32-35). In the present study, healthy controls showed relative enrichment of Faecalibacterium, Ruminococcaceae, and Lachnospiraceae, broadly consistent with previous descriptions of the gut microbiota in healthy children (32-35).
Studies of childhood malnutrition have reported delayed microbial maturation, reduced microbial diversity, and altered abundance of taxa involved in carbohydrate fermentation and short-chain fatty acid metabolism (25, 26, 28, 32, 33, 36). These microbial patterns are not entirely consistent across studies, which may reflect differences in age, geographic setting, diet, malnutrition phenotype, infection burden, and sequencing methods. Nevertheless, reduced representation of potentially beneficial taxa, including Faecalibacterium, Ruminococcaceae, and Lachnospiraceae, has been reported in several undernourished pediatric populations (25, 26, 28, 32, 33). The lower microbial richness and relative depletion of these taxa observed in our CP-malnutrition group are therefore broadly consistent with previous malnutrition research, although direct comparisons are limited because most earlier studies did not include children with CP.
Evidence regarding the gut microbiota in children with CP remains limited. Studies involving children with neurological impairment have reported microbial alterations related to enteral feeding, constipation, epilepsy, medication exposure, and clinical severity (29-31). Panelli et al. described dysbiosis among children with neurological impairment receiving long-term enteral nutrition (29), whereas Huang et al. reported gastrointestinal and oral microbial alterations in children with CP and epilepsy (30). Another study examined dietary fiber and probiotic treatment for functional constipation in children with CP and reported microbiota-related changes in that specific clinical context (31). These studies support the possibility that neurological impairment and associated clinical factors are related to microbial variation; however, their populations differ from ours in feeding route, epilepsy status, constipation, medication use, and treatment exposure. Therefore, they cannot be regarded as direct confirmation that the microbial differences observed in our study were attributable specifically to malnutrition in CP.
The lower Firmicutes/Bacteroidetes ratio observed in the CP-malnutrition group should also be interpreted cautiously. Firmicutes and Bacteroidetes are major bacterial phyla involved in carbohydrate metabolism, short-chain fatty acid production, intestinal homeostasis, and interactions with host energy metabolism (27, 28, 35). However, the Firmicutes/Bacteroidetes ratio varies with age, diet, body composition, geographic setting, and analytical method, and no validated diagnostic reference range exists for childhood malnutrition (32-35). Accordingly, the ratio in the present study should be considered a descriptive feature of relative community composition rather than an independent biomarker of malnutrition or CP. Clinical heterogeneity is an important consideration when interpreting the findings. CP subtype, GMFCS level, dysphagia, constipation, epilepsy, antiepileptic drug use, feeding dependence, and dietary intake may influence nutritional status and microbial composition (4-15, 19-22, 29-31). The exploratory multivariable analysis indicated that higher GMFCS level was negatively associated with Chao richness, whereas BMI was positively associated with Chao richness after adjustment for age, sex, dysphagia, and constipation. These results suggest that motor impairment and nutritional status may contribute independently to microbial richness. Nevertheless, the model included six predictors in only 30 children and is therefore susceptible to overfitting and unstable coefficient estimates. The findings should be considered exploratory rather than confirmatory.
CP subtype, epilepsy, and antiepileptic drug use were not included in the final regression model because the small numbers within individual categories would have further reduced model stability. Residual confounding by these variables therefore cannot be excluded. The absence of statistically significant adjusted associations for age, sex, dysphagia, and constipation should also not be interpreted as evidence that these variables have no influence, because the study may have lacked sufficient statistical power to detect moderate effects. Diet is another major determinant of gut microbiota composition. Previous studies have linked dietary diversity, fiber intake, feeding patterns, and nutritional supplementation with both nutritional status and microbial composition in children (12, 22, 25, 26, 31, 35). Although all participants in the present study received oral diets and children using specialized enteral formulas were excluded, a standardized quantitative dietary assessment was not available. Caregiver-reported dietary information could not be incorporated as a quantitative covariate, and residual confounding by habitual diet, fiber consumption, energy intake, and dietary diversity remains possible. Future studies should use repeated 24-hour dietary recalls, weighed dietary records, or validated food-frequency instruments to characterize dietary exposure more reliably.
Another important consideration is that the taxonomic analyses were based on relative abundance data. Microbiome data are compositional, meaning that an apparent proportional increase in one taxon may result from a reduction in another taxon rather than an actual increase in bacterial quantity (46). Therefore, the relative enrichment of Bacteroidaceae and Bacteroides should not be interpreted as evidence of increased absolute bacterial load. Future studies should combine sequencing with quantitative PCR, flow cytometry, total bacterial load assessment, or internal spike-in standards to distinguish relative compositional differences from absolute abundance changes. The study also did not include predictive functional analysis or direct metabolite measurement. Bacteroides, Faecalibacterium, Ruminococcaceae, and Lachnospiraceae may participate in polysaccharide degradation, short-chain fatty acid production, intestinal barrier regulation, and host energy metabolism (25-28, 35). Nevertheless, taxonomic data alone cannot establish these functional consequences. Because PICRUSt2, shotgun metagenomics, fecal short-chain fatty acid measurement, inflammatory profiling, and metabolomic analyses were not performed, any proposed biological mechanisms remain speculative. Future studies integrating taxonomic, functional, metabolic, and inflammatory data are needed to clarify the pathways linking microbial variation with nutritional status in children with CP.
Current evidence supports early nutritional screening, individualized dietary management, treatment of feeding and gastrointestinal difficulties, caregiver education, and multidisciplinary nutritional support for children with CP (13, 16-18, 20-24). Microbiota-directed dietary approaches have shown promising biological effects in some undernourished pediatric populations (31, 36), but these findings cannot be directly extrapolated to children with CP and malnutrition. A recent pilot clinical trial evaluated pancreatic enzyme replacement in children with malnutrition (47). This study provides broader context regarding emerging pediatric malnutrition interventions; however, it was not conducted specifically in children with CP and did not evaluate gut microbiota outcomes. Therefore, it does not provide direct evidence supporting pancreatic enzyme replacement for CP-associated malnutrition. Similarly, botulinum toxin type A has been investigated for improving lower-limb muscle function in children with spastic CP (48). This treatment is relevant to the broader multidisciplinary rehabilitation of selected children with CP, but it does not directly address malnutrition or gut microbiota composition. Any potential indirect relationship between improved motor function, feeding ability, energy expenditure, and nutritional outcomes would require separate investigation.
This study has several limitations. First, only children with CP and malnutrition and healthy controls were included; separate CP-without-malnutrition and malnutrition-without-CP groups were not available. Consequently, the observed microbial differences cannot be attributed specifically to CP, malnutrition, or their combined effects. Second, although antibiotic use, probiotic use, feeding route, and major clinical characteristics were considered, standardized quantitative dietary information was unavailable, and residual dietary confounding remains possible. Third, the study included children aged 3 - 18 years. Although the groups were age-matched and age was entered into the exploratory regression model, microbial development across this broad age range may still have contributed to within-group variation (32-35). Fourth, the small sample size limited subgroup and multivariable analyses. CP subtype, epilepsy, and antiepileptic drug use could not be included reliably in the adjusted model, and the model itself may have been overfitted. Fifth, the correlation analyses involved multiple comparisons and were not adjusted for all potential clinical or dietary confounders. Sixth, the study used OTU-based relative abundance data and did not measure absolute bacterial load. Seventh, functional prediction, metagenomic sequencing, metabolomic assessment, and inflammatory profiling were not performed. Eighth, only orally fed children with GMFCS levels I–III were included. The findings may therefore not be generalizable to children with GMFCS levels IV–V, children receiving tube feeding or specialized enteral formulas, or children with more severe medical and neurological complexity. Despite these limitations, the study provides preliminary evidence that gut microbial richness, diversity, and composition differ between orally fed children with CP and malnutrition and age-matched healthy controls. These findings should be considered hypothesis-generating and should be validated in larger, multicenter, longitudinal studies incorporating additional comparison groups, standardized dietary assessment, appropriate adjustment for clinical confounders, absolute microbial quantification, and functional multi-omics analysis.
5.1. Conclusions
This study used full-length 16S rRNA gene sequencing to characterize the gut microbiota of children with cerebral palsy and comorbid malnutrition. Compared with age-matched healthy controls, children with CP and malnutrition exhibited lower microbial richness and diversity and differences in microbial community composition, including a higher relative abundance of Bacteroidaceae and Bacteroides and a lower Firmicutes/Bacteroidetes ratio. Microbial diversity indices were also associated with several nutritional indicators, including subscapular skinfold thickness, BMI, and mid-upper arm muscle circumference. These findings indicate an association between gut microbial characteristics and nutritional status in children with CP and malnutrition. However, because separate CP-without-malnutrition and malnutrition-without-CP groups were not included, the observed differences cannot be attributed specifically to CP, malnutrition, or their combined effects. The modest PERMANOVA effect size, exploratory correlation analyses, limited sample size, and potential residual confounding should also be considered when interpreting the results. The observational case–control design precludes causal or therapeutic conclusions.
From a public-health and clinical-care perspective, routine nutritional surveillance, early identification of feeding and swallowing difficulties, monitoring of gastrointestinal symptoms, and timely individualized nutritional support may help prevent further nutritional deterioration and related complications in children with CP (13, 16-18, 20-24). Caregiver education, regular anthropometric monitoring, dietary assessment, and timely referral to multidisciplinary nutritional and feeding services may be particularly important for children at increased nutritional risk. Nevertheless, the present findings do not demonstrate that microbiota-directed interventions can prevent or treat malnutrition in children with CP. Larger longitudinal studies with CP-only and malnutrition-only comparison groups, standardized dietary assessment, adjustment for clinical confounders, absolute microbial quantification, and functional microbiome analyses are required before microbiota-targeted interventions can be recommended.