
1. Background
Neisseria flavescens is a commensal bacterium commonly found in the human upper respiratory tract; however, it can occasionally act as an opportunistic pathogen. Reliable molecular identification and precise quantification of this species are critical for both clinical diagnostics and microbiological research. Although usually benign, N. flavescens has been reported to cause rare but severe infections, including necrotizing pneumonia and empyema, as documented in a recent case involving a 56-year-old diabetic patient. In recent years, this species has been increasingly detected across diverse microbiomes, highlighting its broader biological relevance. Metagenomic studies have identified N. flavescens in oral and gastric microbial communities, where it appears to be enriched in certain disease-associated states, such as gastric intestinal metaplasia, suggesting a potential but underexplored role in gastrointestinal pathology. Collectively, these observations indicate that, despite its low-risk status, N. flavescens is increasingly quantified and investigated in microbiome research, underscoring the need for standardized molecular detection methods to ensure accurate assessment in both clinical and research settings (1-3).
Despite its growing recognition in microbiome studies and occasional involvement in opportunistic infections, N. flavescens lacks commercially available reference strains and standardized DNA materials in many regions, particularly in countries such as Iran and other developing nations. This limitation poses a substantial challenge to accurate molecular quantification and interlaboratory reproducibility, restricting both diagnostic applications and research into its biological role. Without validated DNA standards, qPCR assays and other molecular techniques may yield inconsistent results, hindering comparability between studies and reducing confidence in quantitative measurements (4, 5). Several approaches have been used to generate such standards.
The gold-standard method uses DNA extracted from a commercially available reference strain, which provides high fidelity to natural genomic sequences and ensures reproducibility across laboratories (6-8). However, accurate molecular quantification of N. flavescens is hindered by the lack of commercial reference standards. Because this species is highly similar to species such as N. subflava, N. macacae, and N. sicca, its differentiation is difficult and requires specialized facilities at considerable cost (9, 10). An alternative approach is to clone the target gene into a plasmid, providing a stable, easily stored, high-yield DNA standard. In settings where neither commercial strains nor plasmid resources are available, standards can be produced directly from a positive clinical or volunteer sample. Purified PCR amplicons have previously been reported as suitable quantitative standards for absolute real-time PCR assays, particularly in laboratories where access to reference materials is limited.
2. Objectives
The present study aimed to apply and validate this approach by isolating DNA from a verified sample, amplifying the target region by PCR, purifying the amplicon, confirming sequence identity by Sanger sequencing, and quantifying DNA concentration for serial dilution. Although this method may yield limited amounts of DNA and requires careful validation to avoid contamination, it provides a practical, cost-effective, and reliable solution for generating standards in resource-limited environments (11). Collectively, these strategies highlight the trade-offs among accuracy, accessibility, and practicality, underscoring the need to tailor the standardization approach to the specific laboratory context.
3. Methods
3.1. Primer Design and in Silico Validation
Primer design and specificity testing were performed using NCBI tools and Primer-BLAST. Annealing temperatures, secondary structures, and potential primer-dimer formation were evaluated using OligoAnalyzer to ensure reliable PCR performance. Gene location and copy number were mapped using SnapGene.
3.2. Sample Collection, DNA Isolation, and Quantification
Given the lack of access to a standardized reference strain of N. flavescens within the country, a customized strategy was developed to generate a reliable internal reference for molecular quantification. Sampling was conducted from 22 October 2024 to 22 November 2024. Five healthy volunteers were recruited and provided oropharyngeal swab samples voluntarily under sterile conditions. Inclusion criteria comprised apparently healthy individuals without symptoms of acute respiratory infection, whereas individuals with a recent respiratory infection or recent antibiotic use were excluded. This study was designed as a method-development investigation rather than an epidemiological or prevalence study. The primary objective of sampling was to identify a confirmed N. flavescens-positive specimen for DNA standard generation and subsequent qPCR calibration. Therefore, an initial limited number of samples (n = 5) was screened.
Among these samples, 1 tested positive for N. flavescens and was selected for downstream standard preparation. If no positive specimen had been identified during the initial screening, sampling would have continued until a confirmed positive sample was obtained. Swab specimens were placed in viral transport medium to preserve nucleic acids and stored at -20 °C for 24 hours before DNA extraction (12). Genomic DNA was isolated using the Total DNA Extraction Kit (Roje, Iran) according to the manufacturer's instructions. DNA concentration and purity were evaluated using a NanoDrop spectrophotometer by measuring absorbance at 260 nm and 280 nm; samples with a 260/280 ratio of 1.8 - 2.0 were considered highly pure and suitable for downstream applications (13, 14).
3.3. PCR Optimization
PCR conditions were optimized by testing a temperature gradient to determine the most efficient annealing temperature for the designed primers. Primer concentrations ranging from 0.5 to 1.0 μM were evaluated to identify the concentration that produced clear, specific amplification without nonspecific products. Optimization reactions were performed using an Eppendorf thermal cycler, and the final conditions selected were those yielding the strongest and most specific bands on agarose gel electrophoresis (15).
To monitor potential contamination, no-template controls (NTCs) and extraction blanks were included during PCR optimization and qPCR experiments. Amplification products were analyzed by agarose gel electrophoresis to confirm the presence of a single specific band.
3.4. Gel Electrophoresis and Gel Extraction
PCR products were analyzed by agarose gel electrophoresis. A 1.5% agarose gel was prepared in 1× TAE buffer, and ethidium bromide (0.5 μg/mL) was added for DNA visualization. Samples were mixed with loading dye and loaded onto the gel, which was run at 100 V for 30 - 40 minutes until the DNA bands were clearly separated. The desired DNA fragments were carefully excised using a sterile scalpel. The excised fragments were then purified using the Favorgen Gel Extraction Kit (Yekta Tajhiz Co., Iran) according to the manufacturer's instructions. The purified DNA was subsequently quantified using a NanoDrop spectrophotometer (16).
3.5. Sanger Sequencing and Verification
Purified PCR products were subjected to Sanger sequencing to confirm the identity of the amplified fragments. Sequencing reactions were performed using the BigDye Terminator v3.1 kit (ABI) according to the manufacturer's instructions and run on a 3500ABI Genetic Analyzer. The resulting sequences were analyzed and compared with reference sequences in the NCBI database using BLAST to verify PCR accuracy and specificity.
3.6. Standard Curve Preparation and qPCR Setup
Previous studies have demonstrated that PCR amplicons may serve as suitable standards for absolute qPCR quantification, providing a practical alternative when commercial reference materials are unavailable (11). A standard curve for absolute quantification was constructed by preparing 10-fold serial dilutions of purified DNA (17). qPCR was performed using SYBR Green chemistry on an Applied Biosystems StepOne system under standard cycling conditions, and reactions included negative controls and triplicates. Assay efficiency was calculated from the slope of the standard curve, and specificity was assessed by melt-curve analysis.
4. Results
4.1. Design, Validation, and Application of a Specific PCR Assay for Neisseria Flavescens
Among the 5 designed primer pairs, 1 demonstrated superior specificity and was selected for further analysis. This pair (forward 5′-CGTCGCTGGTTTGGATGTTG-3′ and reverse 5′-ATTGCTTGATTGACCCTAGAGACG-3′) amplified a 195-bp fragment unique to N. flavescens. BLASTn analysis revealed 100% identity with multiple N. flavescens reference strains, whereas closely related species such as N. subflava, N. mucosa, and N. polysaccharea showed less than 92% similarity. Gene location and copy number were mapped using SnapGene and other bioinformatics tools, confirming a single-copy presence in the genome (Figure 1). For reference, the complete sequence of the target gene.
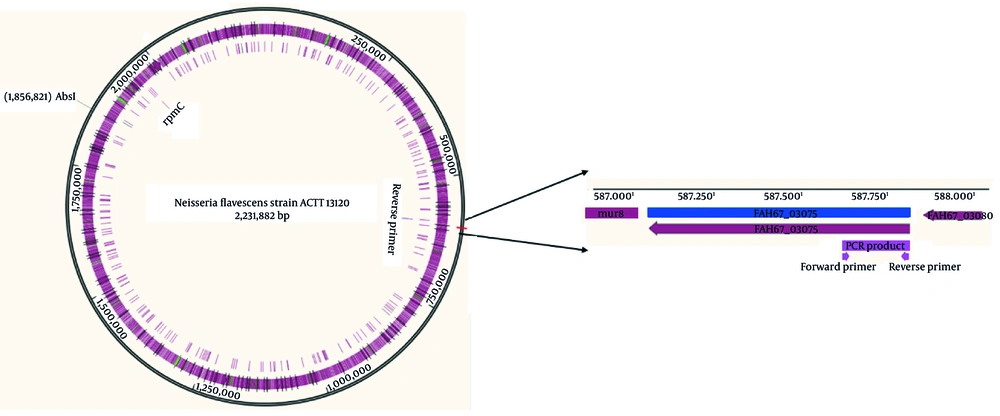
Figure 1.
SnapGene map of N. flavescens showing the 195-bp target sequence with primer-binding sites, confirming its single-copy presence in the genome.
Thermodynamic evaluation using OligoAnalyzer confirmed the absence of hairpins, dimers, and other interfering structures. This validated primer pair was subsequently used in all real-time PCR assays in this study.
Because the primers were newly designed for this study and were not adapted from published protocols, optimization was required (17). Gradient PCR identified 56 °C as the optimal annealing temperature, producing a sharp, specific 195-bp band without nonspecific products. Reagent concentrations were also optimized, with the best results achieved using 0.5 µL of primer (10 pmol) and 2.0 µL of template DNA per reaction. The final PCR protocol produced clean, reproducible bands, and the amplicon was successfully purified for downstream applications, including sequencing and qPCR standard preparation (Table 1). A distinct and reproducible amplicon at the expected molecular weight was observed. This positive sample was considered to contain a detectable quantity of N. flavescens DNA and was selected for subsequent procedures, including amplification, purification, sequencing, and standard curve construction.
Table 1.
Optimization of PCR Conditions
| Parameters | Range Tested | Optimal Conditions | Outcomes (17) |
|---|---|---|---|
| Annealing temperature (°C) | 56, 58, 60, 62 | 56 | Strong, specific band, no by-products |
| Primer volume (µL, 10 pmol/µL) | 0.5, 1.0 | 0.5 | No primer-dimers; sharp target band |
| Template DNA (µL) | 2.0, 3.0, 5.0 | 2.0 | Clean amplification; high specificity |
| PCR product size (bp) | - | ~195 | Distinct, well-defined band |
| Gel electrophoresis | 1.5% agarose, 1× TAE, 100 bp ladder | - | Clear visualization; no nonspecific bands |
4.2. Gel Extraction and Second-Round PCR for Product Enrichment
To obtain a pure, specific amplicon for qPCR standards, the PCR product was separated on a 1.5% agarose gel, and the band of the expected size was excised under UV light using a sterile scalpel. The fragment was purified using the Favorgen Gel Extraction Kit (Yekta Tajhiz Co., Iran) according to the manufacturer's protocol, and DNA concentration and purity were measured using a NanoDrop. A second-round PCR was performed using the gel-purified fragment as the template to enrich the product, followed by confirmation by agarose gel electrophoresis (Figure 2). The final purified product was stored at -20 °C for subsequent qPCR standard curve construction.
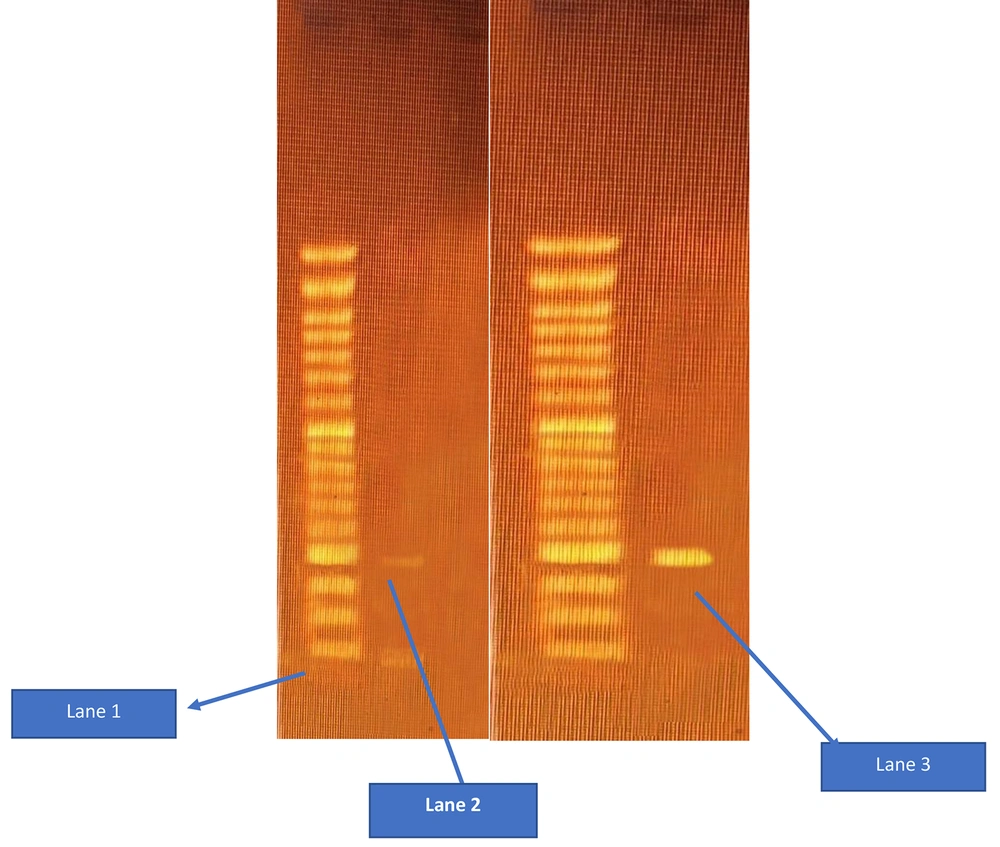
Figure 2.
Agarose gel electrophoresis of PCR products before and after gel extraction and enrichment. Lane 1: 50 bp DNA ladder (size marker). Lane 2: Primary PCR product showing the expected ~195-bp band (arrow) before excision and purification. Lane 3: Enriched PCR product obtained after gel extraction and second-round PCR, showing a single sharp band at ~195 bp without nonspecific products.
4.3. DNA Quantification Using NanoDrop Spectrophotometry
After gel extraction and second-round PCR amplification, the purified PCR product was quantified spectrophotometrically using a NanoDrop instrument (e.g., NanoDrop 2000, Thermo Fisher Scientific). DNA purity was assessed based on the 260/280 ratio, with values around 1.8 indicating high-quality double-stranded DNA (14). The concentration of this standard DNA was 16 ng/µL. This sample was subsequently used to generate a standard curve in the real-time PCR assay. Serial dilutions were prepared from this stock to enable precise quantification of target DNA in experimental samples. This quantification step ensured that the standard DNA used for real-time PCR curve construction had adequate concentration and high purity, both of which are essential for accurate and reproducible qPCR results.
4.4. Sanger Sequencing and Identity Confirmation of the PCR Product
The PCR product was sent directly for sequencing to confirm that the gene of interest had been correctly amplified and that no unintended sequences were present. The sequencing reaction was conducted using standard primers specific to the amplified region, and results were obtained using an automated sequencing system. The resulting sequence was analyzed by alignment with the reference gene sequence to verify accuracy and identity. A BLAST search was conducted to compare the sequencing data with available sequences in public databases, confirming that the sequence matched the expected target gene (Figure 3). The sequence data confirmed the correct identity of the gene. Alignment of the obtained sequence with the reference gene sequence showed a perfect match without discrepancies, indicating that PCR amplification successfully targeted and purified the gene of interest. The target genomic region corresponds to positions 587549 - 587890 in the N. flavescens ATCC 13120 genome (342 bp). However, the specific qPCR amplicon generated by the designed primers was 195 bp in length. Sanger sequencing was performed to confirm the identity of the PCR product, and the confirmed amplicon length (195 bp) was used for DNA copy-number calculations.
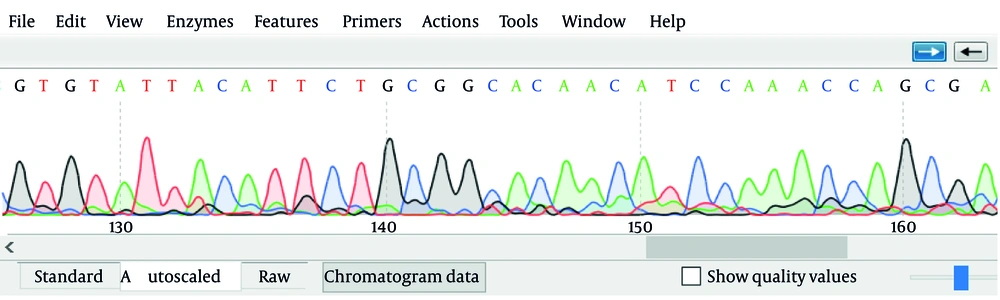
Figure 3.
Sequence of the amplified fragment confirmed by Sanger sequencing, demonstrating specificity for N. flavescens.
4.1. Target Gene Sequence
>CP039886.1:587549 - 587890 N. flavescens strain ATCC 13120 chromosome, complete genome
ATGTTTTCAACTTCCATTATAGAAAAACTTGCTTACTATGTTT
ATTGCTTGATTGACCCTAGAGACGGCAATATTTTCTATGTAG
GTAAAGGCTTGAACAATCGCGTTTTCCATCATGCTCAAGAGA
AAAGCCAAGTGATAAAATTGCCTTGATTAGGGAAATACATA
AAAGCGGACACCAGCCCGTGTATTACATTCTGCGGCACAACA
TCCAAACCAGCGACGAGGCTGAACAATATGAAGCGATGGCAATA
GACCTACTCTCCCTAGTCAAACAGAGCCAGCAGCCGCTGACTA
ATATTCAAGGGGGGCAAGCATTCTTCTGA
4.2. Sequencing Results
TGCTTGATTGACCCTAGAGACGGCAATATTTTCTATGTAGGT
AAAGGCTTGAACAATCGCGTTTTCCATCATGCTCAAGCCTCATT
ACAAGAAATAGAAAAGCCAAGTGATAAAATTGCCTTGATTAGGGAA
ATACATAAAAGCGGACACCAGCCCGTGTATTACATTCTGCGGCAC
AACATCCAAACCAGCGACG
4.3. NCBI Accession Number
The sequence has now been submitted to NCBI and assigned the accession number PX570094. This accession number should be cited in any publication reporting or discussing these data. The identity of the PCR product was therefore conclusively confirmed, and the sequence was used in downstream applications, including the construction of a standard curve for qPCR.
4.5. Standard Curve Establishment for qPCR
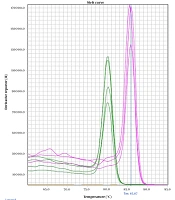
The confirmed and purified amplicon was quantified using a NanoDrop spectrophotometer, yielding a concentration of 16 ng/µL. The DNA copy number was calculated based on the amplicon length, DNA mass concentration, and Avogadro's constant using the standard molecular copy-number formula, resulting in approximately 7.49 × 10¹⁰ copies/µL (Figure 4). This DNA stock was used to prepare a series of 10-fold serial dilutions to construct the qPCR standard curve. Under the optimized real-time PCR conditions described in Table 2, the assay showed a highly linear relationship between Ct values and the logarithm of input copy number, with a slope of -3.381, a correlation coefficient of R2 = 0.996, and an amplification efficiency of 97.581%. Based on these data, the assay demonstrated a quantifiable dynamic range from 103 to 109 copies per reaction, using R2 > 0.99, amplification efficiency within 90% - 110%, and consistent technical replicate performance as acceptance criteria. Technical triplicates showed minimal variation (Ct SD < 0.2), indicating high intra-assay reproducibility, and no amplification was observed in no-template controls, supporting the absence of contamination. In addition, melt-curve analysis showed a single sharp peak at Tm = 84.94 °C, confirming amplification specificity and the absence of detectable nonspecific products or primer-dimers (Figure 5). The lowest dilution that consistently amplified in all triplicates corresponded to approximately 102 copies per reaction and was considered the limit of detection (LOD) under the present experimental conditions. A formal limit of quantification (LOQ) and inter-run/inter-day reproducibility assessment were not established in this study and are acknowledged as limitations of this research-use assay. Taken together, these findings support the analytical suitability of the assay for research-use absolute quantification of N. flavescens DNA in oropharyngeal swab samples.
Table 2.
qPCR Cycling Conditions and Quality Control Parameters
| Steps | Temperature (°C) | Time | Cycles | Additional Notes |
|---|---|---|---|---|
| Initial denaturation | 95 | 10 min | 1 | - |
| Denaturation | 95 | 20 sec | 40 | - |
| Annealing | 56 | 30 sec | 40 | - |
| Extension | 72 | 30 sec | 40 | - |
| Final extension | 72 | 5 min | 1 | - |

Figure 4.
Calculation of DNA copy number based on DNA mass, amplicon length, Avogadro's constant, and the molecular weight of double-stranded DNA using the equation shown above. In this calculation, X represents the measured DNA mass determined by NanoDrop spectrophotometry (16 ng/µL; mean of 3 replicate measurements), and N represents the length of the PCR amplicon (298 bp). The value 660 g/mol per bp was used as the average molecular weight of 1 base pair of double-stranded DNA. The final copy number was expressed as copies/µL. DNA purity was verified using A260/A280 ratios (1.7 - 1.9) before preparation of the standard dilution series.
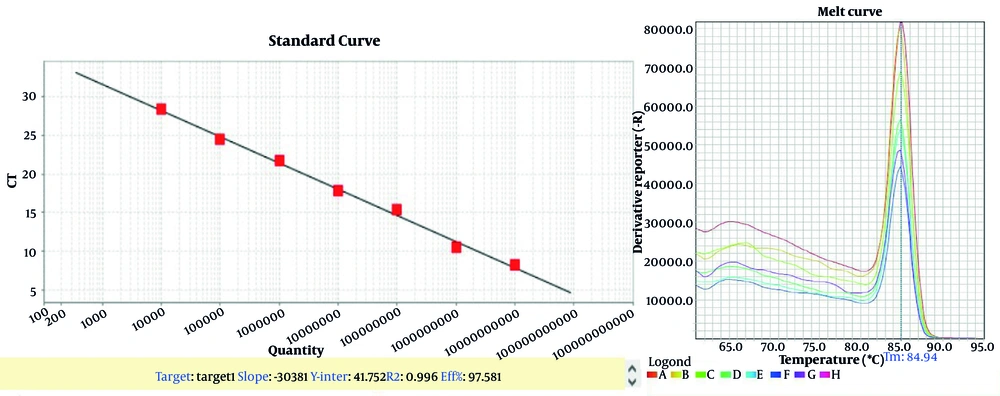
Figure 5.
Standard curve and melt-curve analysis for the qPCR assay targeting N. flavescens. Ten-fold serial dilutions of the confirmed amplicon (7-point dilution series, 107 - 101 copies) were analyzed by real-time PCR to generate the standard curve. The plotted Ct values represent mean Ct values from triplicate reactions. The assay demonstrated excellent linearity (R2 = 0.996), with a slope of -3.381, a y-intercept of 41.752, and an amplification efficiency of 97.581%. Melt-curve analysis showed a single sharp peak at Tm = 84.94 °C, confirming amplification specificity and the absence of nonspecific products or primer-dimers. No amplification was observed in the no-template controls.
5. Discussion
The stepwise workflow developed in this study to generate an internal DNA standard from clinical samples provides a practical and cost-effective approach for the absolute quantification of N. flavescens. This initial molecular detection served as a critical starting point for producing a high-copy, verified DNA standard in the absence of an external control strain, supporting the feasibility of isolating N. flavescens from healthy human swabs as a representative biological source for assay development. Traditional molecular quantification often relies on commercially available reference strains or cloned plasmid standards, which are costly, require specialized infrastructure, and are not readily accessible in many regions (11, 18). By directly isolating the target gene from oropharyngeal swab samples, we bypassed some of these constraints and demonstrated a feasible alternative that may reduce both the financial burden and the time required to establish a standard curve under research conditions.
The use of purified PCR products as qPCR standards has been evaluated previously and shown to be suitable for absolute quantification, although plasmid standards may provide superior stability during long-term storage (11). This strategy may also be adaptable to other bacterial species through the design of species-specific primers derived from publicly available genomic sequences (19). The combination of in silico primer design with conventional PCR amplification, gel purification, and Sanger sequencing provides a flexible framework for generating internal standards for different microbial targets (20). In research contexts, such an approach may support quantitative investigations of pathogenic bacteria, environmental isolates, or commensal microbiota, provided that appropriate validation is performed for each organism and assay system. For organisms requiring higher biosafety containment, the use of purified DNA fragments rather than live cultures may represent a practical and potentially safer alternative during the early stages of assay development (21).
Beyond research applications, this workflow may also have educational value. The procedures described here incorporate several fundamental molecular biology techniques, including PCR optimization, gel electrophoresis, DNA purification, and Sanger sequencing, enabling students and trainees to gain practical experience without the need to culture pathogenic strains or acquire costly reference materials. The use of internally generated DNA standards derived from naturally occurring, low-risk organisms can also facilitate training in quantitative PCR and standard-curve construction, which are core competencies in many research and diagnostic laboratories. Potential translational or commercial applications should, however, be interpreted cautiously. DNA fragments generated through workflows such as the one described here could potentially serve as starting materials for the future development of standardized reagents or reference materials for qPCR assays (5, 22). However, such applications would require additional validation steps, including stability testing, large-scale production assessment, lot-to-lot consistency evaluation, and multi-laboratory performance verification.
Similarly, although DNA-based standards could theoretically be useful in contexts in which handling live organisms poses safety challenges, such as studies involving pathogenic bacteria or high-containment environments, these applications remain prospective and would require further validation before implementation (23, 24). The use of purified DNA rather than viable cells may help reduce biosafety risks during assay development and the preparation of reference materials (25). Several limitations of the present study should be acknowledged. The initial screening was performed using a relatively small number of volunteers, and the workflow was ultimately evaluated using a single confirmed amplicon source derived from 1 positive sample for the preparation of the internal qPCR standard. In addition, analytical validation of the assay was conducted within a single laboratory environment, and external validation across independent laboratories was not performed.
Although the qPCR assay demonstrated strong linearity, amplification efficiency, a defined dynamic range, and high intra-assay reproducibility, direct comparison with a commercial reference strain or a plasmid-based quantitative standard was not included in the present study. Furthermore, formal assessments of the long-term stability of the DNA standard, lot-to-lot reproducibility, and large-scale production feasibility were beyond the scope of this work. Consequently, the generalizability of this workflow to other laboratories or broader applications should be interpreted with caution. Future investigations should therefore evaluate these parameters, perform inter-laboratory validation, and assess the applicability of this workflow across additional organisms and laboratory settings.
5.1. Conclusions
Overall, this study demonstrates the feasibility of generating an internally derived DNA standard for research-use qPCR quantification of N. flavescens. This approach may help laboratories with limited resources establish quantitative assays without relying on expensive commercial reference materials. With further validation, refinement, and broader testing, similar workflows may contribute to expanding access to quantitative molecular tools in microbiology research and training environments.
Ethics Statement: The study was approved by the Golestan University of Medical Sciences Ethics Committee (Approval ID: IR.GOUMS.REC.1404.174), and all procedures were conducted in accordance with institutional guidelines. All samples were anonymized, and no identifiable personal information was accessible to the researchers.