


1. Background
2. Objectives
3. Methods
3.1. Study Population
| Groups | Positive | Negative | Coinfection | |||
|---|---|---|---|---|---|---|
| Improved | Death | Improved | Death | Improved | Death | |
| Age (y) | 77.44 ± 8.94 | 85.20 ± 7.46 | 75.67 ± 7.45 | 68 | 79.95 ± 8.59 | 82.13 ± 7.11 |
| Male | 76 | 3 | 15 | - | 40 | 14 |
| Female | 36 | 2 | 21 | 1 | 22 | 1 |
| Time to admission (d) | 9.60 ± 5.89 | 9.20 ± 6.22 | 10.00 ± 6.94 | 10 | 10.37 ± 5.54 | 11.67 ± 8.47 |
| Hospital days | 10.24 ± 7.14 | 12.60 ± 6.27 | 6.97 ± 2.81 | 21 | 11.61 ± 7.40 | 14.80 ± 10.63 |
| Chronic underlying disease | ||||||
| Hypertension | 62 (55.36) | 1 (20.00) | 27 (75.00) | 1 (100) | 30 (48.39) | 5 (33.33) |
| Diabetes | 31 (27.68) | 2 (40.00) | 13 (36.11) | 0 (0) | 14 (22.58) | 1 (6.67) |
| Heart disease | 25 (22.32) | 1 (20.00) | 4 (11.11) | 0 (0) | 18 (29.03) | 3 (20.00) |
| Malignant tumor | 12 (10.71) | 1 (20.00) | 1 (2.78) | 0 (0) | 11 (17.74) | 2 (13.33) |
| Chronic lung disease | 8 (7.14) | 0 (0) | 1 (2.78) | 0 (0) | 4 (6.45) | 0 (0) |
| Cerebrovascular disease | 4 (3.57) | 0 (0) | 2 (5.56) | 0 (0) | 8 (12.90) | 0 (0) |
| Admission CURB-65 score | 1.79 ± 0.70 | 2.40 ± 0.55 | 1.69 ± 0.67 | 2.0 | 2.10 ± 0.69 | 2.33 ± 0.62 |
a Values are expressed as number, No. (%) or mean ± SD. Abbreviations: > COVID-19, coronavirus disease 2019; CURB-65, confusion, urea, respiratory rate, blood pressure, age ≥ 65 years.
3.2. Grouping
3.3. Th1/Th2/Th17 Cytokines in Blood Samples
3.4. Statistical Analysis
4. Results
4.1. Cytokine Levels in Older Adults With COVID-19 Pneumonia Across Age Groups
| Ages | IL-2 b | IL-4 b | IL-6 b | IL-10 b | TNF-α b | IFN-γ b | IL-17A b |
|---|---|---|---|---|---|---|---|
| 60 - 69 (n = 24) | 1.96 ± 1.66 | 1.60 ± 1.26 | 6.08 ± 5.16 c | 12.63 ± 33.54 | 1.88 ± 1.09 | 2.35 ± 1.70 | 4.00 ± 2.76 |
| 70 - 79 (n = 43) | 2.05 ± 1.97 | 1.88 ± 1.38 | 12.50 ± 18.69 d | 5.55 ± 4.45 | 1.98 ± 0.81 | 2.46 ± 1.66 | 5.02 ± 5.50 |
| 80 - 89 (n = 39) | 1.80 ± 1.36 | 1.84 ± 1.09 | 35.86 ± 42.12 | 5.55 ± 7.39 | 1.80 ± 0.75 | 2.10 ± 1.12 | 4.96 ± 4.93 |
| 90 - 100 (n = 11) | 0.89 ± 0.74 | 1.35 ± 1.01 | 17.86 ± 16.75 | 3.35 ± 1.78 | 1.76 ± 0.74 | 1.62 ± 0.72 | 5.97 ± 6.39 |
a Values are expressed as mean ± SD. Abbreviations: S-RNA+, patients positive for SARS-CoV-2 RNA without bacterial co-infection.
b The serum concentration unit is pg/mL.
c P = 0.002, 60 - 69 versus 80 - 89 age group.
d P = 0.009, 70 - 79 versus 80 - 89 age group.
4.2. Cytokine Levels in Older Adults With COVID-19 Pneumonia Across Different Disease Courses
4.3. Cytokine Levels in Older Adults With COVID-19 Pneumonia in the S-RNA+, S-RNA−, and S-RNA+BI Groups
| Groups | IL-2 a | IL-4 a | IL-6 a | IL-10 a | TNF-α a | IFN-γ a | IL-17A a |
|---|---|---|---|---|---|---|---|
| S-RNA+ (n = 117) | 1.84 ± 1.64 | 1.76 ± 1.23 | 19.20 ± 29.71 | 6.79 ± 16.05 | 1.88 ± 0.85 | 2.24 ± 1.45 | 4.88 ± 4.92 |
| S-RNA− (n = 37) | 1.38 ± 1.25 | 2.05 ± 1.72 | 8.11 ± 14.86 b | 4.29 ± 6.73 d | 1.93 ± 0.98 | 2.00 ± 1.14 | 5.93 ± 4.33 |
| S-RNA+BI (n = 77) | 1.90 ± 2.03 | 2.04 ± 1.73 | 70.75 ± 202.20 c | 7.78 ± 15.02 | 2.09 ± 1.13 | 4.72 ± 14.64 | 6.97 ± 6.72 |
aValues are expressed as mean ± SD. The serum concentration unit is pg/mL.
b P = 0.007, SARS-CoV-2 RNA-positive (S-RNA+) versus SARS-CoV-2 RNA-negative (S-RNA−) group.
c P = 0.03, S-RNA+ versus SARS-CoV-2 RNA-positive with bacterial infection (S-RNA+BI) group.
d P = 0.03, S-RNA+ versus S-RNA− group.
4.4. Analysis of Cytokine Markers for Predicting Mortality Events
| Groups and Outcomes | IL-2 b | IL-4 b | IL-6 b | IL-10 b | TNF-α b | IFN-γ b | IL-17A b |
|---|---|---|---|---|---|---|---|
| S-RNA+ | |||||||
| Survivors (n = 112) | 1.84 ± 1.66 | 1.75 ± 1.24 | 16.85 ± 24.13 | 6.42 ± 15.85 | 1.87 ± 0.85 | 2.20 ± 1.45 | 4.88 ± 4.84 |
| Non-survivors (n = 5) | 1.79 ± 0.93 | 1.89 ± 1.00 | 78.39 ± 69.00 d | 15.14 ± 18.73 f | 2.12 ± 0.78 | 3.10 ± 0.76 | 4.99 ± 6.74 |
| S-RNA+BI | |||||||
| Survivors (n = 62) | 1.79 ± 1.49 | 1.90 ± 1.75 | 20.50 ± 33.30 | 7.14 ± 16.43 | 2.04 ± 1.21 | 3.66 ± 10.70 | 6.40 ± 6.48 |
| Non-survivors (n = 15) | 2.38 ± 3.51 | 2.63 ± 1.55 c | 278.46 ± 399.50 e | 10.44 ± 6.23 g | 2.25 ± 0.75 | 9.11 ± 25.29 | 9.29 ± 7.40 |
aValues are expressed as mean ± SD. Abbreviations: S-RNA+, SARS-CoV-2 RNA-positive; S-RNA+BI, SARS-CoV-2 RNA-positive with bacterial infection.
b The serum concentration unit is pg/mL.
c P = 0.04 survivors versus non-survivors in the S-RNA+BI group.
d P < 0.001 survivors versus non-survivors in the S-RNA+ group.
e P = 0.002 survivors versus non-survivors in the S-RNA+BI group.
f P = 0.02, survivors versus non-survivors in the S-RNA+ group.
g P = 0.001, survivors versus non-survivors in the S-RNA+BI group.
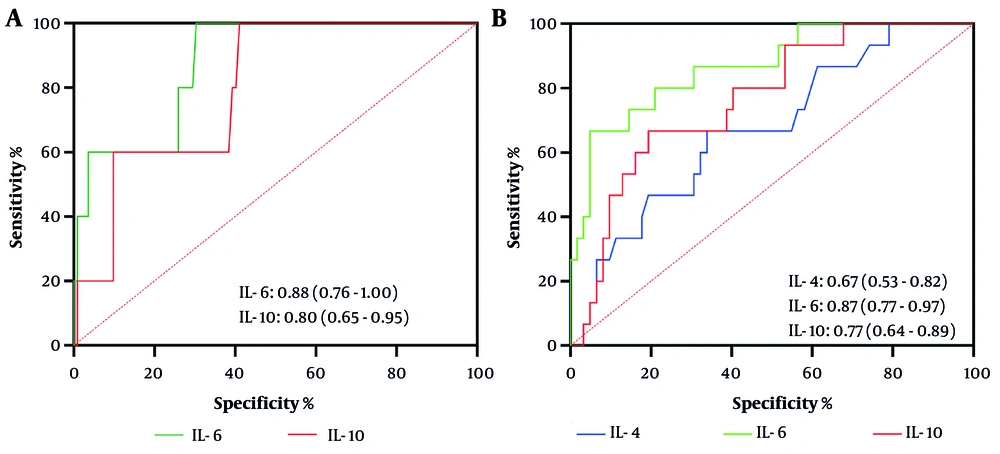
Receiver operating characteristic (ROC) curve analysis was conducted to distinguish survivors from non-survivors in the S-RNA+ (112 versus 5) and S-RNA+BI (62 versus 15) groups. An area under the ROC curve (AUC) closer to 1 indicates higher diagnostic accuracy. AUC data are presented as values (95% confidence intervals). A, In the S-RNA+ group, IL-6 showed the highest AUC value, sensitivity, and specificity. B, In the S-RNA+BI group, IL-6 showed the highest AUC value, while IL-10 had the highest specificity. The cutoff values are internally derived and exploratory unless externally validated.
