1. Background
Leptospirosis is a global zoonotic disease caused by pathogenic organisms of the genus Leptospira, mostly found in tropical and subtropical countries (1). Based on agglutinating lipopolysaccharide (LPS) antigens, pathogenic Leptospira can be divided into more than 300 serovars belonging to different serogroups (2). Leptospira interrogans serovar hardjo and L. borgpetersenii serovar hardjo are the predominant pathogenic species of cattle leptospirosis in China (3-5). The symptoms of infected cattle do not frequently develop into typical signs of acute leptospirosis. However, reproductive failure and spontaneous abortion are the most common clinical signs. Bovine leptospirosis could affect growth in cattle production and is easily transmitted to humans through direct or indirect transmission from the infected outer environment (6-8).
As one of the major outer-membrane components in Leptospira, LPS can affect the virulence of pathogenic Leptospira (9). Leptospiral LPS (L-LPS) exhibits a species-specific immune response through toll-like receptors (TLRs). Murine cells can activate an immune response through TLR2 and TLR4 under L-LPS stimulation, but only through human TLR2 during a Leptospira infection (10). Until now, the function of TLRs in bovine innate immunity during Leptospira infections has been unclear. In this study, we employed bovine fetal fibroblasts (BFF_NCC1) to elucidate the main function of TLR2 in bovine innate immunity during Leptospira infections.
Isogai et al. (4) reported that L-LPS shows endotoxin-like activity similar to that of Escherichia coli LPS. After L-LPS stimulation, various proinflammatory cytokines are secreted. Due to the imbalanced or overwhelming production of these cytokines, leptospirosis may lead to septic shock, such as leptospiral uveitis (11) and liver necrosis (12).
Recent studies have demonstrated that cathelicidin-derived antimicrobial peptides, including LL-37 (human), RCAP18 (rabbit), bovine myeloid antimicrobial peptide-28 (BMAP-28), and SMAP-29 (sheep), have the ability to inhibit LPS-induced cytokine secretion through direct binding to LPS or blocking the binding of LPS to LPS-binding protein (LBP) (13-15). Due to these characteristics, these peptides have become potential drug candidates for the treatment of Gram-negative bacteria-induced endotoxin shock and sepsis. However, the inhibiting effect of BMAP-28 on the interaction between L-LPS and bovine cells is still vague.
2. Objectives
In this study, we employed BFF_NCC1 cells to verify the function of TLR2 in bovine innate immunity during Leptospira infections. In addition, we determined whether BMAP-28 could inhibit the toxicity of L-LPS by decreasing the TLR2-dependent cytokine expression in bovine cells. This approach might lead to an alternative therapy compared to risky antibiotic treatments.
3. Materials and Methods
3.1. Preparation of Leptospiral LPS
Leptospira interrogans serovar hardjo was cultured in Ellinghausen-McCullough-Johnson-Harris medium (EMJH; Difco, USA) supplemented with 10% normal rabbit serum (Gibco, USA) at 28°C for 7 days. The L-LPS was extracted using the method of Isogai et al. (4). Escherichia coli serotype O111:B4 LPS (E-LPS; Sigma-Aldrich, USA) was used as a positive control.
3.2. Peptide Preparation
BMAP-28 (sequences: GGLRSLGRKILRAWKKYGPIIVPIIRI) was produced using the method of Isogai et al. (16). Briefly, the peptide was synthesized with the solid-phase methodology, and purified with reverse-phase high-performance liquid chromatography (Shimadzu, Japan). It was suspended in Hanks’ balanced salt solution (Gibco, USA) and stored at -20°C. Unfolded BMAP-28 (uBMAP-28) was used as the negative control peptide.
3.3. Cell Culture and LPS Stimulation
The BFF_NCC1 cells were kindly provided by Prof. Fukuda (17). Cells were cultured in DMEM culture medium (Nacalai-tesque, Japan) including 10% fetal bovine serum (FBS; Biowest SAS, France) and 1% antibiotic and antimycotic solution (Nacalai-tesque, Japan). The cells (1 × 10⁶ cells/well) were suspended in 6-well plates and cultured overnight at 37°C in 5% CO2. The culture medium was then transferred to antibiotic-free medium for 2 hours before LPS stimulation. The unstimulated well was used as a control. The present study was approved by the ethics committee of Xi’an Jiaotong university faculty of medicine (2014027).
3.4. RNA Extraction, cDNA Preparation and Real-Time Polymerase Chain Reaction
Total RNA was isolated from the bovine cells according to the protocol of the NucleoSpin RNA II kit (Takara Bio, Japan). The total RNA was reverse-transcribed into cDNA using a PrimeScript RT reagent kit (Takara Bio, Japan), and 1 µg of cDNA was used for the quantitative real-time polymerase chain reaction (qRT-PCR) performed on a thermal cycler dice real-time PCR system II (Takara Bio, Japan). SYBR Premix ExTaq II and the primers listed in Table 1 were used in this study. The amplification condition of qRT-PCR was performed as follows: 3 min at 95°C, and 40 cycles at 95°C for 15 s and 60°C for 1 minutes. The final results were exported as the relative expression level, and the β-actin gene was detected as an internal standard. In order to visualize the qRT-PCR results for TLR4, 10 μL of the qRT-PCR reaction was electrophoresed in 10% Del-gel (Kitasato Medical Service, Japan) and stained with GelRed (Biotium, USA). Bovine peripheral blood mononuclear cells (PBMCs) were used as positive controls (18).
Table 1.
Primers Used in This Study
| Gene | Forward | Reverse | Accession No. |
|---|---|---|---|
| TLR2 | TCTGCTACGACGCCTTCGT | GCTCCTGGACCATGAGGTTCT | NM174197.2 |
| TLR4 | AGCAGATGCAGAAACCAACC | TGGTACATGGCGGCATTTAC | NM174198 |
| β-actin | TTTTTGGCGCTTGACTCAGG | TTGGGAATGCTCGATCCAAC | AY141970.1 |
3.5. Western Blotting Analysis
Total proteins were obtained from bovine cells with lysine solution (50 mM Tris-HCl, 0.15 M NaCl, 1% Triton X-100, 2.5 mg/mL sodium deoxycholate, and a protease inhibitor cocktail from Nacalai-tesque). The total protein concentrations were calibrated by a DC Protein assay reagent (Bio-Rad, USA). Next, 10 μg of protein was subjected to SDS-PAGE (ATTO, Japan) and blotted onto polyvinylidene fluoride membrane (Millipore, USA) as described previously (19). Lastly, the ECL chemiluminescence Western blot system was used to detect the protein expression level. The expression of β-actin (Santa Cruz, CA, USA) was used as a loading control.
3.6. Enzyme-Linked Immunosorbent Assay
The cytokine (TNF-α and IL-6) secretion of bovine cells was measured by following the instructions for bovine enzyme-linked immunosorbent assay kits (ELISA; R and D, USA). The optical density values were observed at 450 nm wavelengths in an ELISA plate reader. The concentrations of samples were calculated by known standards in Microsoft Excel. Each sample was measured twice to ensure the reproducibility of the experiment.
3.7. Statistical Analysis
Three independent experiments were performed for each assay. The mathematical results were displayed as mean ± standard deviation. The P-value was calculated using Steel’s test in GraphPad Prism 6 software. The values of P < 0.05 (*) and P < 0.01 (**) were considered as statistically significant.
4. Results
To examine the bovine cellular inflammatory response triggered by L-LPS, the ELISA method was applied to analyze the amount of TNF-α and IL-6 secretion in the BFF_NCC1 cell culture supernatant. As shown in Figure 1, these cytokines were significantly up-regulated either by L-LPS and E-LPS stimulations (P < 0.05). After the L-LPS stimulations, the TNF-α secretion level increased to a peak when using 10 μg/mL L-LPS. It then decreased slightly at 100 μg/mL of L-LPS stimulation (Figure 1A). IL-6 secretion was stably enhanced following the increased dose of L-LPS (Figure 1B). In the time-dependent experiment of L-LPS stimulation, the secretion levels of TNF-α and IL-6 reached the highest level at 6 h and maintained that level for 24 hours.
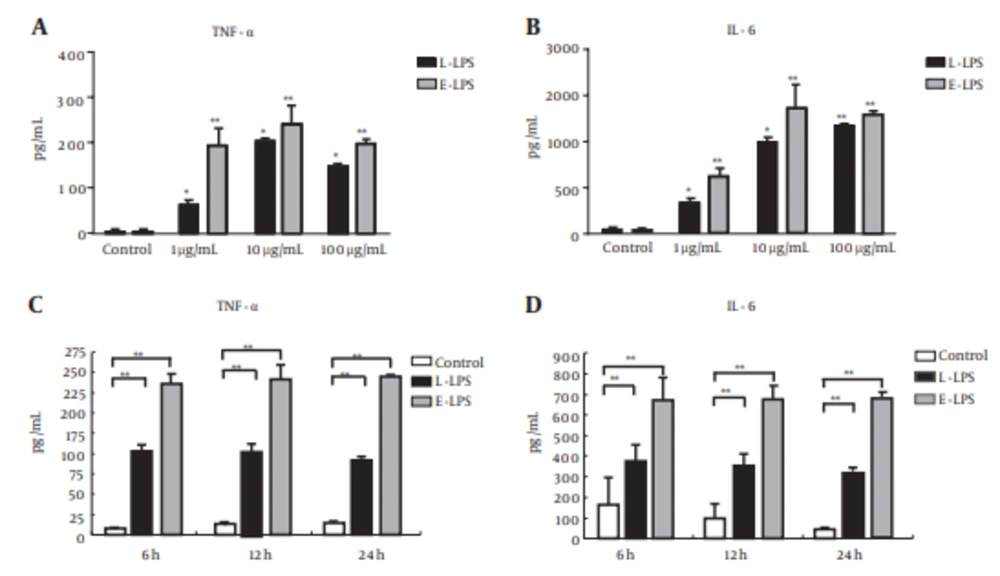
Figure 1.
For the dose experiment, the cell supernatant fluids were collected at 6 hours after incubation with 1, 10, and 100 μg/mL concentrations of LPS. (A) TNF-α, (B) IL-6. For the time experiment, cell supernatant fluids were collected at 6, 12, and 24 h after incubation with concentrations of 1 μg/mL of LPS. (C) TNF-α, (D) IL-6. The data are shown as an average of biological replicates ± SD. Asterisks indicate significant differences (* P < 0.05, ** P < 0.01).
The TLR2 and TLR4 mRNA expressions in cultured BFF_NCC1 cells were analyzed by qRT-PCR. Figure 2 shows that PBMCs can express 237-bp TLR4 mRNA, but BFF_NCC1 cells did not express such mRNA. Therefore, the BFF_NCC1 cells could be used as a good cell model for studying the immune response through TLR2.
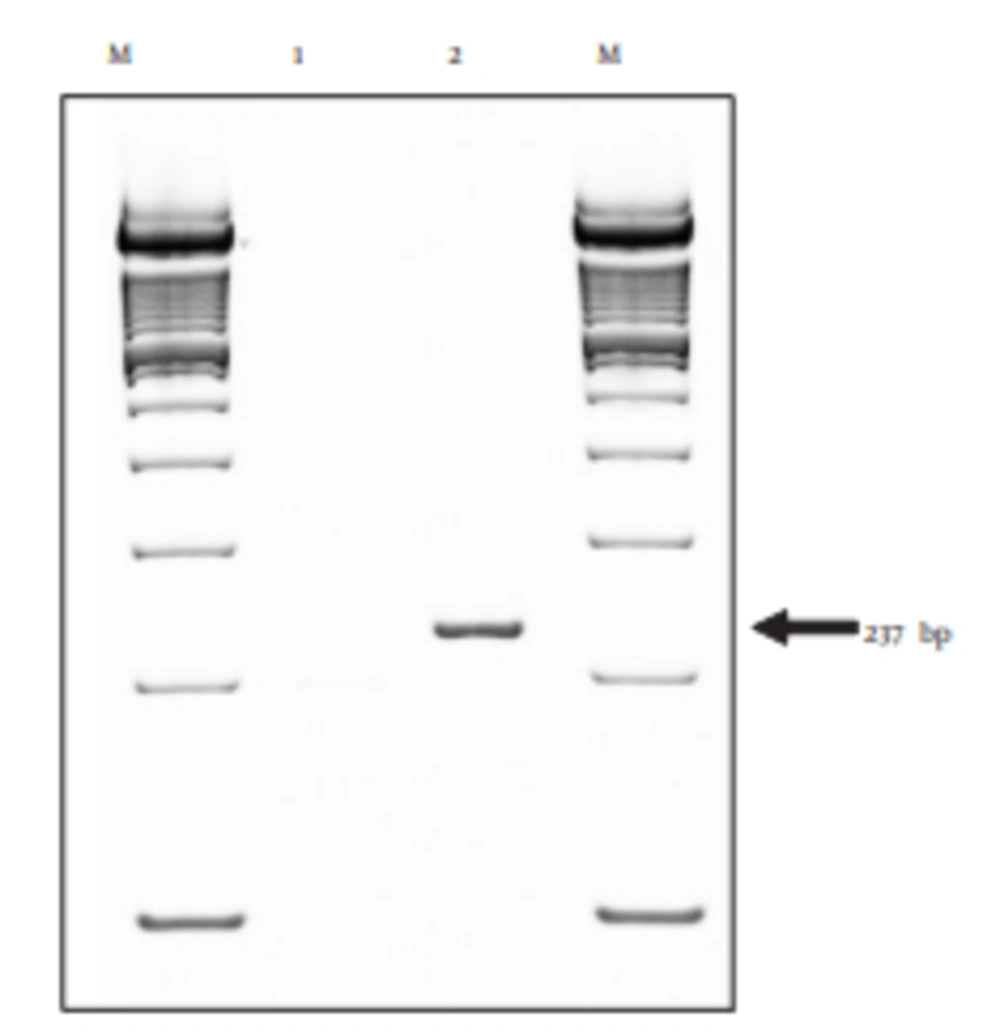
Figure 2.
Lane 1, BFF_NCC1 cells; lane 2, PBMCs; M, marker (100-bp DNA ladder).
As shown in Figure 3A, we examined the mRNA expression of TLR2 in response to various concentrations of L-LPS in BFF_NCC1 cells. After the stimulation of L-LPS, the TLR2 mRNA expression level was significantly increased in a dose-dependent manner (P < 0.05). The relative increase of the TLR2 mRNA expression level in L-LPS stimulated cells reached 1.9-fold compared with unstimulated cells. As a positive control, E-LPS induced up-regulation of TLR2 mRNA expression (1.5 - 2.1-fold) at doses ranging from 1 to 100 μg/mL (P < 0.05). As shown in Figure 3B, the time-dependent regulation of TLR2 mRNA expression was also tested in BFF_NCC1 cells under 1 μg/mL of L-LPS stimulation. In cells incubated with 1 μg/mL of L-LPS, the TLR2 mRNA expression was obviously up-regulated 1.5-fold at 6 hours and was then stably expressed for 24 hours (P < 0.05). When the cells were incubated with E-LPS, the TLR2 mRNA expression level was higher than with L-LPS stimulation (P < 0.05). These results indicated that TLR2 might be the major receptor in the bovine innate immune response to L-LPS stimulation.
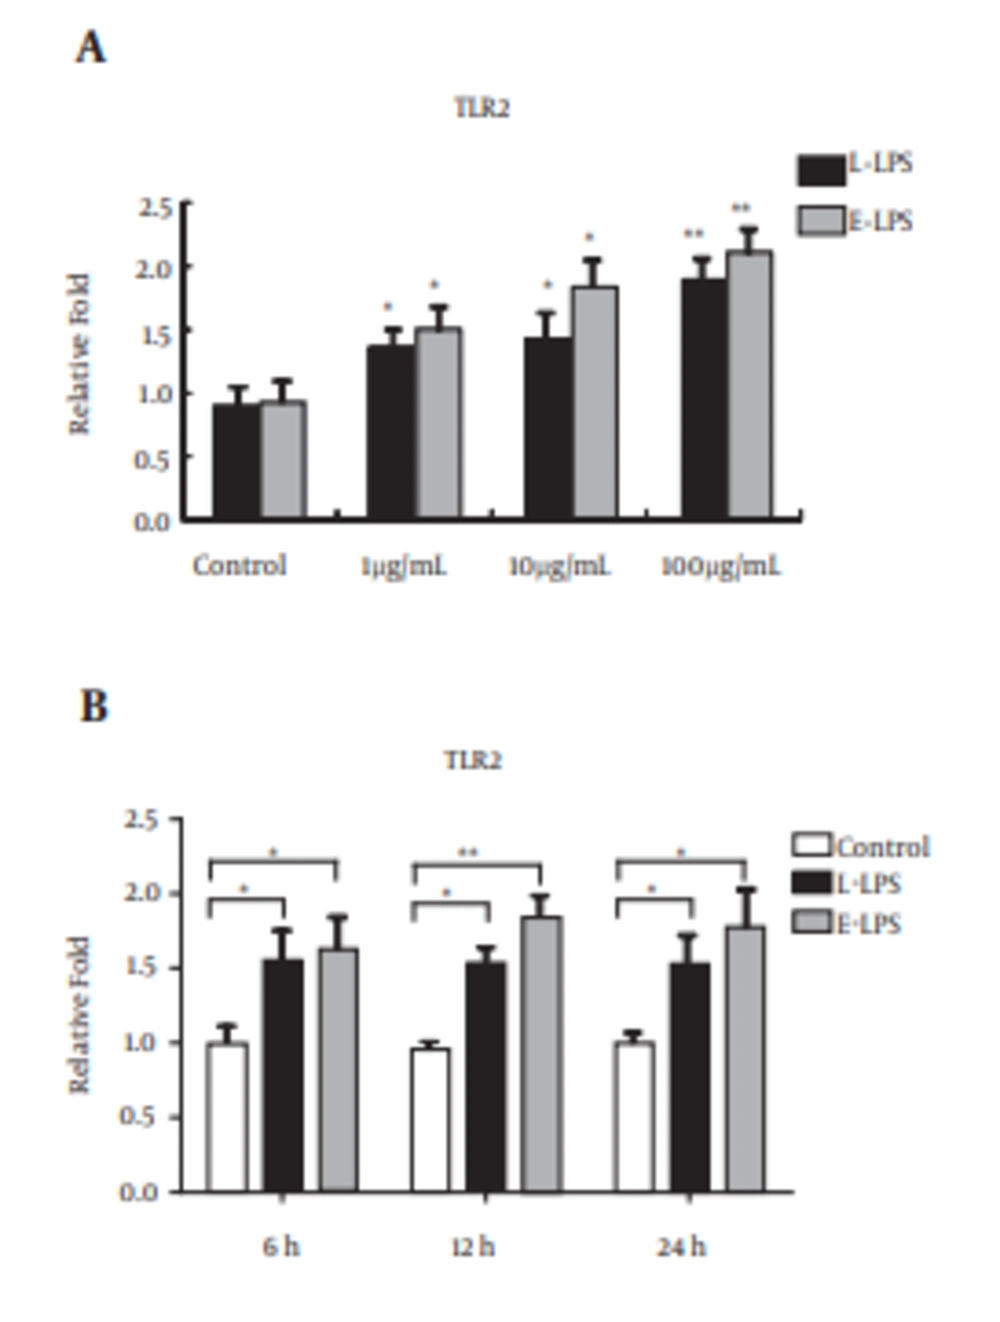
Figure 3.
A, Cells were isolated after incubation with 1, 10, and 100 μg/mL concentrations of LPS at 6 hours; B, cells were isolated at 6, 12, and 24 hours after incubation with 1 μg/mL of LPS. Data are shown as averages of biological replicates ± SD. Asterisks indicate significant differences (* P < 0.05, ** P < 0.01).
To ensure the up-regulation of TLR2 after L-LPS stimulation in the BFF_NCC1 cells, the protein expression level of TLR2 was examined with Western blotting (Figure 4). The expression level of TLR2 protein was increased after 1 μg/mL of L-LPS stimulation at 6 hours, and it showed a stably low expression level in unstimulated BFF_NCC1 cells. Based on the density measurement of protein bands, the expression level of TLR2 protein in L-LPS-stimulated cells was approximately 2.4-fold greater than that of unstimulated cells.
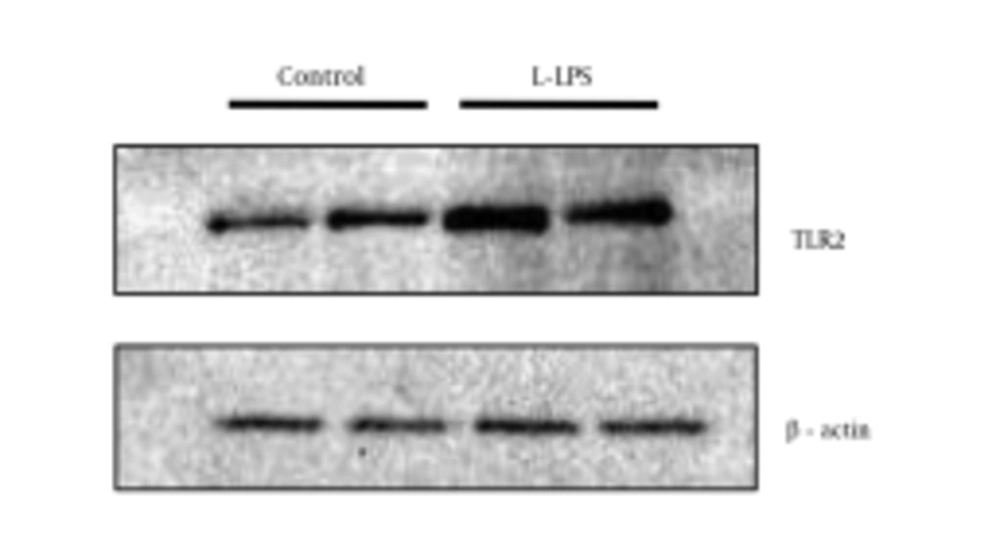
Figure 4.
Cells were stimulated by 1 μg/mL of L-LPS for 6 hours. Unstimulated cells were used as a control. The two lanes shown for the respective experimental conditions are the results obtained from duplicate experiments in which the cells were separately prepared. Anti-β-actin polyclonal antibody was used to detect β-actin as a loading control.
Our research showed that TNF-α and IL-6 are two important inflammatory products in the bovine innate immune response to L-LPS stimulation. In order to assess the inhibitory effect of BMAP-28 on L-LPS-induced cytokine production in BFF_NCC1 cells, the cells were cultured with both L-LPS and BMAP-28 at 10 μg/mL for 6 hours (Figure 5). With the incubation of BMAP-28, enhancement of TNF-α and IL-6 was entirely inhibited compared to that of L-LPS-stimulated cells. When BMAP-28 was replaced with uBMAP-28, there was no effect on TNF-α and IL-6 mRNA expression induced by L-LPS.
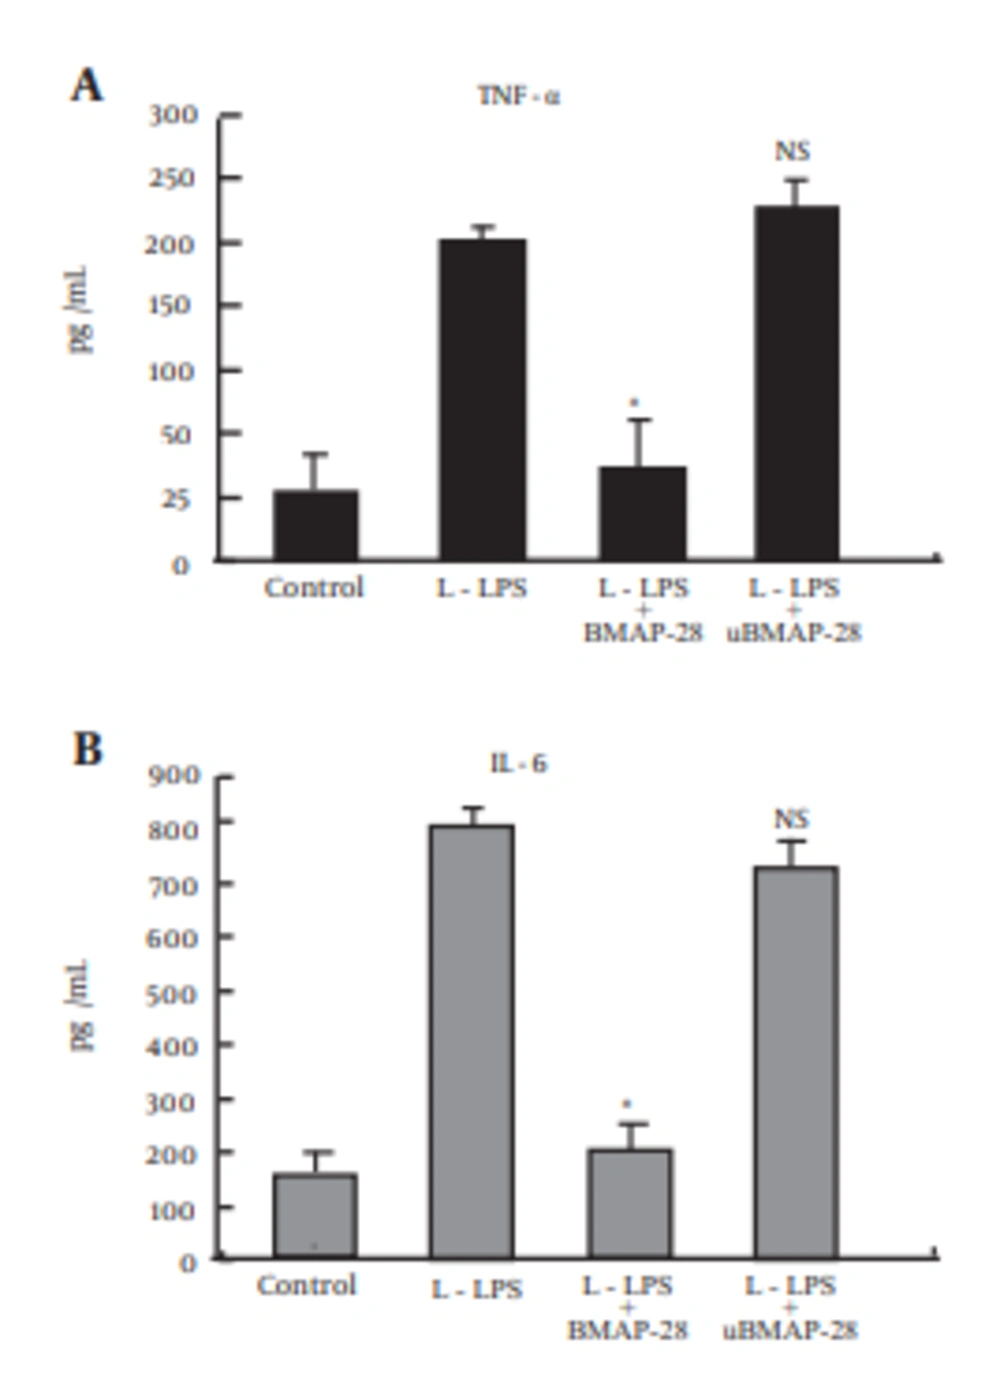
Figure 5.
Cells were incubated with 10.0 µg/mL of L-LPS alone or with 10.0 µg/mL BMAP-28 or uBMAP-28 for 6 h. Statistical analyses were performed between cells stimulated by L-LPS alone or with peptides and unstimulated cells. Asterisks indicate significant differences (* P < 0.05, ** P < 0.01). NS means no significant difference between L-LPS plus peptide groups and unstimulated ones.
To examine whether the cytokine inhibitory effect of BMAP-28 was related to TLR2, the TLR2 mRNA expression was tested (Figure 6). The up-regulation of TLR2 mRNA was completely inhibited by BMAP-28 compared to that of L-LPS stimulated cells. There was no effect on the L-LPS-induced TLR2 mRNA expression by replacing BMAP-28 with uBMAP-28.
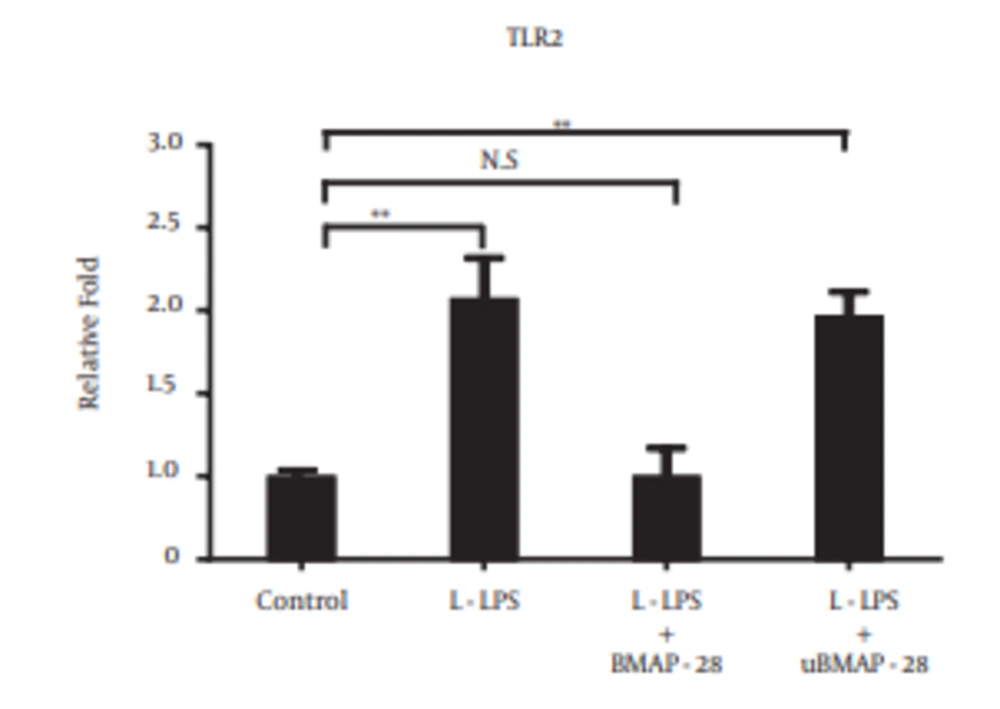
Figure 6.
Cells were incubated with 10.0 µg/mL of L-LPS alone or with L-LPS plus BMAP-28 (10.0 µg/mL) or uBMAP-28 (10.0 µg/mL) for 6 hours. Statistical analyses were performed between cells stimulated by L-LPS alone or with BMAP-28 and unstimulated cells. Asterisks indicate significant differences (* P < 0.05, ** P < 0.01). NS means no significant difference between L-LPS plus BMAP-28 and unstimulated ones.
5. Discussion
In this study, the bovine cellular immune response to L-LPS was examined. We found that there was rapid up-regulation of proinflammatory cytokines at low concentrations of L-LPS stimulation in BFF_NCC1 cells. In previous studies, LPS from Leptospira species had a specific immune response, which was recognized by TLR2 in human monocytes, TLR2 in pig fibroblasts, and both TLR2 and TLR4 in mouse macrophages (10, 20). To elucidate whether TLR2 plays an important role in the activation response of L-LPS in bovine cells, in the present study, BFF_NCC1 cells were used as a cell model based on certain characteristics (high expression level of TLR2 and lack of TLR4 mRNA expression). By analyzing TLR2 expression on BFF_NCC1 cells after L-LPS stimulation, we found that the expression levels of TLR2 mRNA and protein increased rapidly even at the low dose of L-LPS. These results indicated that TLR2 could be the major cell membrane receptor in the bovine innate immune response to Leptospira infection.
An earlier study reported that L-LPS has endotoxin-like activity similar to the LPS of Escherichia coli (4) Leptospira-infected hamsters showed massively high expression of cytokines in the kidneys (21). Patients with leptospirosis, which is associated with severe and fatal diseases, have a higher expression of IL-6, IL-8, and IL-1β (22). Previous studies indicated that the immune response to Leptospira could cause organ damage in Leptospira infections (23, 24). Moreover, due to the Jarisch-Herxheimer reaction that can occur with the antibiotic treatment of patients with leptospirosis (25, 26), new strategies are needed.
Antimicrobial peptides that reduce or prevent the presentation of LPS to its predominant receptors can be applied to ease the immunological response to sepsis caused by Gram-negative bacteria (27, 28). Therefore, BMAP-28’s inhibitory effect on Leptospira infections was tested at the cellular level, and we found that it is capable of inhibiting L-LPS-induced cellular cytokine release in BFF_NCC1 cells, which was supported by earlier research (28). In this study, we also determined that BMAP-28 could mediate TLR2 expression, leading to inhibition of the proinflammatory cytokine response (27). This gives us an alternative approach to reducing the occurrence of antibiotic-triggered endotoxin shock.
In summary, these results indicate that TLR2 is the predominant function in bovine innate immunity during Leptospira infections. Furthermore, we found that BMAP-28 can prevent L-LPS-induced TLR2 and cytokine expression in bovine cells. The strategy of using BMAP-28 may provide useful information for the development of novel anti-infective and immunomodulatory agents.