
1. Background
Water hyacinth (Eichhornia crassipes), belonging to the family of Pontederiaceae, is a wild freshwater fern. This plant is native to South America but has been naturalized in many tropical and subtropical regions of the world. Water hyacinth is considered the world’s most rapidly growing and spreading aquatic plant with congested growth, which is also a source of biomass. It is a species with a great ornamental value, used in gardening because of the beauty of its foliage and flowers, but at the same time, water hyacinth is the most important aquatic weed of the world as well (1).
At the first glance, when researchers from Guilan University, Iran, observed water hyacinth in their research tour in Aynak lagoon, it was considered a threat because of its aggressive expanding on water, leading to the disappearing of native vegetation, decreasing of water transfer capacity, and also fishing restrictions. The plant was even introduced as a toxic bioterrorism agent. However, the plant’s beauty of flowers led to its fast spread across Guilan province as a decorative plant (2). Although water hyacinth is often seen as a weed responsible for serious problems in navigation, irrigation, and power generation, several unique properties advocate useful applications for the plant. For example, the plant is efficient in removing toxic metals from water (3). If the chemical composition and nutritive value of E. crassipes can be explored, farmers can utilize this plant as an unconventional feed for their livestock to minimize feed costs and maximize production (4).
Water hyacinth is a source of chemicals with medicinal functions (5-7). The leaf extract of this plant contains flavonoids, alkaloids, tannins, and phenols, which have biological activities such as antiviral, antifungal, antitumor, and antibacterial effects (8-10). In addition, water hyacinth is rich in oxidative enzymes and non-enzymatic antioxidant systems (6), as well as wound healing effects and anticancer activities (8). The antioxidative properties of E. crassipes make this plant an alternative and convenient source of antioxidants (11).
Medicinal plants are rich resources of different bioactive compounds that can be used to treat several diseases by modulating various enzymes (12, 13). Plant-derived products have been used as disease controlling agents and reported to have less toxicity and fewer unwanted effects on the environment. An alternative approach for identifying new and innovative medicinal products is to search for such agents with antimicrobial and antifungal activities in medicinal plants, as well as in common weeds, which are also sources for several antimicrobial and antifungal compounds (14, 15).
2. Objectives
Many studies have already investigated the chemical composition of water hyacinth growing all over the world. There is evidence that the biosynthesis patterns of secondary metabolites in different populations of a single plant species can vary in different geographical regions and in response to environmental changes (16). Despite this, there is no information regarding the phytochemical structure of the water hyacinth species growing in West Asia. Therefore, in pursuing our research on water hyacinth (17, 18), we aimed to discover the chemical composition and nutrients of the water hyacinth growing in the Guilan province of Iran. We also determined the antioxidant and antimicrobial activities of the hydro-methanolic and aqueous extracts of the plant.
3. Methods
3.1. Chemicals
Methanol and ethanol (technical grade, purified by distillation) were used for the extraction procedure and total flavonoid determination, respectively. Acetonitrile (high-performance liquid chromatography (HPLC) grade), trifluoroacetic acid, and the Folin Ciocalteu reagent were purchased from Merck Co. (Germany). Phenolic compounds (gallic acid, catechin, chlorogenic acid, vanillic acid, P- coumaric acid, ferulic acid, rutin, and quercetin, as well as the Fe3+- 2,4,6-tri (2-pyridyl)-s-triazine (TPTZ) complex, FeCl3.6H2O, FeSO4.7H2O, aluminum chloride, potassium acetate, and sodium carbonate were purchased from the Sigma Chemical Co. (St. Louis, MO, USA). The standard strains of Staphylococcus aureus, Escherichia coli, Pseudomonas aeruginosa, Aeromonas hydrophila, and Streptococcus iniae were also provided by the Iranian Research Organization for Science and Technology and the Microbiology Research Laboratory of Guilan University (Table 1).
Table 1.
The Specifications of the Organisms Studied
| Microbial Species | Source | Gram |
|---|---|---|
| Staphylococcus aureus | 6538. Iranian Research Organization for Science and Technology | Positive cocci |
| Escherichia coli | 8739. Iranian Research Organization for Science and Technology | Negative coccobacilli |
| Pseudomonas aeruginosa | 9027. Iranian Research Organization for Science and Technology | Negative coccobacilli |
| Aeromonas hydrophila | 7966. Guilan University microbiology lab | Negative bacilli |
| Streptococcus iniae | 29177. Guilan University microbiology lab | Positive cocci |
3.2. Plant Materials
The leaves of E. crassipes were collected from Anzali lagoon, in the Caspian Sea near Bandar-e-Anzali, the northern Iranian province of Guilan, in Oct 2016 and identified in the Faculty of Natural Resources of Guilan University.
3.3. Extraction and Isolation
The leaves of the plant were dried at room temperature and ground into a fine powder with the particle mesh size of 1-mm using a mechanical grinder. Two parts (10 g each) of the powdered plant were extracted at room temperature using the maceration procedure using two solvents: purified water (3 × 100 mL) and analytical grade methanol 80% (3 × 100 mL). The extracts of each solvent were combined and allowed to evaporate and dry under reducing pressure at 45°C to obtain less solventaqueous and hydro-methanolic extracts. The yield of extraction was calculated as 1.2 and 2.9% for the aqueous and hydro-methanolic extracts, respectively.
3.4. Chemical Analyses
Chemical analyses of E. crassipes were carried out in triplicate to determine total ash, humidity, crude protein, crude fat, crude fiber, and crude carbohydrate contents. The total ash content of the plant was measured utilizing an electrical furnace (Heraeus K1252 muffle furnace) at 550°C for five hours. A Binder oven (WTB Binder- Drying oven in Barneveld, the Netherlands) was used to measure the humidity of the plant at 150°C for 12 hours. Protein content was determined using Kjeltec TM 2300 Analyzer (FOSS, Hilleroed, Denmark). Crude fat was determined using a soxtec 1043 system. Crude fiber and carbohydrate contents were also estimated using an enzymatic-gravimetric AOAC method by measuring the loss in ignition of dried lipid-free residues after digestion with 1.25% H2SO4 and 1.25% NaOH in a Fiber cap 2021/2023 system (Foss Tecator, Sweden) (19).
3.5. Determination of Total Phenolic Content
The concentrations of phenolic compounds in the plant extracts were determined using the spectrophotometric Folin Ciocalteu method (20). Crude extracts were prepared at the concentration of 10 mg. mL-1 in water. The reaction mixture was prepared by mixing 0.1 mL of the extracts, 0.1 mL of 50% the Folin Ciocalteu reagent dissolved in water, 2 mL of 2% NaHCO3, and 2.8 mL of distilled water. Then, the samples were incubated at 25°C for 30 min, and absorbance was measured at 750 nm. Each analysis was performed in triplicate. Gallic acid was used to draw a standard curve, and based on the sample’s absorbance, the concentration of phenolic compounds was expressed as gallic acid equivalent (mg of GA/g of extract).
3.6. Determination of Total Flavonoid Content
Total flavonoid content was determined by the aluminum chloride colorimetric method, with slight modifications (21). For this purpose, aliquots were prepared by dissolving 10 mg of the extracts in 5 mL deionized water. Then 0.5 mL of the prepared extracts was mixed with 1.5 mL of EtOH 95%, 100 µL of AlCl3 (10%), 100 µL of 1M potassium acetate, and 2.8 mL deionized water, followed by incubation at room temperature for 40 min. After that, absorbance was read at 415 nm. Quercetin was used as a standard. Total flavonoid content was expressed as mg quercetin equivalents/g dry mass. The experiment was performed in triplicate for both extracts.
3.7. Quantification of Phenolic Compounds by HPLC Analysis
Eight phenolic compounds, including gallic acid, catechin, chlorogenic acid, vanillic acid, P- coumaric acid, ferulic acid, rutin, and quercetin, were quantified using a Knauer HPLC system and a SunFire C18 column (250 mm × 4.6 mm, 5 µm), applying the Knauer photodiode array detector (PDA; K-2800 model). Injection was performed through a 3900 Smartline autosampler injector equipped with a loop (100 µL). The quantification of phenolic compounds was performed based on an optimized HPLC method described by Alirezalu et al., (22) with some modifications. The effects of different parameters, including the mobile phase, column, flow rate, and solvent ratio, were assessed to optimize chromatographic conditions. According to the results obtained, the column was eluted at a flow rate of 0.5 mL/min with water + 0.02% trifluoroacetic acid (solvent A) and acetonitrile + 0.02% trifluoroacetic acid (solvent B); the following gradient was set as: 0 - 20 min, from 20% B to 40% B; 20 - 40 min, 40% B; 40 - 42 min, from 40% B to 100% B; 42 - 48 min, 100% B; 48 - 50 min, from 100% B to 20% B (i.e., return to the initial condition), and 50 - 55 min; 20% B.. The temperature of the column was kept at 25°C. Chromatograms were recorded at four different wavelengths, including 254, 273, 310, and 326 nm (according to the λmax of the evaluated compounds), with a run time of 55 min. Data acquisition and integration were performed by EZChrome Elite software. The quantification of phenolic compounds was performed based on calibration via standards and peak-area measurements. For drawing calibration curves, the standard of each phenolic compound was weighed accurately (1 mg) and dissolved in 1 mL of MeOH (HPLC grade) to prepare a stock solution. The stock solutions were then diluted by MeOH to obtain a series of concentrations. Next, 20 μL of each solution was injected into the HPLC device. Based on the standard solutions, mean areas (n = 3) were determined and plotted against the concentration to develop calibration equations (23, 24).
3.8. Evaluation of Antioxidant Activity
The antioxidant capacity of the extracts was spectrophotometrically estimated following the procedure of Benzie and Strain (25). This method is based on reducing the colorless Fe3+- 2,4,6-tri (2-pyridyl)-s-triazine (TPTZ) complex to the blue colored Fe2+-tripyridyltriazine complex by the action of electron donating antioxidants at low pH. The FRAP reagent was prepared as a solution containing 25 mL of 300 mM acetate buffer (pH = 3.6), 2.5 mL of 10 mM TPTZ solution in 40 mM HCl, and 2.5 mL of 20 mM FeCl3.6H2O. To determine antioxidant capacity, 100 µL of the extract solutions was mixed with 3.0 mL of freshly prepared FRAP reagent and incubated at 37°C for 10 min. Absorbance was recorded at 593 nm against a blank sample containing 100 µL of the solvent. The FRAP value was calculated from the calibration curve prepared according to FeSO4.7H2O standard solutions and expressed as mmol Fe++/g dry weight.
3.9. Antimicrobial Assays
The antimicrobial activity of the extracts was evaluated by measuring bacterial growth inhibition zones by the well-diffusion method, as described by the Clinical Laboratory Standard Institute (CLSI) (26), against five standard strains, including S. aureus, E. coli, P. aeruginosa, A. hydrophila, and S. iniae. Briefly, 0.1 mL of the diluted inoculum (105 CFU/mL) of the test strains was swabbed on nutrient agar in plates. Wells with a 6-mm diameter were punched into the agar surface via a sterile cork borer. According to our previous study (27), 50 µL of the plant extracts in a serial dilution of 5, 20, 100, and 400 mg.mL-1 was added to the wells created in the plates. The plates were incubated at 37°C for 24 hr. Antibacterial activity was determined by measuring the diameter of the zone of inhibition (ZOI) surrounding wells. Chloramphenicol standard antibiotic disc was used as the positive control, and the wells containing 20 µL DMSO were used as the negative control.
The broth microdilution method was also carried out to determine the minimum inhibitory concentration (MIC) of the extracts according to the standard protocol recommended by Eloff (28). In brief, a serial dilution of each extract was prepared in a concentration range of 32 to 1024 mg. mL-1 in sterile 96 wells containing Mueller-Hinton broth medium, using DMSO as the solvent of the extracts at a final concentration of lower than 1% (v/v). Suspensions from the test strains were prepared from freshly cultured microorganisms in sterile normal saline, adjusted to the turbidity of 0.5 McFarland standard. The suspensions were further diluted (1: 100) by the mentioned sterile broth medium and then added to the trays containing a serial dilution of the extracts and 0.5 × 10⁶ CFU/mL bacteria per well. The trays containing serial dilutions were incubated at 37°C for 24 h. The incubation of aquatic strains was performed at 28°C. Finally, MIC values were recorded as the lowest concentrations that could inhibit the visible growth of microorganisms. The resazurine reagent was used for the extracts forming turbidity after being dissolved to characterize growth from no-growth wells. For determining the minimum bactericidal concentration (MBC), 100 µL of each no-growth well identified in MIC determination experiments was cultured in Mueller Hinton Broth, and MBC values, as the lowest concentration killing 99.9% of the microorganism tested, were recorded after 24 h of incubation at 37°C. Each experiment was conducted in triplicate.
3.10. Statistical Analysis
All experiments were carried out in triplicate. The results obtained were expressed as average ± standard error of mean. The Shapiro-Wilk test was used to evaluate the normality of the data. The data were analyzed in SPSS 16.0 software by the independent t-test. Pearson correlation coefficient was utilized to investigate the correlation of antioxidant activity with the total phenol and flavonoid contents of the plant.
4. Results
In the present study, the nutritional and phytochemical constituents of water hyacinth were investigated. The values of dry mass, total ash, nitrogen-free extract, crude protein, ether extract, and crude fiber were obtained 9.4, 12.9, 49.9, 24, 1.7, and 11.5%, respectively (Table 2).
Table 2.
The Chemical Analysis of Water Hyacinths
| Parameters | Percent (Based on DM) |
|---|---|
| Dry matter | 9.4 |
| Crude protein | 24 |
| Ether extract | 1.7 |
| Crude fiber | 11.5 |
| Ash | 12.9 |
| Nitrogen free extract | 49.9 |
The aqueous and hydro-methanolic extracts of E. crassipes were used to investigate the phytochemical constituents of the plant. The yields of extraction were 12 and 29% for the hydro-methanolic and aqueous extracts, respectively. The total phenol contents of the hydro-methanolic and aqueous extracts, expressed as gallic acid equivalent, were 491.2 ± 31.9 and 258.3 ± 10.8 mg gallic acid equivalents/g of dried extract, respectively. The total flavonoid contents of the hydro-methanolic and aqueous extracts expressed as mg quercetin equivalents/g of dried extracts, were 76.8 ± 7.8 and 46.1 ± 6, respectively, showing a significant difference.
The amounts of seven phenolic compounds, including gallic acid, catechin, chlorogenic acid, vanillic acid, p-coumaric acid, ferulic acid, rutin, and quercetin, were simultaneously analyzed by HPLC. The UV patterns of standard analyses were compared with those related to the two extracts of water hyacinth. In addition, spiking of each standard phenolic to the extracts was applied to exactly assign the signal of phenolics in the HPLC chromatograms. The HPLC chromatograms of standard phenolic compounds have been shown in Figure 1, indicating an appropriate resolution for different signals. In addition, the HPLC chromatograms of the aqueous (A) and hydro-methanolic (B) extracts have been indicated in Figure 2. In this regard, three compounds (rutin, quercetin, and vanillic acid) were quantified at 254 nm; gallic acid and catechin were measured at 273 nm; p-coumaric acid was analyzed at 310 nm, and finally, ferulic acid and chlorogenic acid were assessed at 326 nm. Figure 3 reveals the overlayed UV-visible spectra of the evaluated compounds in the extracts and standard samples. A good agreement was observed between the spectra of the standards and those related to the extracts’ constituents, confirming the peak purity and accurate identification of each signal. Table 3 summarizes the contents of phenolic compounds in the hydro-methanolic and aqueous extracts analyzed in this study. Ferulic acid was found to be the most abundant phenolic compound in both the hydro-methanolic and aqueous extracts (2.28 and 2.54 and mg/g of dried matter, respectively), showing a slightly higher value in the aqueous extract. Other phenolic contents had significantly variable quantities in the two extracts (Table 3). Chlorogenic acid and quercetin were two other major phenolic compounds of the aqueous extract (0.81 and 0.55 mg/g of dried matter, respectively). In the hydro-methanolic extract, quercetin, catechin, and gallic acid were found as other main phenolic compounds with the values of 1.31, 0.7, and 0.62 mg/g, respectively.
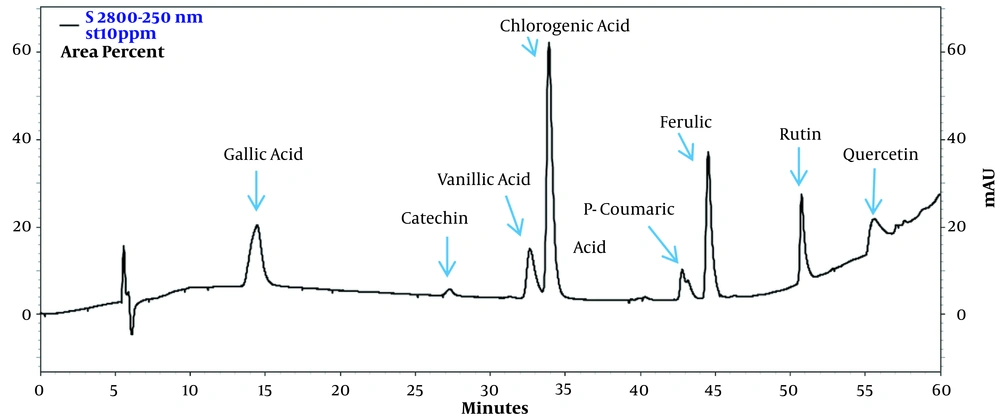
Figure 1.
The HPLC chromatograms of standard phenolic compounds
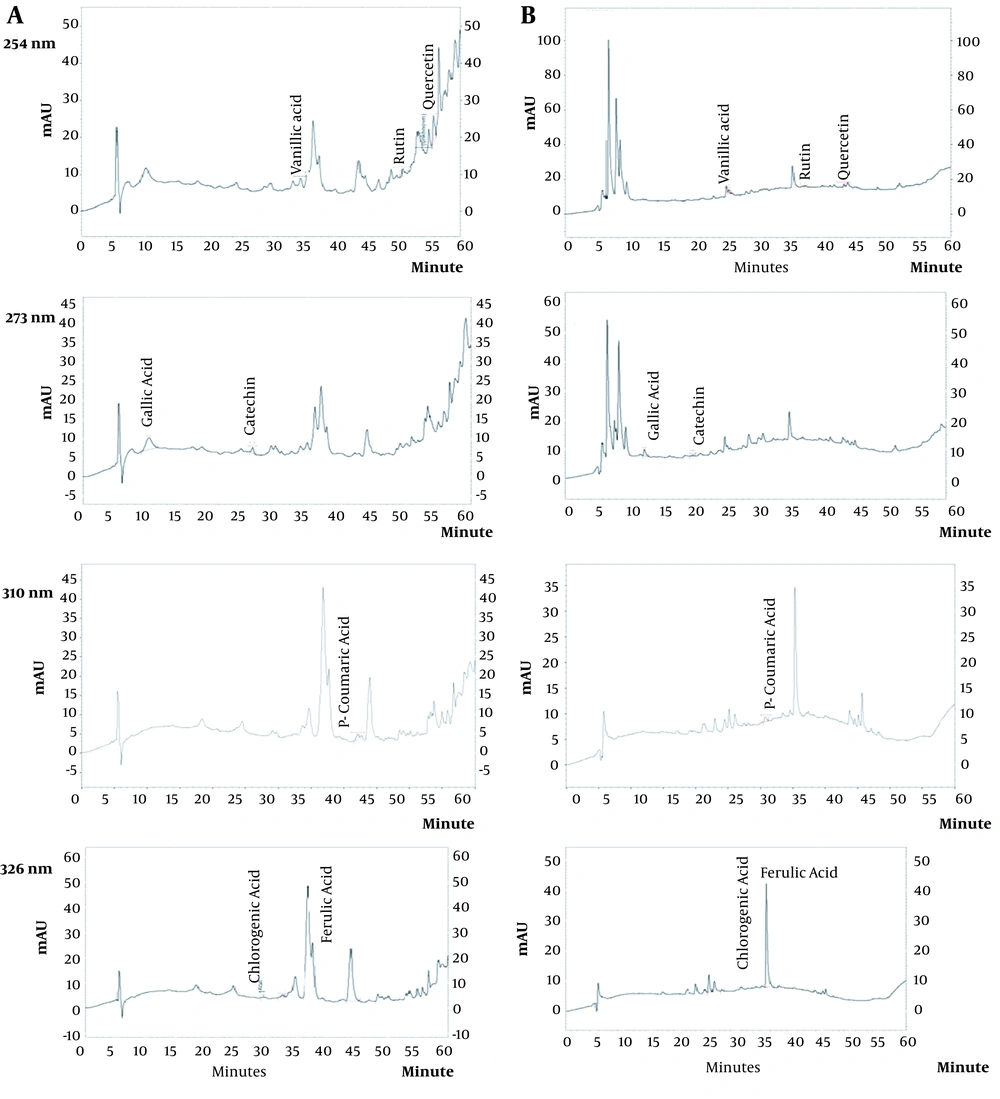
Figure 2.
The HPLC chromatograms of both the aqueous (A, right) and hydro-methanolic (B, left) extracts at four evaluated wavelengths.
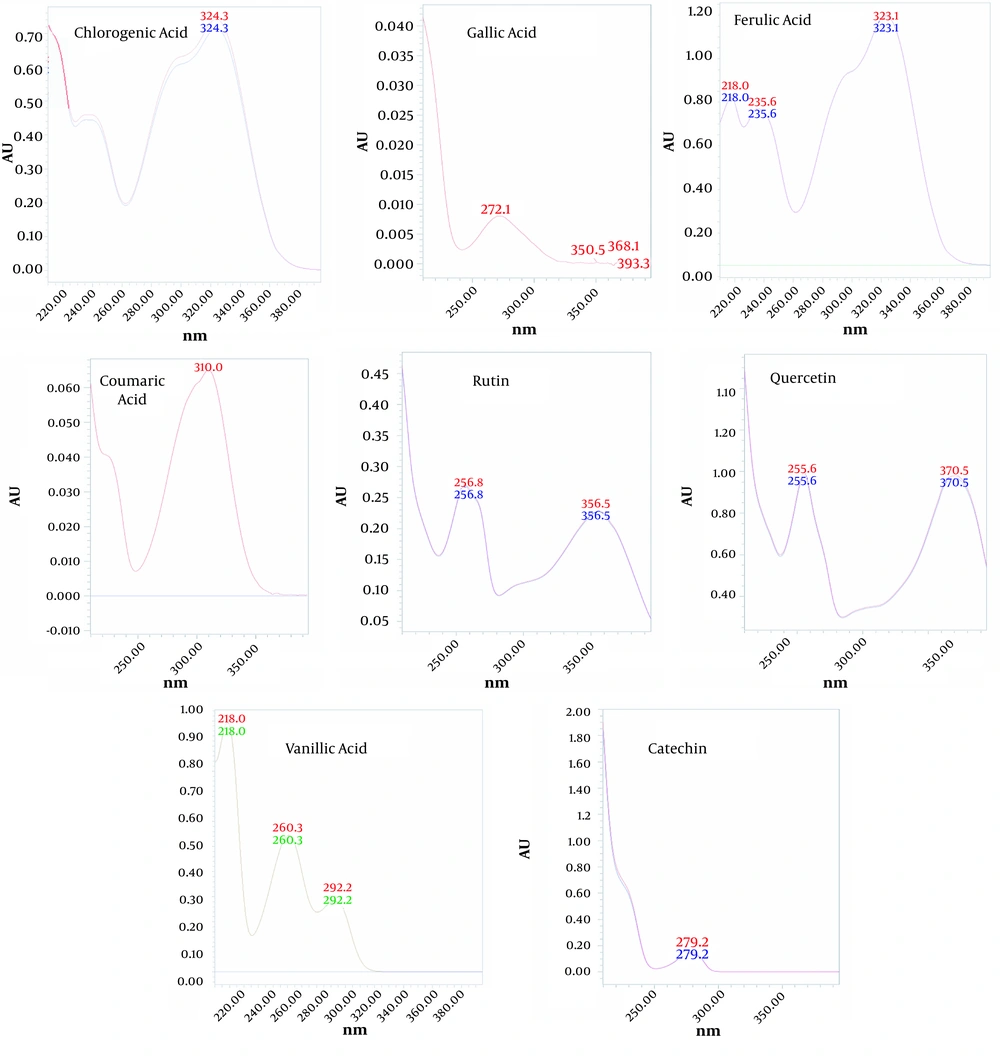
Figure 3.
The overlayed UV-visible spectra of the phenolic compounds quantified in the plant extracts and standard samples.
| Phenolic Compounds | Aqueous Extract | Hydro-Methanolic Extract |
|---|---|---|
| mg/g of Dried Mass | ||
| Gallic acid | 0.260 ± 0.010 A | 0.620 ± 0.010 B |
| Catechin | 0.270 ± 0.005 A | 0.700 ± 0.004 B |
| Chlorogenic acid | 0.810 ± 0.005 B | 0.230 ± 0.030 A |
| Vanillic acid | 0.120 ± 0.005 A | 0.210 ± 0.004 B |
| p- coumaric acid | 0.120 ± 0.020 A | 0.100 ± 0.009 A |
| Ferulic acid | 2.540 ± 0.020 B | 2.280 ± 0.010 A |
| Rutin | 0.150 ± 0.020 A | 0.320 ± 0.010 B |
| Quercetin | 0.550 ± 0.000 A | 1.310 ± 0.010 B |
a Values are expressed as mean ± SE.
b Data in the same row with different capital letters (A – B) show significant differences (P < 0.05).
In the present research, FRAP, as a commonly accepted assay, was used to evaluate the antioxidant activity of the extracts. This assay was selected considering the fact that the antioxidant activity of plant derivatives depends on their reducing capacity (29). The FRAP values were obtained as 221.52 and 97.07 mg ascorbic acid equivalent/g of dry weight of the hydro-methanolic and aqueous extracts, respectively.
Pearson correlation coefficients were used to investigate the possible correlation between the antioxidant activity and phytochemical constituents of the extracts analyzed (Table 4). In both extracts, antioxidant activity significantly correlated with the total phenolic (P = 0.01) and total flavonoid (P < 0.05) contents.
Table 4.
The Correlation Between Total Phenol and Total Flavonoid Contents and Antioxidant Activity
| Antioxidant Activity | Total Phenols | Total Flavonoids | ||
|---|---|---|---|---|
| Hydro-Methanolic | Aqueous | Hydro-Methanolic | Aqueous | |
| P value | 0.014 | 0 | 0.018 | 0.003 |
| R | 0.9 a | 0.99 b | 0.889 a | 0.959 b |
a Significant at P < 0.05.
b Significant at P < 0.01.
The antibacterial activity of the aqueous and hydro-methanolic extracts was investigated using the agar well-diffusion assay against five standard strains, including E. coli, S. aureus, and P. aeruginosa, as well as two aquatic pathogens (i.e., A. hydrophila, and S. iniae) for the first time. Table 5 indicates the diameter of the zone of inhibition for the extracts at different concentrations against the five bacterial strains. According to the results obtained, the aqueous extract was the most active against E. coli with an inhibition zone of 15.3 mm at the concentration of 400 mg/mL. At the same concentration, the antibacterial activity of the methanolic extract was the highest against S. iniae, with an inhibition zone of 12.3 mm.
Table 5.
| Microorganisms | Inhibition Zone Diameter | Control | ||||||||
|---|---|---|---|---|---|---|---|---|---|---|
| Aqueous Extract (mg/mL) | Hydro-Methanolic Extract (mg/mL) | Negative c | Positive d | |||||||
| 5 | 20 | 100 | 400 | 5 | 20 | 100 | 400 | (-) | (+) | |
| Escherichia coli | 8.0 ± 0.5 E | 9.0 ± 0.5 D | 11.6 ± 0.3 C | 15.3 ± 1.0 B | 6.0 ± 0.0 | 7.0 ± 0.5 D | 9.6 ± 0.3 C | 11.6 ± 0.3 B | 6.0 ± 0.0 | 22.0 ± 0.0 A |
| Staphylococcus aureus | 6.0 ± 0.0 | 4.0 ± 0.5 D | 10.3 ± 0.6 C | 11.0 ± 1.0 B | 7.0 ± 0.3 E | 8.0 ± 0.6 D | 11.0 ± 0.5 C | 11.3 ± 0.3 B | 6.0 ± 0.0 | 25.0 ± 0.0 A |
| Pseudomonas aeruginosa | 6.0 ± 0.0 | 6.0 ± 0.0 | 6.0 ± 0.0 | 9.6 ± 0.3 A | 6.0 ± 0.0 | 6.0 ± 0.0 | 6.0 ± 0.0 | 10.3 ± 0.6 A | 6.0 ± 0.0 | 11.0 ± 0.0 A |
| Aeromonas hydrophila | 6.0 ± 0.0 | 6.0 ± 0.0 | 8.3 ± 1.0 C | 11.3 ± 2.0 B | 6.0 ± 0.0 | 6.0 ± 0.0 | 10.0 ± 1.0 C | 11.6 ± 0.3 B | 6.0 ± 0.0 | 30.0 ± 0.0 A |
| Streptococcus iniae | 6.0 ± 0.0 | 6.0 ± 0.0 | 9.3 ± 0.3 C | 10.6 ± 0.3 B | 8.0 ± 0.5 E | 10.0 ± 1.0 C | 9.0 ± 0.5 C | 12.3 ± 0.6 B | 6.0 ± 0.0 | 25.0 ± 0.0 A |
a Values are expressed as mean ± SE.
b Data in the same row with different capital letters (A – E) show significant differences (P < 0.05).
c Standard antibiotic discs (30 µg/mL).
d DMSO.
The aqueous extract showed the highest antibacterial activity, with the MIC and MBC values of 64 and 128 mg.mL-1, against E. coli. Furthermore, the methanolic extract delivered the best antibacterial activity against S. iniae with the MIC and MBC values of 64 and 128 mg/mL, respectively. The most significant antibacterial resistance was observed for P. aeruginosa in exposure to both extracts with the MIC and MBC values of 256 and 512 mg/mL, respectively. Regarding the two other strains tested (i.e., A. hydrophila and S. aureus), both the extracts showed moderate antibacterial activity as indicated by respective MIC and MBC values (Table 6).
Table 6.
The MBC and MIC Values of the Hydro-Methanolic and Aqueous Extracts of Eichhornia crassipes Against the Microorganisms Tested
| Extracts | Yield (%) | Microorganism | MIC (mg/mL) | MBC (mg/mL) |
|---|---|---|---|---|
| Hydro-Methanolic | 12 | Escherichia coli | 128 | 256 |
| Staphylococcus aureus | 128 | 256 | ||
| Pseudomonas aeruginosa | > 256 | 512 | ||
| Aeromonas hydrophila | 256 | > 256 | ||
| Streptococcus iniae | 64 | 128 | ||
| Aqueous | 29 | Escherichia coli | 64 | 128 |
| Staphylococcus aureus | 128 | 256 | ||
| Pseudomonas aeruginosa | > 256 | 512 | ||
| Aeromonas hydrophila | 256 | 512 | ||
| Streptococcus iniae | 128 | 256 |
5. Discussion
The plant species studied (water hyacinth) had a high value of crude protein compared to other plants; however, its crude fiber content was lower compared to previously reported values. These variations can be due to different environmental and growing conditions. The contents of other constituents were in well agreement with previously reported values (30-32).
The total phenol and total flavonoid contents of plant extracts partly depend on the polarity of the solvent used in extraction. The high solubility of phenols and flavonoids in polar solvents leads to a high extraction yield for these compounds (33). In the present experiment, the aerial parts of the plant were extracted using two polar solvents (distilled water and hydro-methanol). According to the results obtained, the total phenol and flavonoid contents of the hydro-methanolic extract were higher compared with the aqueous extract. Similar findings were reported by Ho et al. and Rorong et al. (9, 34, 35).
Phenolic compounds are well-known for their potent antioxidant properties and are commonly found in fruits, vegetables, and herbs (36, 37). So, the high antioxidant activity of the hydro-methanolic extract in this research can be attributed to its high amounts of polyphenols and flavonoids. Gallic acid and quercetin, as powerful natural antioxidants, were identified in the plant extracts assessed in the present study. The ability of gallic acid to form hybrid compounds with other phenols such as caffeic acid increases its antioxidant properties (38). In addition, quercetin has been shown to have a more potent antioxidant activity than aglycone-binding flavonoids such as rutin due to the lack of an aglycon site in its structure (39). In this study, HPLC analysis showed a high amount of quercetin in the hydroalcoholic extract of water hyacinth (1.31 mg/g dry extract). However, quercetin had a low concentration in the aqueous extract. So, it is possible that the higher In addition, spiking of each standard phenolic to the extracts was applied to exactly assign the signal of phenolics in the HPLC chromatgrams. Power of the hydro-alcoholic extract compared to the aqueous extract can be due to the higher concentration of this flavonoid. Rutin, in synergism with other antioxidants, has shown the ability to eliminate free radicals and augment protection against fat oxidation (40).
Regarding the phenolic compounds of water hyacinth observed in the present study, a similar profile has also been reported in other studies (9, 41). However, there is limited information concerning the quantity of phenolic compounds in water hyacinth. In the only research that we found on water hyacinth (42), the content of quercetin, chlorogenic acid, and catechin was estimated to be zero, which is in contrast to our results. These contradictory results may be due to different extraction methods or the effects of ecological parameters (43). Further research is required to accurately quantify and qualify the secondary metabolites of water hyacinth (5, 41). Polyphenol and flavonoid contents of the aqueous and methanolic extracts of 31 marsh medicinal plants were measured in a study in Taiwan, indicating the predominance of phenolic compounds in the aqueous extracts of most of the plants. However, in water hyacinth, the amounts of total phenols and flavonoids were higher in the methanolic than in aqueous extract (34).
Many researchers have also evaluated the antimicrobial activities of various plant extracts. In one study, the methanolic extract of water hyacinth significantly reduced the growth of Aspergillus niger (44). A significant antimicrobial activity was reported for the ethanolic, methanolic, and aqueous extracts of the roots and leaves of water hyacinth against different bacterial and fungal strains. Among these, the aqueous extract showed a more potent activity, and also, leaves delivered a higher antimicrobial activity than roots (45). Likewise, water hyacinth extract was reported to have activity against S. aureus, E. coli, Penicillium, and A. niger; however, this activity depended on pH, concentration, and duration of exposure (46). The antimicrobial properties of polyphenols have been widely evaluated and confirmed in previous reports (47, 48). Although the mechanisms of the antibacterial actions of phenolic compounds are not yet fully deciphered, polyphenols have been suggested to exert their antibacterial effects via either direct killing of bacteria, the synergistic activation of antibiotics, and attenuation of the pathogenicity of bacteria (49). More importantly, flavonoids have been shown to inactivate efflux pumps, destabilize cytoplasmic membrane, and inhibit β-lactamases and topoisomerase and, in this way, prevent the development of antibiotic resistance in bacteria (48). Nevertheless, the antibacterial effects of polyphenols, in addition to the type of polyphenol, can also be influenced by other factors. For instance, the same polyphenol may be effective against one Gram-positive (or Gram-negative) strain and ineffective against the other, indicating strain-dependent effects.
5.1. Conclusion
The present study revealed high amounts of biologically active phenols and flavonoids in the hydro-methanolic extract of E. crassipes. The high content of polyphenols in this plant extract could justify its potent antioxidant activity. Our results suggest that E. crassipes can be beneficial as an antimicrobial agent, especially against Gram-negative bacteria, and an available natural source for antioxidants and antimicrobial agents.