
1. Background
Non-alcoholic fatty liver disease (NAFLD) is a common chronic liver disorder characterized by abnormal accumulation of fat in hepatocytes, typically exceeding 5 - 10% of liver weight, in the absence of secondary causes such as alcohol consumption or certain medications (1, 2). Non-alcoholic fatty liver disease affects more than 25% of people worldwide and may advance to more serious liver complications such as non-alcoholic steatohepatitis (NASH), fibrosis, cirrhosis, and hepatocellular carcinoma (3). While the precise molecular mechanisms leading to NAFLD are still not fully understood, it is considered a major complication of metabolic syndrome, with disturbances in lipid and glucose metabolism, including lipogenesis and gluconeogenesis, playing a central role in its pathogenesis (4, 5). Excessive intake of glucose and fructose promotes de novo lipogenesis (DNL), converting these sugars into fatty acids and triglycerides (6). When the liver’s β-oxidation capacity is exceeded, excessive fatty acids accumulate, resulting in hepatic steatosis, a hallmark of NAFLD (7, 8). This accumulation of fat in the liver accelerates the generation of reactive oxygen species (ROS) via the mitochondrial electron transport chain, contributing to oxidative stress (OS) and inflammation — key factors in NAFLD development (9). These processes highlight the importance of therapeutic approaches targeting both lipid accumulation and oxidative damage. Alanine aminotransferase (ALT) and aspartate aminotransferase (AST) are liver enzymes commonly used as markers of hepatocellular injury, with elevated levels indicating liver damage. High-density lipoprotein cholesterol (HDLC) is considered protective against lipid accumulation and cardiovascular risk, while low-density lipoprotein cholesterol (LDLC) is associated with lipid deposition and metabolic disturbances. Together, these parameters provide essential information about liver function and lipid metabolism in conditions such as NASH (10, 11).
The peroxisome proliferator-activated receptor (PPAR) family consists of three isoforms: Peroxisome proliferator-activated receptor alpha (PPARα), PPARβ, and PPARγ (12, 13). These transcription factors, activated by specific ligands, are essential in controlling lipid metabolism and inflammatory processes (14). Peroxisome proliferator-activated receptors suppress the expression of pro-inflammatory cytokines, such as interleukin-1 beta (IL-1β) and transforming growth factor beta (TGF-β), making them promising targets for the treatment and prevention of NAFLD and related disorders (15, 16). Peroxisome proliferator-activated receptor alpha inhibits lipogenesis by repressing sterol regulatory element-binding protein 1c (SREBP1c) expression and promotes fatty acid oxidation through the upregulation of carnitine palmitoyltransferase 1 alpha (CPT-1a). Sterol regulatory element-binding protein 1c, an important transcription factor in fatty acid and triglyceride synthesis, also activates the expression of genes like acetyl-CoA carboxylase (ACC), contributing to the progression of hepatic steatosis (17, 18). Moreover, there is a known interaction between PPARγ and antioxidant defenses in the liver. Studies have shown that PPARγ can modulate the expression of genes involved in OS and inflammation, making PPARs a key focus in therapeutic strategies for NAFLD (18, 19).
Given these insights, agents that modulate lipid metabolism and inflammatory responses, such as fenofibrate and curcumin, have gained attention for their potential benefits in treating NAFLD (20, 21). Fenofibrate, a selective PPARα agonist, plays a role in enhancing fatty acid oxidation and improving lipid profiles. On the other hand, curcumin, a natural compound found in turmeric, is renowned for its potent antioxidant and anti-inflammatory properties (22, 23). The formulation of curcumin as nanocurcumin has significantly enhanced its bioavailability, making it a more effective therapeutic agent for treating liver diseases (24). Although several studies have examined the hepatoprotective effects of fenofibrate or curcumin separately, limited data are available regarding the comparative efficacy of nanocurcumin and fenofibrate in a diet-induced NASH model, particularly with respect to OS and lipid-metabolism–related gene expression. Furthermore, the specific impact of nanocurcumin on nicotinamide adenine dinucleotide phosphate (NADPH) oxidase (NOX) isoforms and key regulators such as PPARα, CPT-1α, ACC, and sterol regulatory element-binding protein 1c (SREBP-1c) has not been comprehensively addressed in previous studies. The present work aims to fill these gaps by providing a detailed molecular assessment of how nanocurcumin and fenofibrate modulate oxidative and metabolic pathways in NASH.
2. Objectives
This study aims to investigate the therapeutic effects of nanocurcumin and fenofibrate in a high-fat diet (HFD)-induced NASH rat model, with a particular focus on their ability to modulate OS, inflammation, and lipid metabolism. The objective is to determine whether these interventions can improve key pathological outcomes associated with NASH.
3. Methods
3.1. Materials and Reagents
Fenofibrate and curcumin were purchased from Sigma-Aldrich (USA). Nanocurcumin was formulated using Campritol 888 ATO, oleic acid, lecithin, and polyvinyl alcohol (PVA) (Merck, Germany). Biochemical, ROS, and RNA analyses were performed using commercial kits (Roche Diagnostics; KiaZist; Yekta Tajhiz). Western blot reagents and antibodies were obtained from Amersham (USA). Analytical instruments included Fourier-transform infrared spectroscopy (FTIR) (Bruker), transmission electron microscopy (TEM) (ZEISS), and Malvern nanosizer systems.
3.2. High-fat Emulsion and Treatments
Non-alcoholic fatty liver disease was induced in rats using a high-fat emulsion (HF) as previously described by Zou et al. (25). The emulsion, composed of 77% fat, 9% carbohydrates, and 14% protein, was enriched with vital vitamins and minerals. It was kept refrigerated at 4°C and heated to 42°C in a water bath before being administered.
3.3. Study Design
A total of 40 male Wistar rats (180 - 200 g) were acclimatized for 7 days under controlled environmental conditions. After acclimatization, the rats were randomly assigned into two main categories:
1. Normal control (NC) group (n = 8): These rats received a standard diet throughout the study period and were orally administered 0.5% Na-CMC solution once daily. They did not receive a HFD.
2. HFD-induced NASH group (n = 32): These rats were fed a HFD; (77% fat, 9% carbohydrate, 14% protein) for 8 weeks to induce NAFLD/NASH.
After completion of the 8-week HFD induction period, the 32 HFD-fed rats were randomly divided into four treatment subgroups (n = 8 per group):
Group 1 (HF): Continued to receive HFD ad libitum without any therapeutic intervention.
Group 2 (fenofibrate): Received HFD plus fenofibrate [100 mg/kg/day (26)].
Group 3 (curcumin): Received HFD plus curcumin [100 mg/kg/day (27)].
Group 4 (nanocurcumin): Received HFD plus nanocurcumin (100 mg/kg/day 2).
All treatments were administered orally for 6 consecutive weeks. At the end of the treatment period, the animals were euthanized, and blood and liver samples were collected for biochemical, histological, and gene expression analyses.
3.4. Synthesis of Nanocurcumin (NC-SLN)
Nanocurcumin solid lipid nanoparticles (NC-SLNs) were synthesized using a modified hot-homogenization/ultrasonication method based on established protocols (28, 29). Briefly, curcumin (100 mg) was mixed with Compritol 888 ATO (200 mg) and melted at 75°C to form the lipid phase. The aqueous phase was prepared by dissolving oleic acid (0.25 g) and lecithin (0.5 g) in 10 mL deionized water at 80°C. The lipid phase was gradually added to the aqueous phase under stirring to form a pre-emulsion, followed by sonication for 5 min and homogenization with 1% polyvinyl alcohol (PVA) at 10,000 rpm for 10 min. The resulting nanoemulsion was centrifuged at 15,000 rpm for 25 min at 5°C, and the pellet was washed and lyophilized. Slight modifications included adjusted lipid/surfactant ratios and extended cooling time to improve encapsulation. The final yield was 87.4%, and lyophilized NC-SLNs remained stable for four weeks at 4°C with no visible aggregation or significant particle-size drift. In vitro drug release (phosphate-buffered saline (PBS) + 0.5% Tween 80, pH 7.4) showed an initial mild burst (≈18% in 6 h) followed by sustained release up to 72.5% over 48 h.
3.5. Characterization of Nanocurcumin (NC-SLN)
The physicochemical properties of NC-SLNs were evaluated using several analytical methods. Fourier-transform infrared spectroscopy (VERTEX 70v) was used to confirm curcumin incorporation and assess lipid-drug interactions. Morphology was examined by TEM (ZEISS LEO 906E). Particle size, zeta potential, and polydispersity index (PDI) were determined using a Malvern nanosizer. Encapsulation efficiency (EE%) and drug loading (DL%) were quantified via ultraviolet-visible (UV-Vis) spectrophotometry at 256 nm.
3.6. Biochemical Measurements
Biochemical analyses were conducted on freshly frozen serum samples. Serum lipoprotein levels (LDL-C and HDL-C) and liver enzymes (ALT and AST) were quantified using the Roche 6000 automated analyzer, along with the corresponding assay kits.
3.7. Analysis of Gene Expression
Total RNA was isolated from frozen liver samples using an RNA extraction kit according to the manufacturer’s protocol. Quantitative real-time polymerase chain reaction (PCR) was performed on the complementary DNA (cDNA) using an ABI StepOnePlus system. Glyceraldehyde 3-phosphate dehydrogenase (GAPDH) was used as an internal control for normalization. Gene expression was measured by the ΔCt method, and treatment effects were evaluated using the 2−ΔΔCt calculation.
3.8. Reactive Oxygen Species Assay
Reactive oxygen species levels in liver tissue were quantified using a commercial ferrous oxidation–xylenol orange (FOX) assay kit (ZellBio GmbH, Germany; ROS Assay Kit, Cat. No. ZB-ROS-96). In this method, hydroperoxides present in the sample oxidize Fe²⁺ to Fe³⁺, which subsequently forms a stable Fe³⁺ – xylenol orange complex detectable at 560 nm. The absorbance is proportional to total hydroperoxide content and is quantified using hydrogen peroxide (H₂O₂) standards, with results expressed as nmol H₂O₂ equivalents per mL.
3.9. Histopathological Analysis
Liver tissue samples were fixed in 10 - 12% formalin for 48 hours and then dehydrated through a graded ethanol series (70%, 80%, 90%, 95%, and 100%) before being embedded in paraffin. Thin slices, about 6 to 7 micrometers thick, were cut from paraffin-embedded tissue blocks and mounted onto glass slides. These sections underwent deparaffinization using xylene followed by a series of ethanol washes with decreasing concentrations. Subsequently, the slides were stained using hematoxylin and eosin (H&E) and analyzed under a light microscope to assess tissue pathology (30). All histopathological assessments and scoring were performed by an independent pathologist who was blinded to the treatment groups.
3.10. Western Blot Analysis
The protein levels of PPARα and SREBP-1c were determined by Western blot. Protein concentrations were measured using the Bradford method, and 30 µg of protein from each sample were loaded onto a 10% SDS-PAGE gel and then transferred to a polyvinylidene difluoride (PVDF) membrane. The membrane was blocked with skim milk and incubated overnight at 4°C with primary antibodies for PPARα and SREBP-1c. After washing with PBS, the membrane was incubated with horseradish peroxidase (HRP)-conjugated secondary antibody for 1 hour at room temperature. Protein bands were visualized using the enhanced chemiluminescence (ECL) Detection Kit (31).
3.11. Data Analysis
Statistical comparisons between the normal control and HFD groups were performed using the t-test. For analyses comparing multiple groups, one-way analysis of variance (ANOVA) with Tukey-Kramer post hoc test was used for comparisons. Results are expressed as mean ± standard deviation (SD), with P-values below 0.05 indicating statistical significance.
4. Results
4.1. Characterization and Drug Release of Nanocurcumin Solid Lipid Nanoparticles
Transmission electron microscopy imaging (Figure 1A and B) demonstrated that the nanocurcumin-loaded solid lipid nanoparticles (NC-SLNs) exhibited a smooth, nearly spherical morphology with an observed diameter of approximately 110 - 115 nm. Dynamic light scattering (DLS) analysis (Figure 1C) further confirmed a mean hydrodynamic size of 102 nm with a narrow distribution (PDI = 0.40 ± 0.04), indicating acceptable uniformity and colloidal stability. As expected, the hydrodynamic size obtained via DLS was slightly larger than the dry-state TEM measurements due to the hydration layer surrounding the nanoparticles. Zeta potential measurements (Figure 1E) indicated a surface charge of -27.7 mV, reflecting good electrostatic stability and a reduced tendency for particle aggregation. Encapsulation efficiency and DL% were calculated as 99.3% and 1.83%, respectively, confirming highly efficient entrapment of curcumin within the solid lipid matrix. Fourier-transform infrared spectroscopy analysis (Figure 1D) further verified successful encapsulation, as characteristic curcumin peaks were retained without major spectral shifts. Overall, these findings demonstrate that the prepared NC-SLNs possess appropriate size, stability, and loading characteristics for biological evaluation.
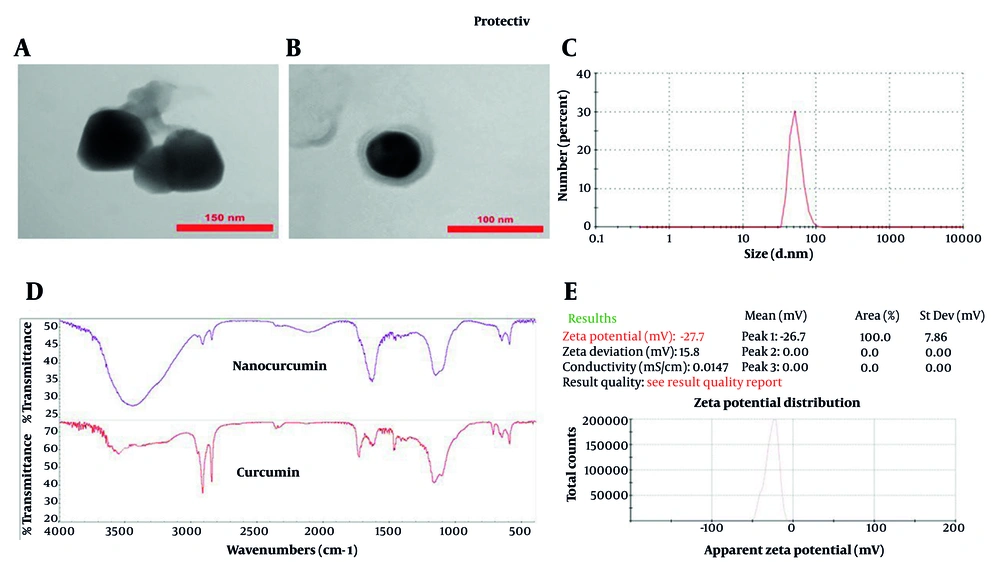
Figure 1.
A and B, Transmission electron microscopy (TEM) micrographs of nanocurcumin-loaded solid lipid nanoparticles (NC-SLNs), demonstrating spherical morphology and structural integrity. Magnification: A, ~70,000×; and B, ~100,000×. Scale bars: A, 150 nm; and B, 100 nm; C, size distribution of NC-SLNs measured by dynamic light scattering (DLS); D, fourier-transform infrared spectroscopy (FTIR) spectra of curcumin and nanocurcumin, confirming the interaction of curcumin with the lipid components and supporting its successful encapsulation, with no significant structural changes observed; E, zeta potential distribution of NC-SLNs.
4.2. Changes in Body Mass and Liver Index
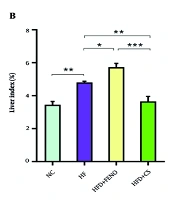
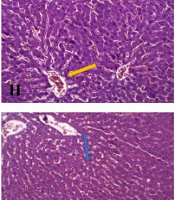
After eight weeks, rats on a HFD showed a significant increase in body weight (P < 0.001), which was attenuated following treatment with fenofibrate, curcumin, or nanocurcumin (Figure 2A). The liver index also rose significantly in the HFD group (P < 0.01) and was notably reduced in all treatment groups (Figure 2B). Hepatic triglyceride levels were markedly elevated in HFD -fed rats and significantly decreased after drug administration, particularly with nanocurcumin (Figure 2C). Histological analysis confirmed severe steatosis and inflammation in the HFD group, which were alleviated by all treatments to varying degrees, most prominently by nanocurcumin (Figure 2D).
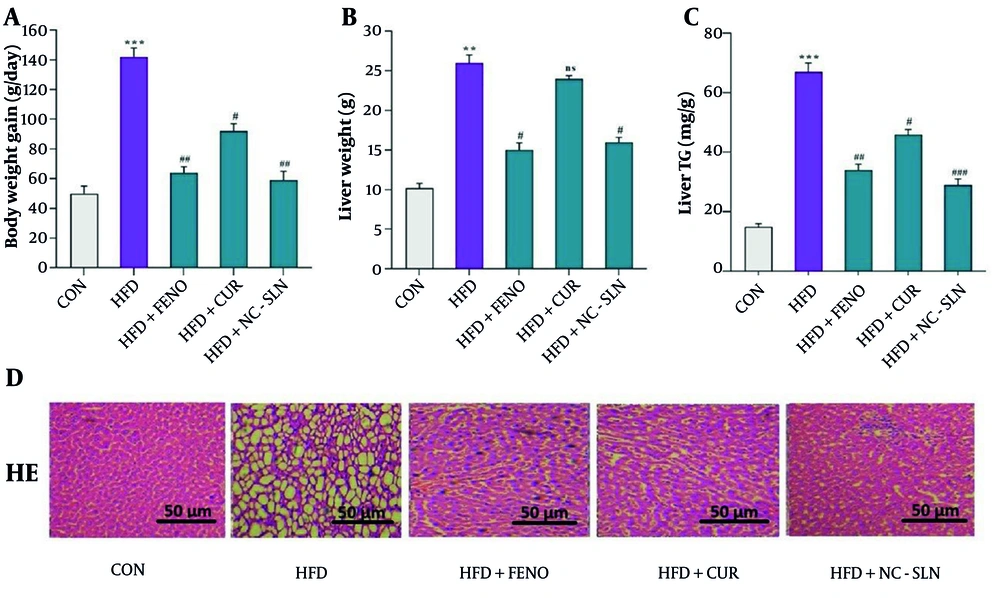
Figure 2.
Effects of treatments on body weight, liver index, hepatic triglyceride levels, and liver histology. A, body weight; B, Liver Index (liver weight/body weight); and C, hepatic triglyceride content were markedly elevated in the high-fat diet (HFD) group compared with the control (CON). These parameters were significantly reduced following treatment with fenofibrate, curcumin, or nanocurcumin; D, representative hematoxylin and eosin (H&E)-stained liver sections showing hepatic architecture and lipid accumulation across groups (magnification: 400×; scale bar: 50 µm). FENO = fenofibrate; CUR = curcumin; NCSLN = nanocurcumin; CON = control. Data are expressed as mean ± SEM. ** P < 0.01, *** P < 0.001 vs. CON; # P < 0.05, ## P < 0.01, ### P < 0.001 vs. HFD.
4.3. Lipid Profiles and Liver Enzyme Changes After Drug Treatment
The HFD group exhibited a marked elevation in serum ALT and AST levels compared to the normal control group (P < 0.001), reflecting hepatic injury (Figure 3A and B). Additionally, a significant reduction in HDLC (Figure 3C) and an increase in LDLC levels (Figure 3D) were observed in the HFD group. Administration of fenofibrate, curcumin, or nanocurcumin significantly ameliorated these alterations, as evidenced by decreased ALT, AST, and LDLC levels and restored HDLC levels relative to the HFD group (P < 0.01). Notably, nanocurcumin treatment exerted superior efficacy in normalizing these parameters compared to fenofibrate or curcumin alone.
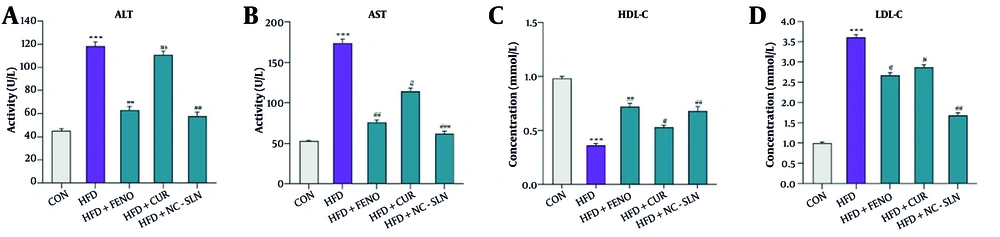
Figure 3.
Changes in lipid profile and liver enzymes following treatment with fenofibrate, curcumin, and nanocurcumin. A, alanine aminotransferase (ALT) levels; B, aspartate aminotransferase (AST) levels; C, high-density lipoprotein cholesterol (HDL-C) levels; and D, low-density lipoprotein cholesterol (LDL-C) levels. The high-fat diet (HFD) group showed a significant increase in ALT, AST, and LDL-C, along with a notable reduction in HDL-C compared to the control (CON) group. Treatment with the indicated compounds significantly reversed these alterations. Statistical significance versus the control group is indicated by * P < 0.05, ** P < 0.01, *** P < 0.001, and versus the HFD group by # P < 0.05; ## P < 0.01; ### P < 0.001.
4.4. Lipid Metabolism-Related Gene Expression in Liver Tissue
As illustrated in Figure 4A and B, rats in the HFD group exhibited significantly elevated hepatic expression of SREBP1c and ACC compared to the control group. In contrast, the expression levels of PPARα and CPT-1a were markedly reduced (Figure 4C and D). Treatment with fenofibrate, curcumin, or nanocurcumin significantly reversed these alterations, with all three compounds downregulating SREBP1c and ACC expression while upregulating PPARα and CPT-1a levels compared to the HFD group. The most pronounced improvements were observed in the nanocurcumin-treated group.
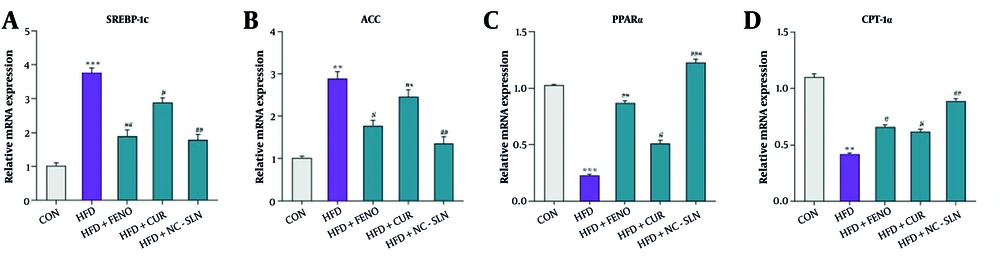
Figure 4.
Hepatic gene expression related to lipid metabolism following treatment with fenofibrate, curcumin, and nanocurcumin. A, sterol regulatory element-binding protein 1c (SREBP-1c); B, acetyl-CoA carboxylase (ACC); C, peroxisome proliferator-activated receptor alpha (PPARα); and D, carnitine palmitoyltransferase 1 alpha (CPT-1α) mRNA levels were measured by quantitative polymerase chain reaction (qPCR) and normalized to glyceraldehyde 3-phosphate dehydrogenase (GAPDH). Expression fold changes were calculated using the 2-ΔΔCT method. Significant differences vs. control: ** P < 0.01, *** P < 0.001; vs. HFD group: # P < 0.05, ## P < 0.01, ### P < 0.001.
4.5. Nicotinamide Adenine Dinucleotide Phosphate Oxidase Isoforms and Reactive Oxygen Species Levels in Liver Tissue
A significant upregulation of NADPH oxidase 1 (NOX1) mRNA expression was observed in the HFD group relative to the control (Figure 5A), indicating enhanced oxidative enzyme activity. Similarly, the expression of NADPH oxidase 2 (NOX2) (Figure 5B) and NADPH oxidase 4 (NOX4) (Figure 5C) was markedly higher in the HFD-fed rats, reflecting increased pro-oxidant signaling. Administration of fenofibrate, curcumin, or nanocurcumin led to a substantial downregulation of all three NADPH oxidase isoforms, with nanocurcumin showing the most pronounced effect. In line with these findings, ROS accumulation was also significantly elevated in the HFD group but was significantly mitigated upon treatment, especially with nanocurcumin (Figure 5D), suggesting effective restoration of oxidative balance.
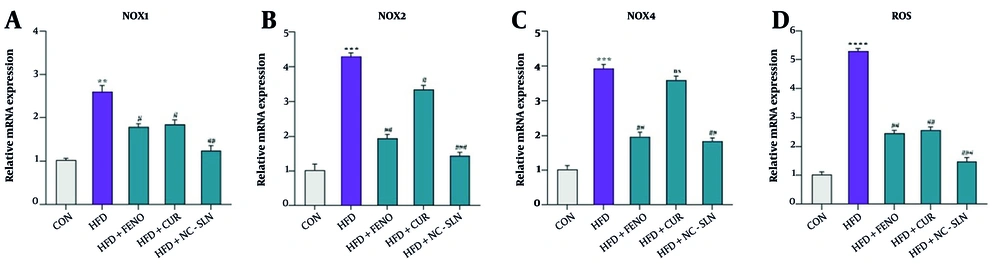
Figure 5.
Expression of genes related to antioxidant defenses and reactive oxygen species (ROS) levels in liver tissue. A - C, the relative mRNA expression of nicotinamide adenine dinucleotide phosphate (NADPH) oxidase 1 (NOX1), NADPH oxidase 2 (NOX2), and NADPH oxidase 4 (NOX4) was measured using real-time polymerase chain reaction (PCR) and normalized to glyceraldehyde 3-phosphate dehydrogenase (GAPDH) as the internal control (CON); D, the levels of ROS were assessed before and after treatment with fenofibrate, curcumin, and nanocurcumin. Statistical significance compared to the control group is indicated by * P < 0.05, ** P < 0.01, *** P < 0.001, **** P < 0.0001; significance versus the high-fat diet (HFD) group is indicated by # P < 0.05, ## P < 0.01, ### P < 0.001.
4.6. Protein Expression Levels of Lipid Metabolism Markers in Liver Tissue
Western blot analysis revealed that the HFD markedly increased the protein levels of SREBP1c (Figure 6A and B), while significantly reducing the expression of PPARα (Figure 6A and C) in comparison with the control group (P < 0.05). Treatment with fenofibrate, curcumin, or nanocurcumin effectively reversed these changes, suggesting restored lipid metabolic regulation in hepatic tissue (P < 0.05).
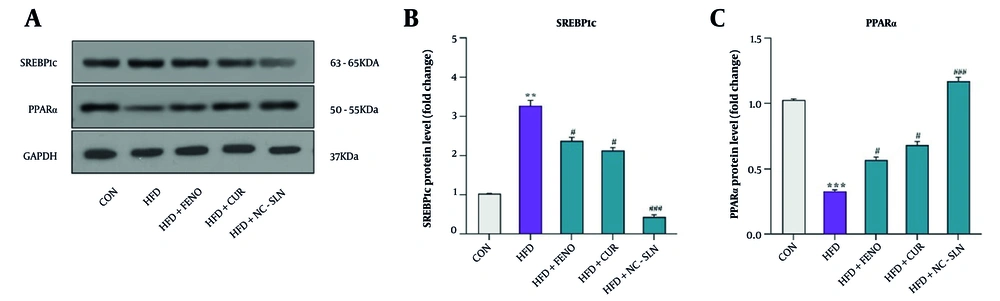
Figure 6.
A, representative Western blot images showing the protein expression of sterol regulatory element-binding protein-1c (SREBP-1c) and peroxisome proliferator-activated receptor-α (PPARα) in liver tissues of control, HFD, and treatment groups. Glyceraldehyde 3-phosphate dehydrogenase (GAPDH) was used as the loading control. B, quantitative analysis of SREBP-1c protein expression. Western blot results demonstrated that the HFD group exhibited a significant increase in SREBP-1c levels compared with the control group. Treatment with fenofibrate, curcumin, and particularly nanocurcumin significantly reduced SREBP-1c expression, indicating suppression of hepatic lipogenesis. C, quantitative analysis of PPARα protein expression. The HFD group showed a marked reduction in PPARα levels compared to the control group. Administration of fenofibrate, curcumin, and especially nanocurcumin significantly increased PPARα expression, suggesting an improvement in hepatic lipid oxidation. Glyceraldehyde 3-phosphate dehydrogenase (GAPDH) was used as the internal loading control. Full-length, uncropped blots for SREBP-1c, PPARα, and GAPDH are provided in the Supplementary Files (S1–S3). Expression fold changes were calculated using the 2-ΔΔCT method. Significant differences vs. control: ** P < 0.01, *** P < 0.001; vs. HFD group: # P < 0.05, ### P < 0.001.
5. Discussion
Non-alcoholic steatohepatitis is a multifactorial metabolic disorder characterized by excessive hepatic lipid accumulation accompanied by inflammation and progressive liver injury that may advance to fibrosis or cirrhosis (32, 33). Dysregulated lipid metabolism, OS, and inflammatory responses play central roles in its pathogenesis (34). In this study, fenofibrate, curcumin, and nanocurcumin improved metabolic and hepatic abnormalities in HFD-induced NASH rats. All treatments ameliorated dyslipidemia, reduced OS, and improved liver enzyme levels, with nanocurcumin producing the most pronounced effects. Quantitative pharmacokinetic studies in previous reports suggest that nanocurcumin increases curcumin plasma concentration by 3 - 5-fold and prolongs half-life, explaining its enhanced bioactivity (24, 35). Nanocurcumin’s superior performance can be attributed to its improved solubility, cellular uptake, and tissue penetration, enabling more efficient modulation of lipid metabolism and OS pathways. Specifically, nano-encapsulation enhances curcumin’s interaction with hepatocyte targets, leading to stronger suppression of lipogenic genes (SREBP-1c, ACC) and upregulation of β-oxidation regulators (PPARα, CPT-1α). These molecular effects corresponded to more significant reductions in hepatic triglyceride content and serum ALT/AST) levels compared to plain curcumin (P < 0.05), and in some parameters, nanocurcumin also outperformed fenofibrate (P < 0.05). The HFD model showed elevated OS markers (ROS), NADPH oxidase isoforms (NOX1/2/4). Treatment with fenofibrate and nanocurcumin reduced these markers, with nanocurcumin showing a significantly greater effect (P < 0.01). These results indicate that improved bioavailability of nanocurcumin translates to more potent antioxidant and anti-inflammatory activity.
Our findings align well with previous research on fenofibrate, curcumin, and nanocurcumin in metabolic liver disorders. Mahmoudi et al. (36) showed that fenofibrate attenuates hepatic steatosis and OS in HFD-fed rats, which corresponds to our observations of improved liver function and reduced lipid deposition. Similarly, Mahmouda et al. (37) reported that curcumin decreases serum lipids and ALT/AST levels, consistent with the improvements seen in our curcumin-treated group. Clinical data from Jazayeri-Tehrani et al. (38) further demonstrated that nanocurcumin improves lipid profiles, liver enzymes, and inflammatory markers in NAFLD patients; our study extends these findings by illustrating parallel molecular changes, including modulation of peroxisome proliferator-activated receptor alpha and SREBP1c. Additional experimental work by Um et al. (39) and Cunningham et al. (40) also supports curcumin’s role in reducing hepatic steatosis and inflammation through pathways such as AMP-activated protein kinase (AMPK) activation. Likewise, the clinical observations reported by Jazayeri-Tehrani et al. (41) regarding nanocurcumin’s effects on metabolic and inflammatory markers are consistent with the reductions in ROS, NADPH oxidase isoforms, and inflammatory mediators observed in our NASH model. Collectively, these comparisons indicate that the molecular and biochemical responses in our study are in agreement with the broader literature on curcumin-based interventions.
An emerging concept in nanomedicine is that nanoformulation can enhance therapeutic performance not only by improving drug delivery but also by increasing molecular proximity to cellular targets (42). For nanocurcumin, the nanoscale size and larger surface area may enable more efficient interaction with receptors and intracellular signaling pathways, thereby strengthening its biological activity (43). These physicochemical advantages contribute to the greater efficacy of nanocurcumin compared to native curcumin. Furthermore, its improved ability to penetrate tissue barriers, including the hepatic sinusoidal endothelium, supports its enhanced biological impact. These advantages may contribute to the stronger suppression of lipogenesis and enhanced β-oxidation seen in our nanocurcumin group compared to both fenofibrate and curcumin. Furthermore, nanocurcumin retained the anti-inflammatory and antioxidant abilities of native curcumin and amplified them, as indicated by the observed decreases in pro-inflammatory cytokines and OS markers. These findings echo earlier reports showing that the nanoform reduces systemic inflammation, improves insulin sensitivity, and modulates metabolic pathways more effectively than standard curcumin (43).
Despite the strengths of our findings, several limitations should be acknowledged. First, only male rats were used, although sex differences in NASH development, hormonal regulation of lipid metabolism, and responsiveness to antioxidants have been reported; therefore, results may not fully translate to female physiology. Second, the duration of treatment was relatively short, and long-term effects — particularly regarding fibrosis progression or regression — remain unknown. Third, although nanocurcumin demonstrated superior efficacy to curcumin, the safety profile of chronic nanoformulated compounds needs further evaluation, especially regarding nanoparticle accumulation, long-term hepatic handling, and potential off-target effects. Fourth, while our study followed widely accepted in vivo practices, an empty nanoparticle (carrier-only) control group was not included. Although lipid-based carriers used in nanocurcumin formulations are generally considered biologically inert at the administered doses, incorporating a blank-nanoparticle control in future studies would help better delineate the specific contribution of the nano-carrier and further strengthen mechanistic interpretation. Finally, extrapolation to humans should be made cautiously, as differences in nanoparticle distribution, metabolism, and clinical dosing may influence therapeutic outcomes.
In summary, our data indicate that nanocurcumin, through its improved bioavailability and enhanced modulation of lipid metabolism, OS, and inflammatory pathways, exerts more pronounced benefits in NASH compared with native curcumin. While these findings support its therapeutic potential, further studies — including long-term, sex-balanced, and clinically oriented investigations — are needed to fully clarify its safety, efficacy, and translational applicability.
5.1. Conclusions
In conclusion, our findings demonstrate that both nanocurcumin and fenofibrate individually exert protective effects against diet-induced NAFLD. These agents modulate genes and proteins involved in lipogenesis and fatty acid β-oxidation, enhance antioxidant defenses, and reduce OS, thereby reversing hepatic steatosis and improving liver function. Notably, nanocurcumin exhibited greater efficacy, likely due to its enhanced pharmacokinetic and bioavailability profile. Overall, these results highlight nanocurcumin as a promising therapeutic candidate for NAFLD management.